

1. Questions
The El Paso–Ciudad Juárez region has long functioned as one binational metropolitan area divided by a border but united by land ports of entry. The border has been the second-busiest border between the United States and Mexico, with almost 30 million people and 12 million vehicles crossing from Juárez, Mexico, to El Paso, Texas, in 2019 (Bureau of Transportation Statistics 2022). Cross-border mobility, however, suffered an abrupt change on March 21, 2020, 10 days after the World Health Organization (WHO) declared COVID-19 a pandemic (WHO, 2020). After a mutual agreement between the US and Mexican governments, northbound entries were temporarily restricted to essential travelers or US citizens/residents (US Customs and Border Protection 2020). These restrictions significantly affected and reshaped cross-border mobility, leading to this study’s two initial research questions: (1) How much did the travel restrictions affect cross-border trips in terms of volume and trip purpose? (2) How did volume variations impact the cross-border mobility patterns?
Data that depict activity related to the origin-destination of cross-border trips have traditionally been limited to a few sources and gathered mainly from traditional surveys. However, “advancements in technologies and the proliferation of smartphones have created new data sources that can help eliminate limitations related to small sample size and infrequent updates due to limited resources” (Lee and Sener 2020). Crowdsourced data sources in particular might be beneficial for addressing the unique limitations to capturing cross-border trip data—such as those related to scarce resources and complications arising from the involvement of international jurisdictions. Thus, we conducted a cross-border mobility analysis using location-based crowdsourced data, which led to the emergence of a third research question: What is the potential of crowdsourced data sources for exploring cross-border trips?
2. Methods
The primary data used in this study were obtained from INRIX, which collects detailed trip information on a continuous time-space spectrum utilizing location-based data through mobile phones and connected vehicles (INRIX, n.d.). INRIX data provide many attributes for each trip registered, including the origin and destination coordinates. To capture the effect of the pandemic, pre- and post-travel restriction data were used. The pre-restriction data (October–November 2019, and Jan 20–March 19, 2020) demonstrated a typical traffic flow between the El Paso–Ciudad Juárez border cities, while post-restriction data (March 20–April 19, 2020) captured the initial period of border restrictions. In other words, we explored four months of pre-pandemic data (from two different periods) and one month of data following the border travel restrictions.
We conducted extensive data cleaning processes to prepare the data for analysis (see Vargas et al. 2021 for details). In brief, to identify northbound (southbound) cross-border trips, we filtered the trips with origins in Mexico (United States) and destinations in the United States (Mexico). Trips with origins or destinations at the border were removed since INRIX identifies a trip as ended when no movement greater than 100 meters in 10 minutes is detected (Montero and Ros-Roca 2020). This procedure can be problematic in the context of cross-border trips (e.g., crossing time could take more than two hours due to border wait times). Finally, we segregated trips based on attributes from INRIX. Trip purposes were also identified for northbound trips—for which Point of Interest (POI) data from SafeGraph (n.d.) land use data were available—by linking the destination to the closest land use by parcel and POI within 200 ft (~61 meters). We analyzed the data through an exploratory approach, including an extensive descriptive exploration of patterns in trips crossing the border, with a focus on vehicle type, trip time (month, day of week, and time of day), trip distance, and trip purpose.
3. Findings
For the study period, 94,336 northbound and 153,435 southbound cross-border trips were registered. Figure 1 demonstrates the trip volume distribution by period. While monthly trip rates were similar during the pre-pandemic period, COVID-19 impacted border traffic drastically, with a significant reduction after border restrictions were implemented. Regardless of the direction of travel, cross-border trip volume was reduced by more than 50 percent compared to the pre-pandemic months of the study period. In addition to the cross-border travel restrictions, other policies that reduced the number of trips included business and recreational area closures, social distancing practices, and stay-at-home orders proposed by both country governments—potentially resulting in the lowest trip volume in 2020 (see also Gurbuz, Aldrete, and Vargas 2020).
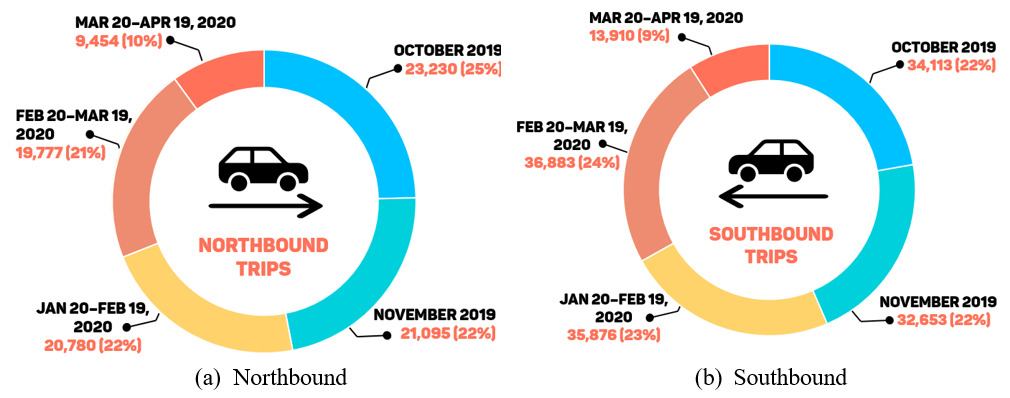
Table 1 provides the cross-border trip distribution by vehicle type by period. Expectedly, passenger vehicles were by far the most common vehicle type in both directions, with more than 90 percent of the cross-border trips being passenger vehicles. This finding is consistent with the data provided by BTS (2020), which reported that 93 percent of the total crossings were passenger vehicles and 7 percent were commercial vehicles. Commercial vehicles were also affected during the first month after the pandemic declaration. While the reduction in both types of vehicles can be considered extreme, the passenger vehicles observed a higher reduction, probably because trips made by commercial vehicles were considered essential travel. Similar results were obtained by Maoh and Anderson (2021) in terms of reduced rates in truck movement across the U.S.-Canada border-crossings. The reduction in commercial traffic can be attributed to the closure of manufacturing plants in Mexico since only essential manufacturing plants could operate at the time, thereby reducing the export volume to the United States from Mexico.
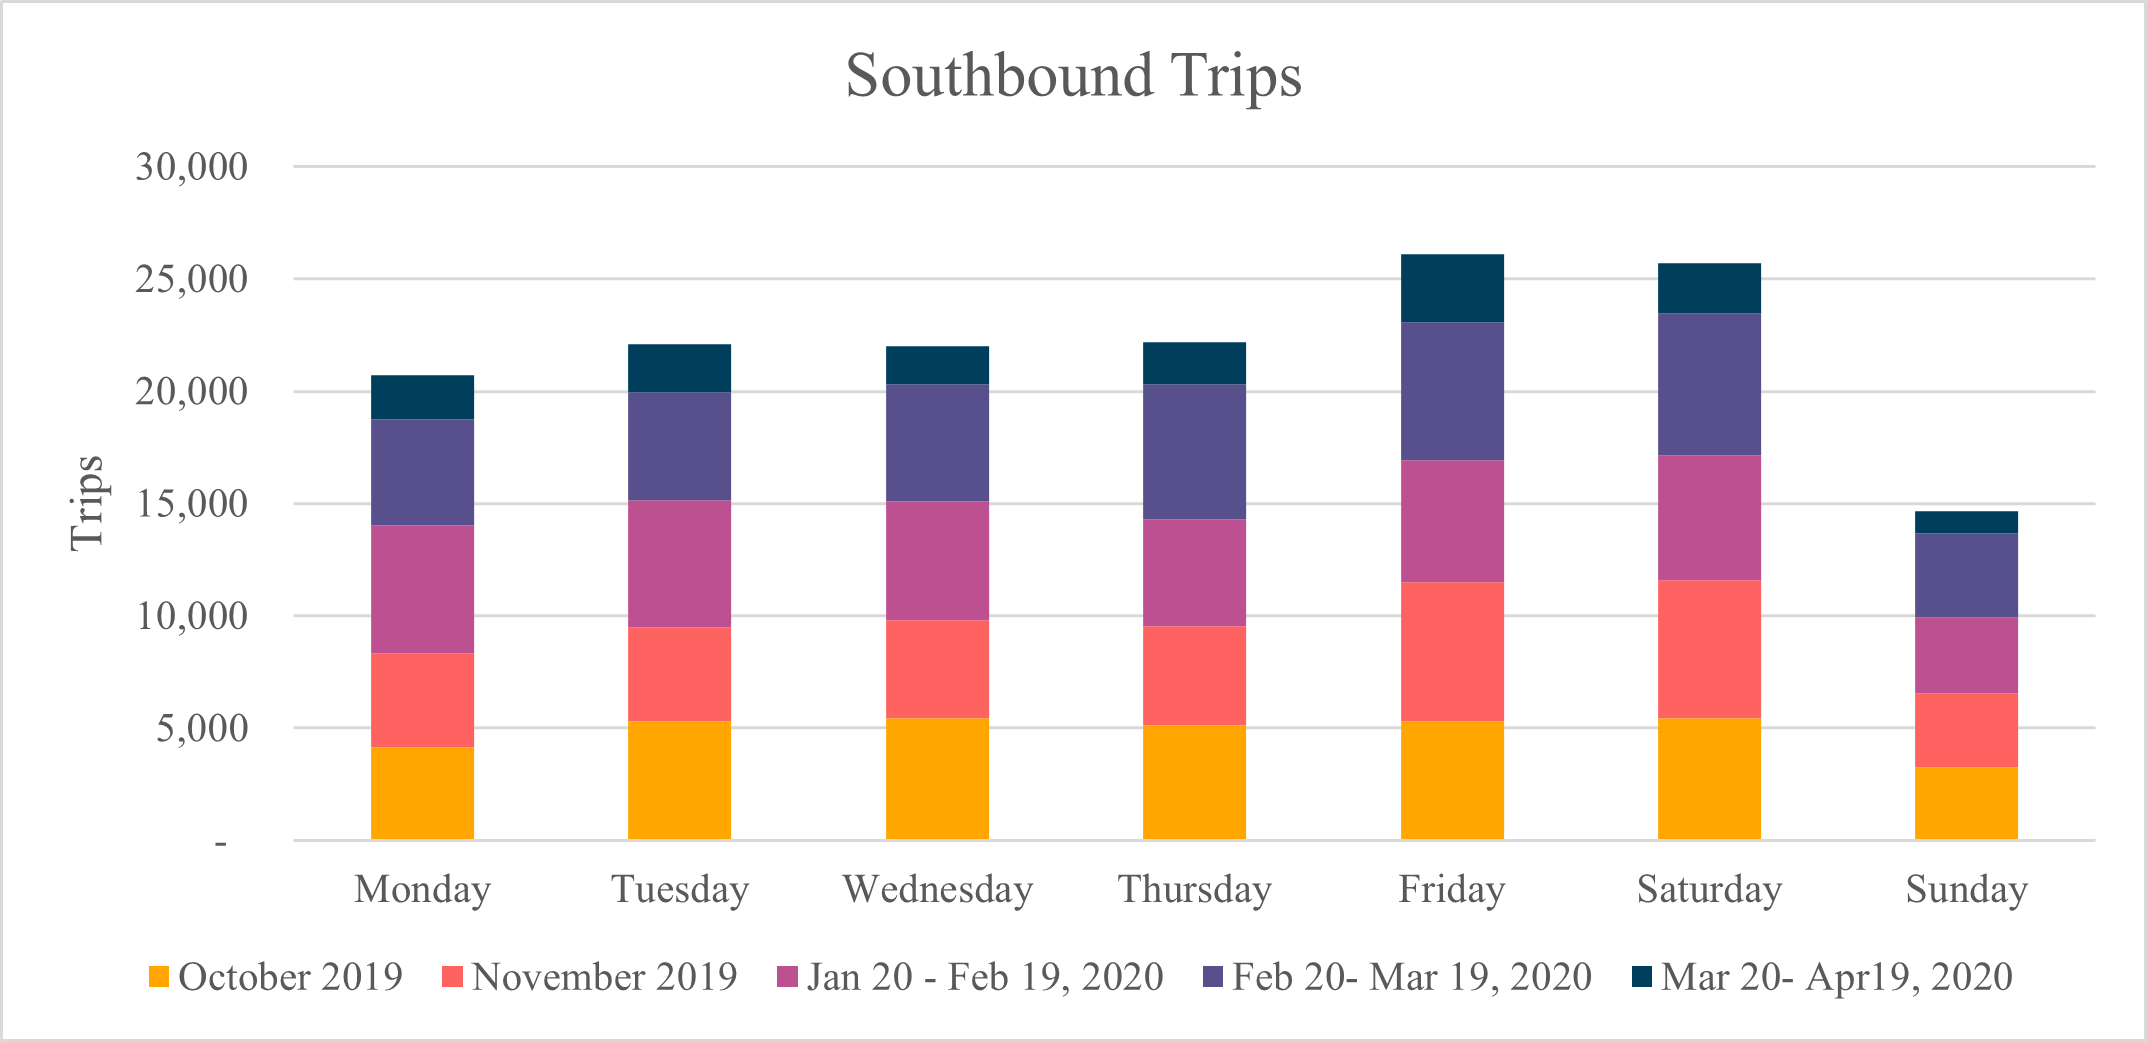
Figure 2 and Figure 3 provide the cross-border trip volume by day of the week for northbound and southbound directions, respectively. The findings indicated higher traffic volume on weekdays versus weekends for northbound trips. In contrast, Fridays and Saturdays saw the highest trip volume for southbound trips. Regardless of the trip direction, Sunday had the lowest trip volume. A similar trend was observed for pandemic data (though with a lower volume), indicating that travel restrictions did not affect the overall pattern.


Table 2 shows the number of monthly trips for various industry categories, excluding the categories that captured less than 160 monthly trips. Although substantial reductions were observed after border travel restrictions, a similar travel pattern occurred before and after restrictions, with residential, retail trade, and food services trips being significant in both periods. Among all categories, finance and insurance trips were affected the least, with a 44 percent average monthly trip reduction. Although recreational trips did not appear in the top visited industry categories, they registered the highest reduction, with a 74 percent monthly decrease, after travel restrictions.
Acknowledgments
This research was performed by the Center for International Intelligent Transportation Research, a part of the Texas A&M Transportation Institute. The contents of this report reflect the views of the authors, who are responsible for the facts and the accuracy of the data presented herein. The authors would like to thank TTI researcher David Salgado for his help in the earlier stage of data compilation and TTI editor Dawn Herring for her editorial review. The authors also thank two anonymous reviewers as well as the editor for their insightful feedback.