1. Questions
On August 25 of 2017, Hurricane Harvey churned toward the Texas coast. The largest tropical rainstorm slammed into the Houston coast late that night and major parts of Houston were flooded overnight (Washington Post 2017). Harvey wandered around Galveston Bay for four days, three times in and two times out, pouring more than 19 trillion gallons of rainwater over Houston and its surrounding regions. As a result, Harvey produced the largest rainfall event among all U.S. hurricanes on record. The storm induced 80 fatalities in the greater Houston area, and most were resulted from drowning (Jonkman et al. 2018). Nearly 80,000 homes were inundated with 18 inches of floodwater (FEMA 2017). Under climate change, the flood risk is predicted to significantly increase over the next century (Marsooli et al. 2019). Flood risk mitigation is a topic in need of urgent research (Shao, Feng, and Lin 2019).
Emergency rescue is the final approach to protect residents from hazards and swift water rescue saves lives (Chang, Tseng, and Chen 2007). The flooding during Harvey led to more than 60,000 rescues (FEMA 2017). In this study, our main research question is: how did four major contextual forces including social vulnerability, exposure to flooding, traffic accessibility and informed flood risk influence the spatial distribution of people who sought rescues during Harvey? Meanwhile, we also aim to test whether the distribution of rescue requests due to real-time flooding exposure is different from the distribution of informed flood risk through FEMA’s designated flood zone.
2. Methods
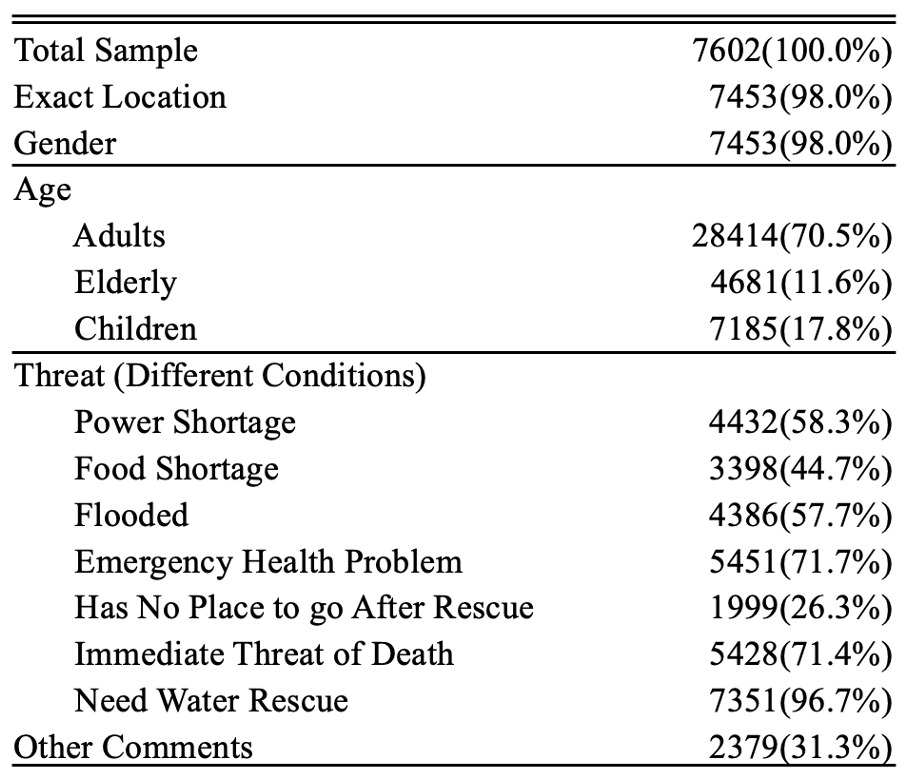
In this study, we focus on the Hurricane Harvey rescue data that came from the Red Cross website (Houston American Red Cross 2017). During Hurricane Harvey, the local administration was overwhelmed with rescue requests. Thus, the Red Cross created this website and posted rescue requests online to solicit public assistance. Users could place a pin on a Google map to alert rescuers. In addition to giving rescuers a real-time glimpse of needs around the city, pins may be colored to indicate urgency and removed after the rescue. When volunteers discovered nearby rescue requests on the website, they tried to rescue people by car, boat, canoe, or kayak. This site led to approximately ~7,600 active rescues (13% of total rescues). A requestor’s location, age, water/food/electricity availability and whether they were in danger of life are all included in the dataset (data summary shown in Table 1). From Aug 27 to 30, there are 7453 requests after duplicate, mis-located and empty data are cleaned. A group of people may request for rescue together, and in total, there were 40280 people requesting for rescue.
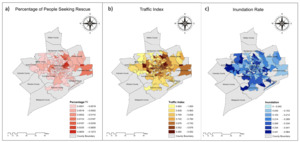
The basic geographic unit of our analysis is neighborhood defined by zip code. To note, this resolution ensures data such as rescue request and demographic data to be available at the same geographic scale, although this resolution ignores variations of local flood conditions within a zip code. Our variable of interest is percentage of people seeking rescues during Harvey. In each zip code, this variable is defined as: (number of individuals requesting rescues)/(population). Fig. 1a demonstrates the geographic distribution of people seeking rescues during Harvey. The eastern part of Houston - Harris County, Montgomery County, and Chambers County - has the highest percentages. We considered several variables to indicate social vulnerability across the study area. These criteria were considered based on both the social vulnerability literature and the descriptions supplied by those seeking rescues. The variables include percentages of young people (<15), old people (>65), and male population from the 2010 Census. The percentage of people living in poverty, percentage of people who speak limited English, percentage of people without a car, percentage of people with disabilities are extracted from 2009-2013 American Community Survey (ACS). In addition, we included level of income, unemployment rate, and crime rate at the zip code level. We also calculated the percentage of high-risk flood zones (A and V zones in FEMA’s flood map) in each zip code.
We created two indexes related to the built environment to represent Harvey’s traffic and inundation, respectively (shown in Fig. 1b and c). The traffic index measures the traffic condition during Harvey, based on the reciprocal of time it would take to evacuate out of Houston during Hurricane Harvey (averaged from August 27 to 29), normalized by the normal traffic time cost. Both time costs are measured in minutes and calculated using shortest path given the traffic condition for the specific time point. The traffic condition data during Harvey and at normal times were derived from Houston traffic records (TranStar 2017). The inundation index shows the extent of inundation among residential buildings during Harvey. In each zip code, this index is defined as: (number of flooded houses/ total number of residential buildings). It is further normalized by the largest rate over the area. The number of flooded houses was derived from FEMA Insurance Reports (FEMA 2017).
3. Findings
We first developed a logistic regression model including all the variables of social demographic (the first set of variables) and event-related variables (the second set of variables) (Table 2; column 1). Based on the AIC model fitting criterion, the final model reveals that four variables related to socio-demographic characteristics have significant effects on the percentage of people who sought rescue per zip code in Houston during Harvey (Table 2; column 2). These four variables are percentage of young children, percentage of male population, percentage of population in poverty, and percentage of people with limited English. The AIC model reduction results from the model that only includes demographic variables confirm the importance of these variables (Table 2; column 3-4). As expected, neighborhoods with higher percentages of children and people in poverty tend to have higher concentration of people who requested rescues, controlling for the effects of all the other variables. Unexpectedly, neighborhoods with higher percentages of male population are more likely to have more individuals seeking rescues. Conventionally, female population is defined as socially vulnerable group, and they are more prone to suffering and loss in disasters (Cutter, Boruff, and Shirley 2003). The possible reason for this result in this context is that males may be less likely than females to evacuate before the event. Percentage of people who speak limited English is negatively correlated with rescue requests, indicating not being able to speak English effectively poses challenges to people seeking rescues.
The two most significant factors are flood inundation rate and traffic index, which is confirmed in the regression model that only includes event-related variables (Table 2; column 5). Areas with larger inundation rate and worse traffic condition led to higher percentages of people seeking rescues. We can revisit Fig. 1b and 1c to understand the relationship between these either variable and the evacuation rate. Fig. 1b demonstrates the local traffic condition with a higher number (lighter color) indicating better traffic condition. This map clearly shows substantial resemblance with the map of percentage of people seeking rescues (Fig. 1a). The traffic condition in many zip code areas in Harris County was handicapping efficient evacuation. Fig. 1c displays the inundation rate across Houston and its surrounding area during Harvey. The inundation rate was high across the entire study region. Most zip code areas in Harris County were flooded. For those whose houses were inundated, they could not leave due to the troubling traffic condition. In all, these two trapping factors together explain substantial variances in densities of people seeking rescues during Harvey.
Contrary to our expectations, percentages of A zones and V zones per zip code are not found to significantly affect the density of people seeking rescues. One possible reason is there is discrepancy between the flood map and actual flood distribution. The A zones and V zones reflect 1-percent annual exceedance probability (AEP), meaning an average recurrence interval of 100 years or 1 percent chance of occurring in any given year. The extremity of rainfall brought by Harvey dictates that many affected areas would not be considered as high flood risk zones. In other words, there is a discrepancy between how flood risk is estimated before an extreme event and how flood risk is manifested during an extreme event. In addition, studies have indeed shown flaws and inaccuracy of FEMA’s flood maps (Shan et al. 2010; Xian, Lin, and Hatzikyriakou 2015). Examining the difference between real flood risk and the risk indicated by FEMA flood maps as well as how risks conveyed by FEMA flood maps may influence residents’ risk mitigation decisions including evacuation become important tasks for future research. Also, as an early study using rescue request data to examine hurricane preparation, this paper focused on one extreme event. Future research can apply similar datasets to examine other events in various regions to obtain more general conclusions.
Acknowledgements
Kairui Feng and Ning Lin were supported by National Science Foundation (grant 1652448). Wanyun Shao was supported by the USACE Coastal Compound Flooding Work Unit of the USACE Regional Sediment Management Program award # A20-0545-001. We thank three anonymous reviewers for providing very helpful comments and suggestions.


