Loading [Contrib]/a11y/accessibility-menu.js
Skip to main content
null
Findings
  • Menu
  • Articles
    • Energy Findings
    • Resilience Findings
    • Safety Findings
    • Transport Findings
    • Urban Findings
    • All
  • For Authors
  • Editorial Board
  • About
  • Blog
  • covid-19
  • search

RSS Feed

Enter the URL below into your favorite RSS reader.

http://localhost:24211/feed
Transport Findings
September 01, 2022 AEST

The Mode is not the Methods: Assessing Changes in Biking, Walking and Transit in California using the 2012 CHTS and 2017 NHTS

Susie Pike, Susan Handy,
Active travelsurvey methodsweightingtravel trends
Copyright Logoccby-sa-4.0 • https://doi.org/10.32866/001c.37777
Findings
Pike, Susie, and Susan Handy. 2022. “The Mode Is Not the Methods: Assessing Changes in Biking, Walking and Transit in California Using the 2012 CHTS and 2017 NHTS.” Findings, August. https:/​/​doi.org/​10.32866/​001c.37777.
Save article as...▾
Download all (2)
  • Figure 1. Percent Change in Trip Mode Shares in Preliminary Review of Data from the 2012 CHTS to the 2017 NHTS
    Download
  • Figure 2. Percent Change in Commute Mode Shares from 2012 to 2017
    Download

Sorry, something went wrong. Please try again.

If this problem reoccurs, please contact Scholastica Support

Error message:

undefined

View more stats

Abstract

Data from the 2012 California Household Travel Survey (CHTS) and the 2017 National Household Travel Survey (NHTS) suggest that biking, walking, and transit use in California decreased over this five-year period. In light of the California Department of Transportation (Caltrans) and State Transportation Agency (CalSTA)'s goal of tripling walking and doubling biking and transit use in their most recent strategic plan, these unanticipated results raised concerns about whether these decreases stem from methodological differences and choices about analysis between the two surveys. In this study, we evaluate numerous differences between the two surveys to assess whether the changes are likely to be real, or the result of methodological differences between the CHTS and the NHTS. We find that overall, the use of biking, walking and transit decreased over this time period, and these results are generally consistent across methodological differences and analysis choices.

1. Questions

The most recent surveys of travel patterns in California, the 2012 California Household Travel Survey (CHTS) and the 2017 National Household Travel Survey (NHTS), show a decrease in the use of active modes over this period. Considering Caltrans and CalSTA’s goal of tripling walking and doubling biking and transit use in their most recent strategic plan, we evaluate the reasons for these unanticipated decreases in biking, walking and transit over this five-year time period. In this study we evaluate methodological differences between these two surveys to determine whether these declines may be attributed to such differences, or if indeed the declines are real. We find that the decreases are not likely to be primarily the result of differences in methodology, or analysis choices.

2. Methods

This study uses the 2017 NHTS add-on data for California and the 2012 CHTS data to evaluate changes in the use of active modes in California from 2012 to 2017, and whether these changes can be attributed to methodological differences between the surveys. We investigate the impacts of differences in methods between the two surveys, including difference in mode options in the survey and sample weighting. We also explore different metrics for evaluating mode shares. All analysis was carried out in R (R Core Team 2021). A more detailed discussion of the procedures is provided in Pike and Handy (2021).

Mode Options: The two survey instruments list bike and walk as mode options for trips in the same way, but the 2012 CHTS provides more transit options than the 2017 NHTS. To compare results, we consolidated the 2012 options into those included in 2017. For private vehicles, the 2017 NHTS lists pickup truck, car, SUV, and van. In the 2012 CHTS, the two private vehicle options are auto/van/truck driver and auto/van/truck passenger. We consolidated these into the one option: private vehicle. We present the consolidated modes, their components, and the mode shares in Table 1. A weighted chi-square test was conducted to compare the mode shares across the two years. The results indicate a significant difference in the trip mode shares between 2012 and 2017.

Table 1.Consolidated Modes and Mode Shares1,2
Consolidated Mode Mode Option in 2012 Mode Share 2012 Mode Option in 2017 Mode Share 2017
Airplane Plane 0.10% Airplane 0.16%
All local bus types Airbart /LAX Flyaway, Other Bus, Public Transit Shuttle, Rapid bus, Express Bus / Commuter Bus (Golden Gate, AC Trans), Local Bus, Rapid Bus 2.91% Public or commuter bus 2.09%
Amtrak including bus and commuter rail Amtrak Bus, Ace, Amtrak, Caltrain, Metrolink, Coaster/Sprinter, Other Rail 0.13% Amtrak / Commuter rail 0.28%
Bicycle Bike 1.53% Bicycle 1.34%
City-to-city bus Greyhound bus 0.00% City-to-city bus (Greyhound, Megabus) 0.02%
Ferry or boat Ferry / Boat 0.01% Boat / ferry / water taxi 0.07%
Metro, rapid, trolley Other Rail, Metro Orange / Silver Line, Bart, Metro Red / Purple Line, VTA, Muni Metro, Blue/Green/Gold Line, Sacramento. SRT, Street Car / Cable Car / Trolley 0.99% Subway / elevated / light rail / street car 0.81%
Motorcycle Motorcycle / Scooter / Moped 0.22% Motorcycle / Moped 0.26%
Paratransit Dial-a-Ride / Paratransit (Access Services) 0.07% Paratransit / Dial-a-ride 0.11%
Private shuttle bus Private Shuttle (Supershuttle, Employer, Hotel), Other Private Transit 0.16% Private / Charter / Tour / Shuttle bus 0.25%
Private vehicle Auto / Van / Truck Driver, Auto / Van / Truck Passenger, Carpool / Vanpool 76.52% Pickup truck, Car, SUV, Van 79.96%
Rental Rental Car / Vehicle 0.16% Rental car (Including Zipcar / Car2Go) 0.14%
School bus School Bus 0.62% School bus 0.67%
Something Else Other private, Wheelchair/ Mobility scooter, Other Non Motorized 0.32% RV (motor home, ATV, snowmobile), Golf cart / Segway 0.34%
Taxi or hired car Taxi / Hired Car / Limo 0.11% Taxi / limo (including Uber / Lyft) 0.54%
Walk Walk 16.17% Walk 12.97%

1Weighted chi-square test used expanded 2012 weights to match the magnitude of the 2017 weighted counts for each mode; mode shares are identical for the expanded vs. unexpanded 2012 weights
2Weighted chi-squared test results: chi-sq test statistic: 37.881, p = 0.0026

Sample Weighting: We examined two key variables used in the sample weights for 2017 but not in 2012: gender and month of the year. In the weighted 2012 data, 48.2% are male and 51.8% are female, compared to 49.7% male and 50.3% female for the California population in 2012 (US Census ACS Data Tables). With these state-wide population shares, we applied a post-hoc gender adjustment for the 2012 weights resulting in each female’s trip counting slightly less (0.9750 times) and each male’s trip a little more (1.032 times).

Mode Share Metrics: Changes in mode choice can be evaluated using metrics other than overall trip mode share. We also examine commute mode share and both distance- and time-weighted trip mode shares. Time-weighted mode shares could not be directly computed for 2012 as the results appear to be incorrect (with some walk trips lasting many hours). Instead, we multiplied the total weighted number of trips by each mode for the full set of 2012 modes by the average travel time for that mode, found in a report summarizing the results of the 2012 CHTS (California Department of Transportation 2013) and then combined them into the consolidated set of modes listed in Table 1.

3. Findings

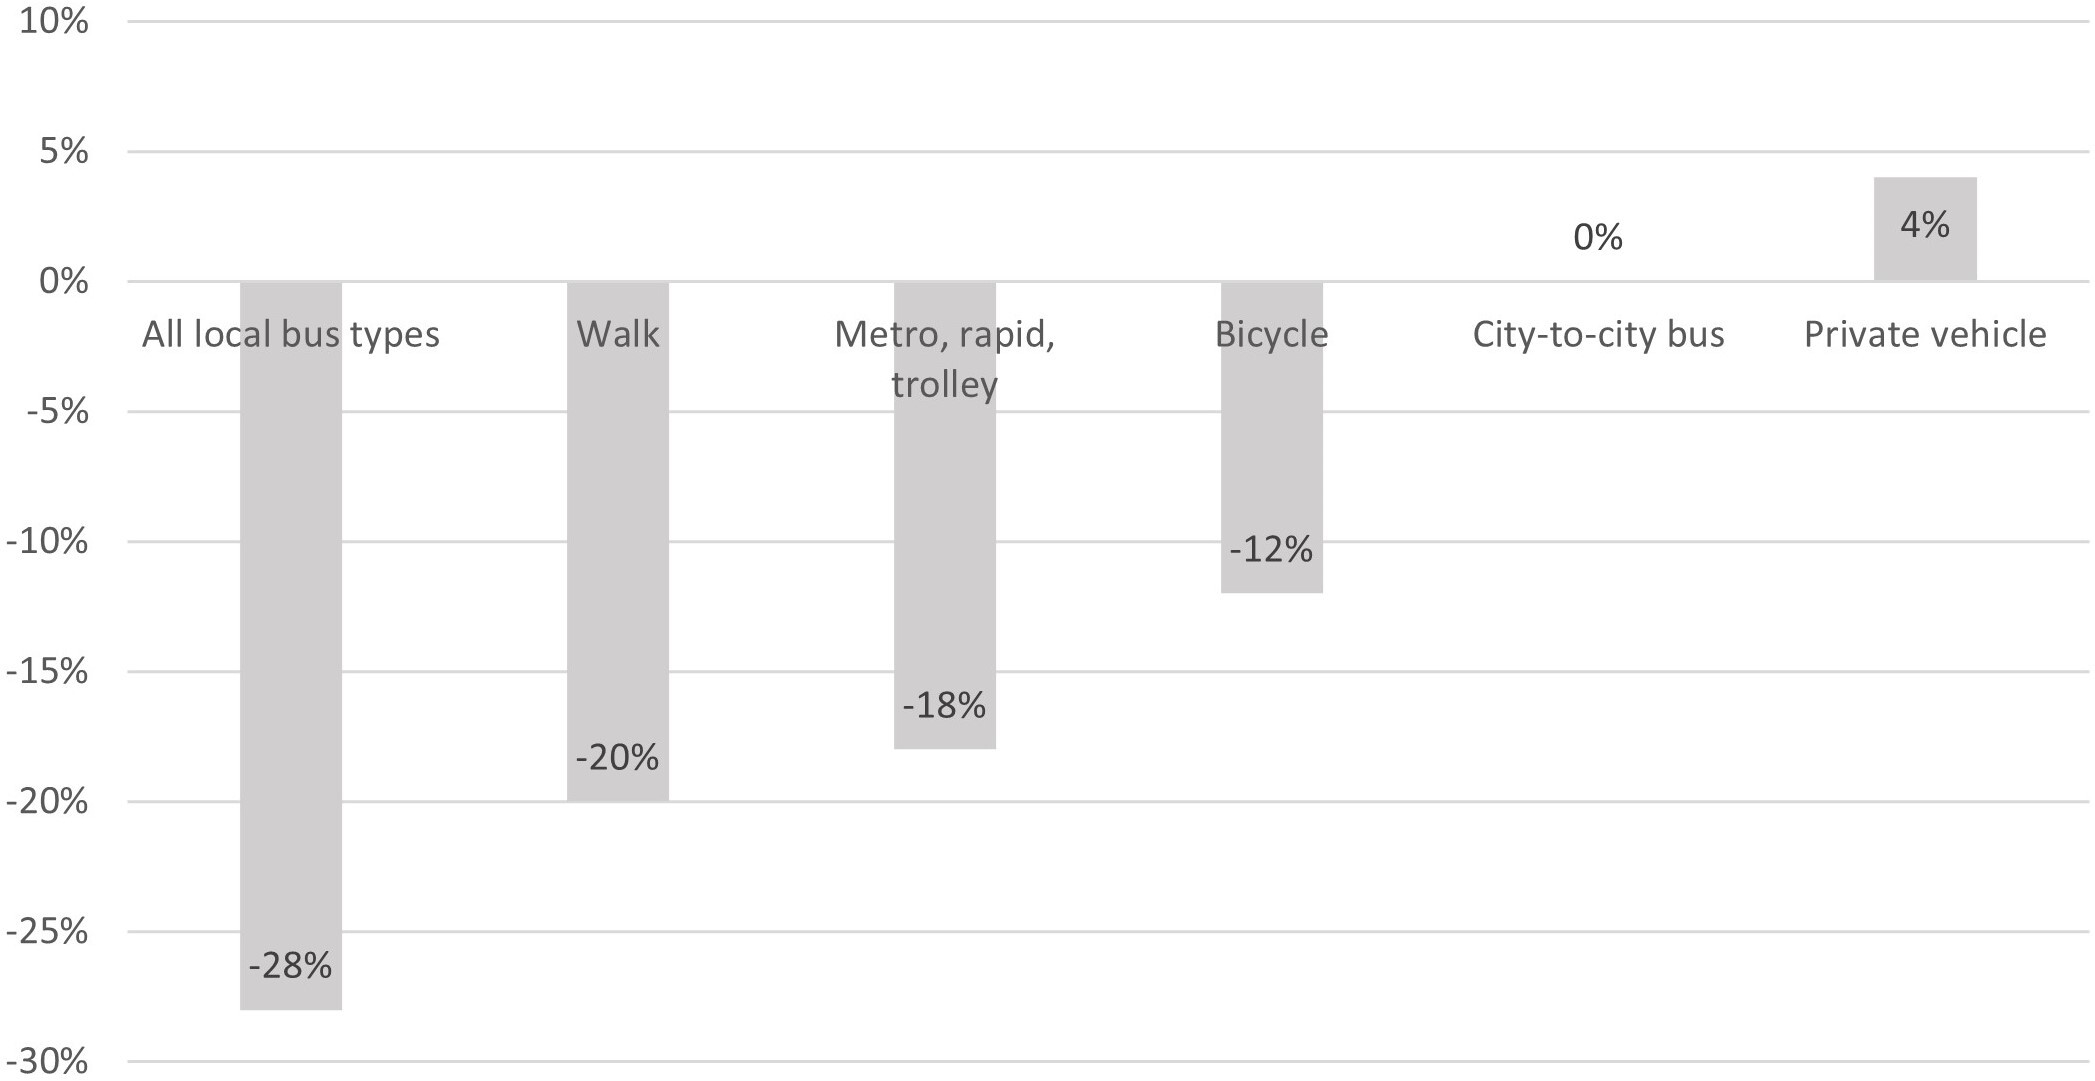
Figure 1 presents the percent change in trip mode shares from 2012 to 2017 after consolidating modes but before adjusting for differences in sample weighting between the surveys. These percent changes should be read as “over the period from 2012 to 2017 biking decreased by 12%”; that is the 2017 value (1.34% of trips) is 12% less than the 2012 value (1.53% of trips).

Figure 1
Figure 1.Percent Change in Trip Mode Shares in Preliminary Review of Data from the 2012 CHTS to the 2017 NHTS

Post-hoc gender adjustments were applied to the 2012 weights but did not result in substantial changes in the 2012 mode shares, as shown in Table 2. Similar adjustments were made for the use of month in the 2017 weights, but as with gender, none substantially impacted the results.

Table 2.2012 Weighted Trip Mode Shares with and without Gender Adjustments to Weights
Mode Gender adjusted count Gender adjusted percent Weighted count Weighted percent
Walk 62749.59 16.14% 62879.18 16.17%
Bicycle 6006.61 1.55% 5943.11 1.53%
Wheelchair or scooter 371.99 0.10% 372.33 0.10%
Other non-motor 556.43 0.14% 550.09 0.14%
Auto - van - truck driver 192738.3 49.61% 192817.6 49.57%
Auto - van - truck passenger 102373.7 26.35% 102597.5 26.38%
Car-vanpool 2195.67 0.56% 2199.43 0.57%
Motorcycle 887.71 0.23% 873 0.22%
Taxi or hired car 420.75 0.11% 421.28 0.11%
Rental 606.4 0.16% 606.76 0.16%
Private shuttle bus 605.21 0.16% 603.71 0.16%
Greyhound 7.38 0.00% 7.37 0.00%
Airplane 383.69 0.10% 382.22 0.10%
Other private 326.08 0.08% 325.66 0.08%
Local or rapid bus 10549.89 2.71% 10581.05 2.72%
Express or commute bus 338.08 0.09% 339.29 0.09%
Metro orange-silver 223.72 0.06% 225.44 0.06%
School bus 2410.06 0.62% 2400.33 0.62%
Public transit shuttle 278.57 0.07% 279.23 0.07%
Airbart LAX Flyaway 11.68 0.00% 11.76 0.00%
Paratransit 257.1 0.07% 258.27 0.07%
Amtrak bus 20.21 0.01% 19.97 0.01%
Other bus 122.42 0.03% 122.64 0.03%
Bart, Metro red-purple 1836.98 0.47% 1833.97 0.47%
Ace, Amtrak, Caltrain, Metrolink, Coaster/Sprinter 470.64 0.12% 468.48 0.12%
VTA, Muni, Metro Blue/ Green /Gold Line, Sacrmnto. SRT 1514.54 0.39% 1510.86 0.39%
Street car to trolley 100.75 0.03% 100.28 0.03%
Other Rail 159.26 0.04% 160.28 0.04%
Ferry or boat 56.56 0.01% 56.05 0.01%
Figure 2
Figure 2.Percent Change in Commute Mode Shares from 2012 to 2017

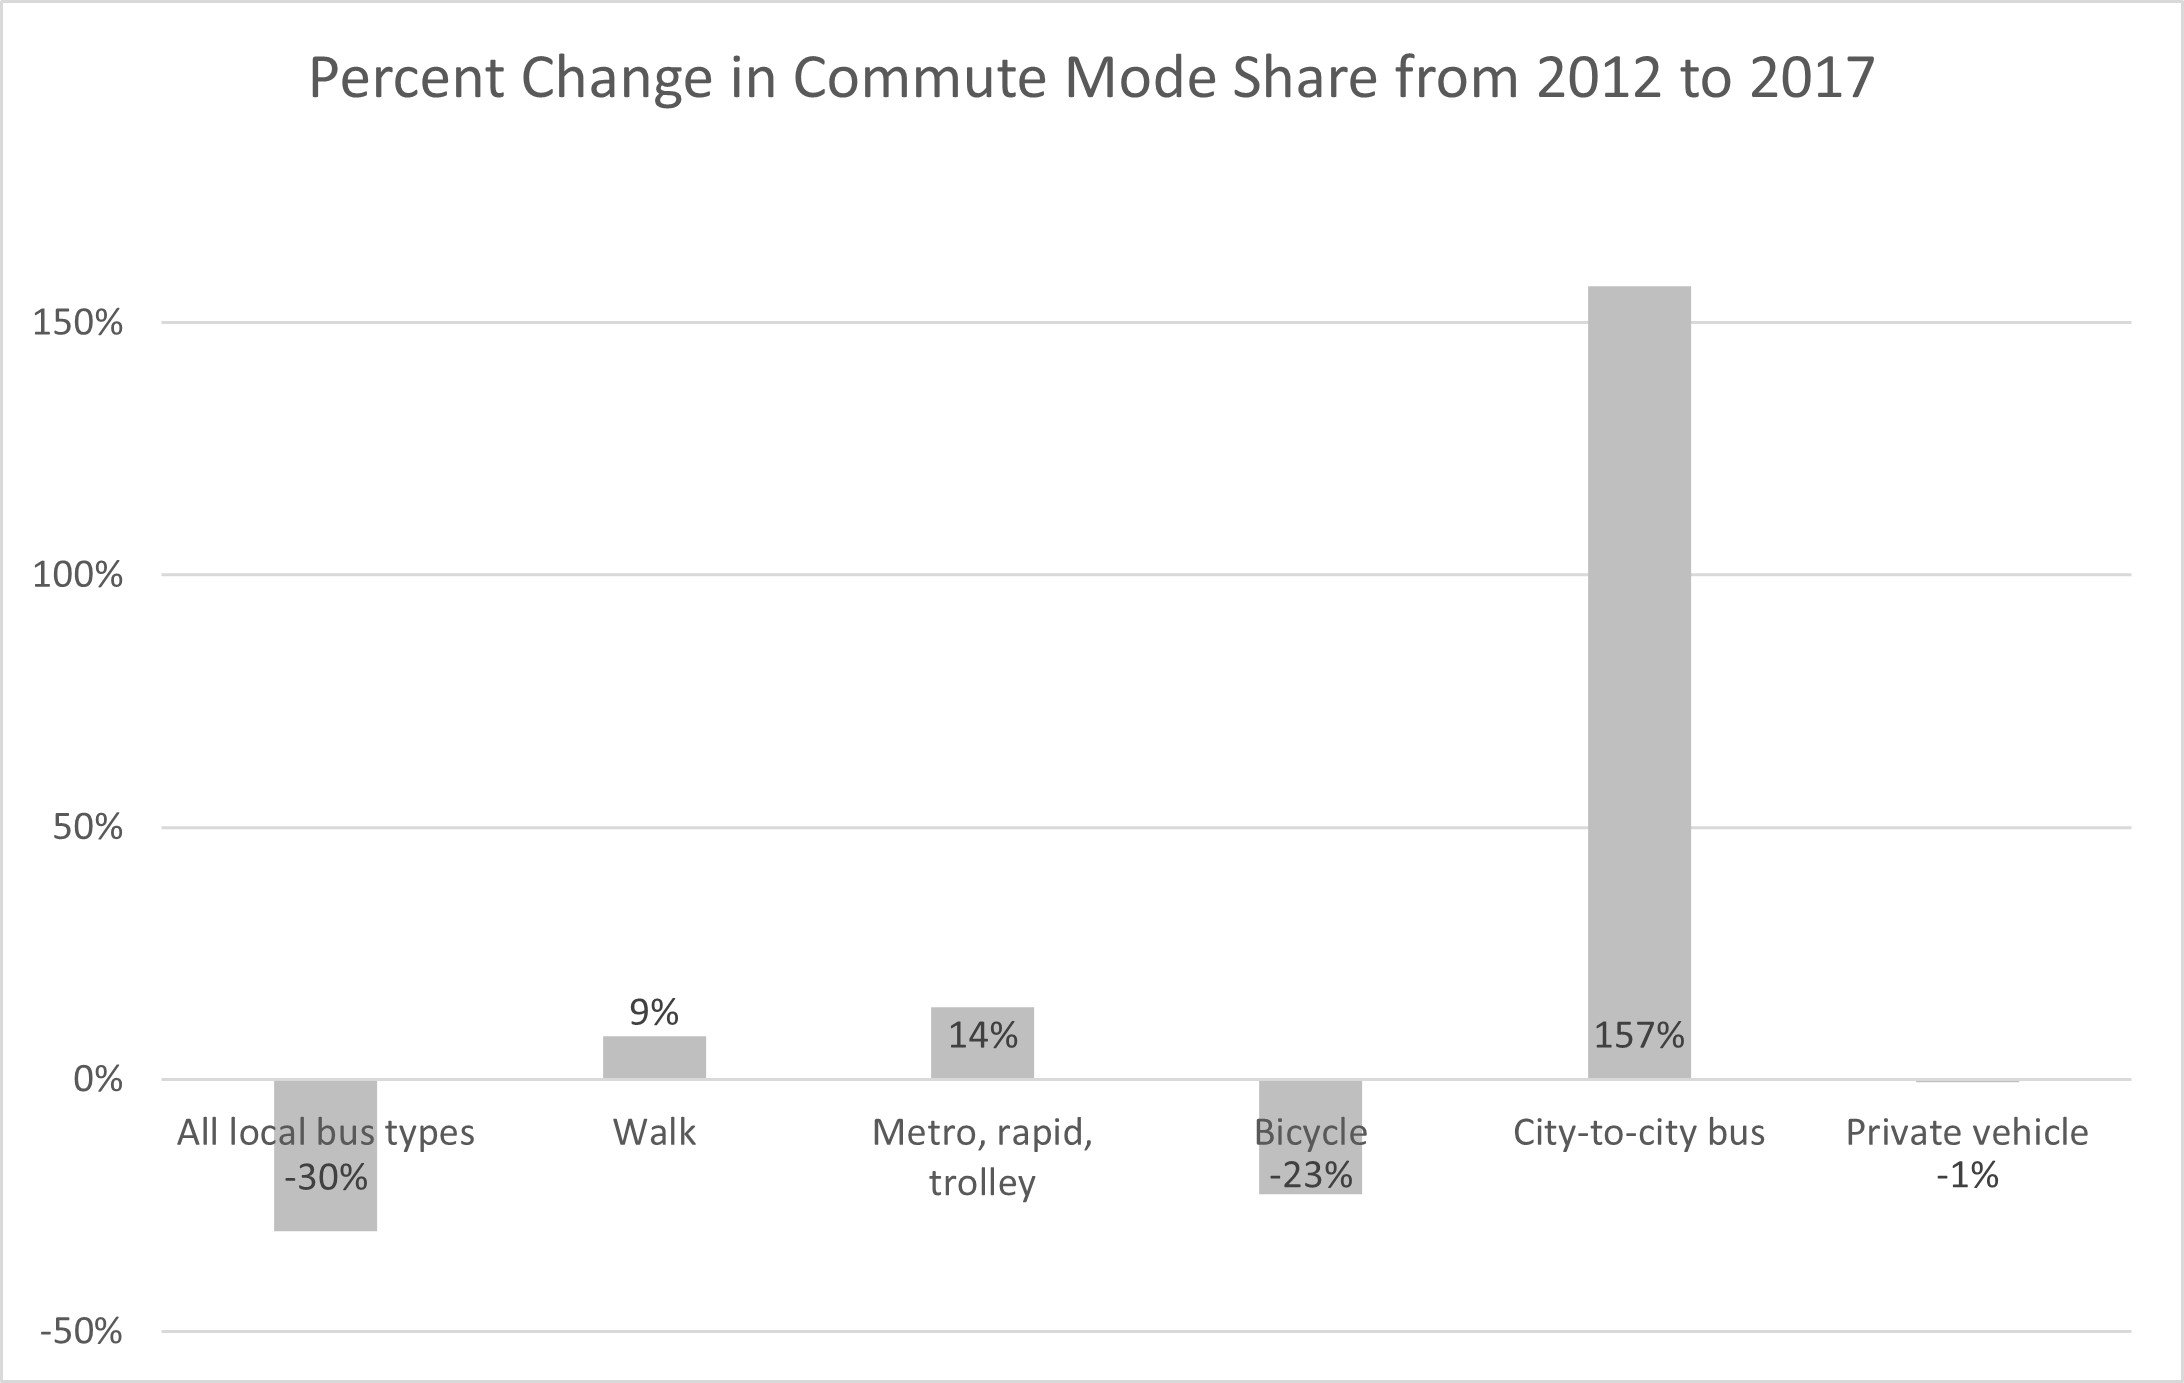
For commute mode to work we find a small increase in walking and some transit modes, from 2012 to 2017. The decrease in biking is larger than for overall trip mode share. Active modes account for a higher share of commute trips than trips in general.

Our analysis of travel distance- and time-weighted mode shares showed that bicycle trips represent 0.71% of the total miles traveled in 2012 but only 0.31% in 2017. Miles travelled walking also decreased to a notable degree, from 1.70% in 2012 to 1.04% in 2017. The other modes saw only small changes.

Table 3.2017 Distance- and Time-Weighted Mode Shares for 2012 and 2017
Mode 2012 Distance-weighted share 2017 Distance-weighted share 2012 Approximate travel time-weighted share 2017 Travel time-weighted share
All local bus types 1.72% 1.68% 3.32% 4.37%
Bicycle 0.71% 0.31% 1.59% 1.14%
City-to-city bus 0.02% 0.04% 0.01% 0.06%
Metro, rapid, trolley 1.31% 1.20% 1.16% 1.84%
Private vehicle 91.19% 91.05% 80.62% 79.00%
Walk 1.70% 1.04% 10.08% 9.29%

Changes in travel time-weighted shares are similar to those of the distance-weighted shares and overall trip mode shares. The increase in the time-weighted share of local bus trips, and to some extent other forms of transit, is not matched by an increase in the total share of bus trips nor in the distance-weighted share, suggesting that bus travel got slower over this period.

The shifts in California’s mode shares from 2012 to 2017 are small, but apparent. Looking at the analysis in a number of ways, and accounting for differences in the surveys and analysis between the NHTS and CHTS, our results suggest that indeed there are decreases in the shares of transit, biking and walk trips that are not primarily the result of methodological differences between the two surveys. Distance- and time-weighted trip mode shares also show decreases, except for some transit modes. Future work should explore potential reasons for these declines, including residual effects of the Great Recession, driver’s license rule changes, cohort effects, infrastructure changes, and shifts in demographics.


Acknowledgments

This study was funded, partially or entirely, by a grant from the National Center for Sustainable Transportation (NCST), supported by the U.S. Department of Transportation (USDOT) and the California Department of Transportation (Caltrans) through the University Transportation Centers program. The authors would like to thank the NCST, the USDOT, and Caltrans for their support of university-based research in transportation, and especially for the funding, input and feedback provided in support of this project. The authors also thank Dr. Dillon Fitch for proposing the project in the first place.

Submitted: June 11, 2022 AEST

Accepted: August 18, 2022 AEST

References

California Department of Transportation. 2013. “2010-2012 California Household Travel Survey Final Report Version 1.0.”
Pike, Susan, and Susan L. Handy. 2021. “Modal Shifts in California from 2012-2017: Investigating Changes in Biking, Walking, and Transit from the 2012 CHTS and 2017 NHTS.” Research Report UCD-ITS-RR-21-19. Institute of Transportation Studies, University of California, Davis.
R Core Team. 2021. R: A Language and Environment for Statistical Computing. Vienna, Austria: R Foundation for Statistical Computing. https:/​/​www.R-project.org/​.
Google Scholar
“US Census Data Tables California Populations and People: Age and Sex 2012.” n.d. Accessed January 5, 2012. https:/​/​data.census.gov/​cedsci/​table?q=California%20Populations%20and%20People&g=0400000US06&tid=ACSST1Y2017.S0101&hidePreview=false.
U.S. Department of Transportation, Federal Highway Administration. n.d. “2017 National Household Travel Survey.” http:/​/​nhts.ornl.gov.

This website uses cookies

We use cookies to enhance your experience and support COUNTER Metrics for transparent reporting of readership statistics. Cookie data is not sold to third parties or used for marketing purposes.

Powered by Scholastica, the modern academic journal management system