

1. Questions
Transport Modelling requires large quantities of data, depending on the project size and level of detail. For example, building a mesoscopic or microscopic model for a neighbourhood, requires detailed road geometry, road type, origin-destination transport demand, and intersection control type and traffic light phasing, to name a few. The work by Barceló, Kuwahara, and Miska (2010) presents different data collection efforts to estimate travel demand, traffic state, and traffic performance. Additionally, Antoniou, Dimitriou, and Pereira (2018) discusses the integration of big data and machine learning in transportation.
Depending on the modelling needs and available resources, data is collected by different means and for different sample sizes. Global positioning system (GPS) data is now collected by widespread communication devices such as smartphones. These devices provide their geographic location and a timestamp at a predetermined high-resolution frequency offering new information that can help in determining road network features.
This work develops a method to infer road intersection control type from GPS points. Such information can be of value for transport modelling when the study area is large, and data cannot be collected as efficiently using traditional observation methods.
2. Methods
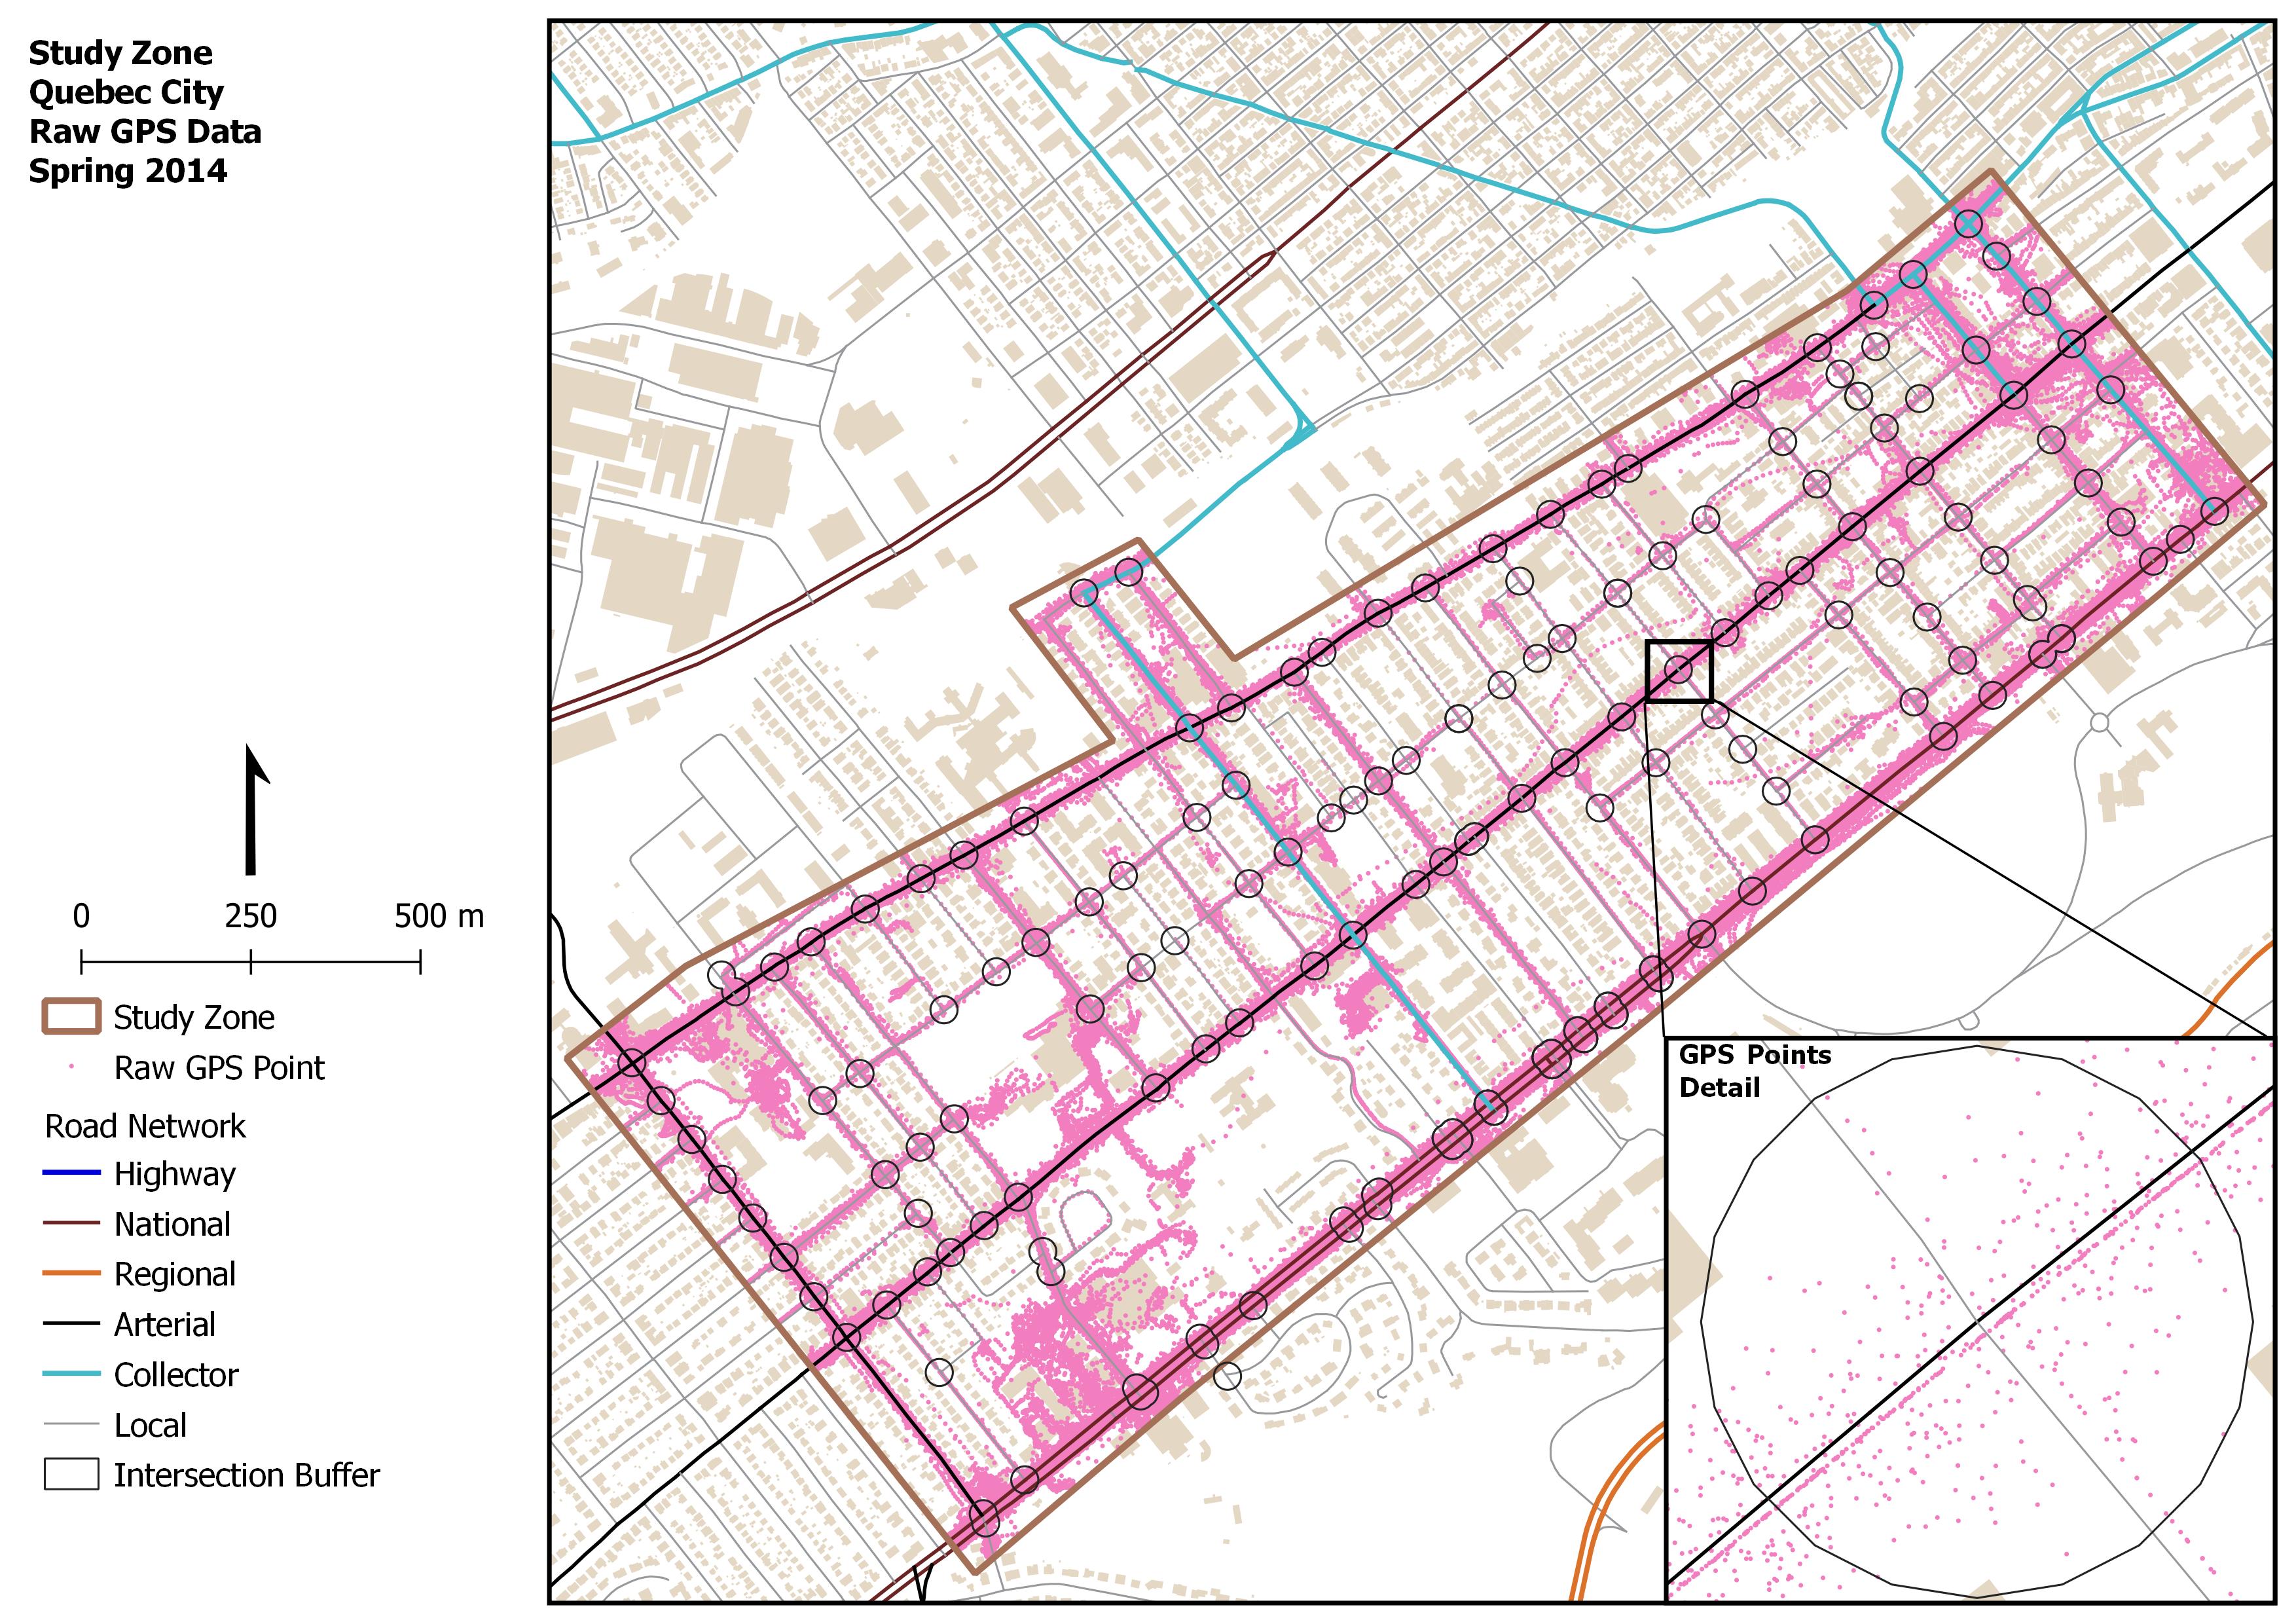
The primary data source consists of GPS trajectory points, collected during the spring of 2014 in Quebec City, Canada. Data was collected during 21 days by 2000 voluntary users through the Mon Trajet phone app, made available by the city. Each trajectory consists of consecutive GPS location points recorded by the app every second. Each point is described by the following attributes: X and Y coordinates, trip ID, instantaneous speed, and timestamp (Year-Month-Day-Hour-Minute-Second). Figure 1 is a map of the raw GPS points (226,000 points) inside the study zone, which consists of 127 intersections. The location and control type of all intersections were also obtained from the municipality for model calibration and validation. Four different control types were available: traffic light, all-way stop, east-west stop, north-south stop.

First, the intersection locations within the study area were determined using the road network and a 20-meter buffer was created around each intersection. The buffer size was determined by examining the road geometry and the spacing between intersections. In fact, the selected buffer size was able to capture all vehicles that are passing through any given intersection without having overlapping buffers. However, some buffers were merged for intersections that are very close to each other and operate as one intersection. The GPS data points were then filtered to only keep the points within the intersection buffers. The final sample size was 81,000 GPS points located within the 127 intersection buffers. At this point, all filtered points for a given trip within an intersection were converted into directional lines representing intersection movements. The intersection movements were then used to determine the inbound and outbound directions for each movement. For a given intersection, trip segment within an intersection buffer area (see Figure 2 (a) for the direction definition specific to the study area).
__movements_and_approaches_(b).jpg)
The calculated attributes, inbound direction, and outbound direction were then added to the GPS data points. The intersection control type attribute was also added to the GPS data points to act as the ground truth. For each trip segment within an intersection buffer, the delay (D), in seconds, was calculated using the following equation:
D=Tout−Tin
where is the time stamp of the first point to enter the buffer area and is the timestamp of the last point before exiting the buffer. Following data compilation, the result was a final database containing attributes at the approach level (northern, southern, eastern, or western approach) and at the intersection level. Figure 2 (b) illustrates the nomenclature for approaches and movements used in this paper. At the approach level, the following variables were calculated: average speed, standard deviation of speed, minimum speed, maximum speed, trip count, average number of points per trip within the buffer, and average delay. For example, trip count was calculated for each of the four approaches, to know the number of trips that are entering the intersection through each leg. At the intersection level, one speed related variable was calculated: the percentage of points with a speed of less than or equal to 5 km/hr. The developed explanatory variables were based on the expected difference in speed profiles and traffic intensity at intersections of different control types. For example, a traffic light-controlled intersection, is expected to serve higher intensity traffic conditions than an all stop intersection. Therefore, the trip count variable can be significant in differentiating between these two control types. Moreover, at an all-stop intersection, the approach speed is expected to be very low for all the vehicles, while at a traffic light-controlled intersection, some vehicles may not need to decelerate if their approach has a green light. This is expected to be reflected in the different speed variables. Other data disaggregation levels that are expected to show significant difference per intersection control type are specific times of day were traffic performance is impacted, such as peak periods, and specific turning movements, where distinct movement speed profiles may be an indication of a specific control type.
Data processing and manipulations were performed using the FME software, visualizations were produced in QGIS, and model specification and validation were performed in MATLAB. Different model specifications were tested to find the best model to predict intersection control type. Although only the best model specification results are discussed in this paper, the following models were tested at the intersection level:
- Speed and count attributes for all week
- Speed and count attributes for workday AM peak period
- Speed and count attributes per approach for all week
- Speed and count attributes per movement for all week
- Delay and count attributes per movement for all week
Two supervised machine learning classification techniques were tested: decision trees and nearest neighbours. The classifiers were trained using 80% of all intersections within the data set. The model was then applied to the remaining 20% of the intersections (validation dataset – 25 intersections) to predict the control type. The model prediction was compared with the ground truth to assess the accuracy and select the best model using the validation dataset.
3. Findings
It was found that the best predictors of intersection control type were average speed per approach, standard deviation of speed per approach, maximum speed per approach, trip count per approach, and the percentage of points having a speed lower than or equal to 5 km/h per intersection. Table 1 Presents the average values of the significant approach-level variables over all the study area intersections. These variables were able to distinguish between the speed and trip count characteristics specific to each control type. For example, the average speed approaching an intersection was a significant indicator in determining if an all stop control, stops at the secondary approach, or a traffic light was present as they have different average speeds. A higher average speed was observed for approaches that are controlled by traffic lights or that are uncontrolled. In addition, trip count was a good indicator of control type since traffic lights have higher observed trip counts than all stop-controlled intersections, because traffic lights are usually implemented at higher traffic intersection. Intersections with stops on the secondary approaches also have a significantly higher trip count on the main approaches compared to the secondary approaches, which classifies them in their own category. Since the variables were compiled per approach, it was possible to predict on which approaches were the stops located (E-W or N-S). Moreover, standard deviation of speed was found to be a good determinant of control type since it reflects the different classes of variability in speed for different control types. It is seen that stop controlled approaches have a lower standard deviation, because all vehicles are coming to a stop, while traffic light-controlled approaches have a higher standard deviation due to the higher variability in speeds caused by the traffic light colour. Finally, the maximum speed was found to be the highest for traffic light-controlled approaches, followed by uncontrolled approaches, and then stop-controlled approaches, which was significant in discriminating between intersection control types. The higher maximum speed of traffic light-controlled approaches compared to uncontrolled approaches, is that a green light ensures that the driver has the right of way and traffic lights are usually implemented on higher capacity roads that usually have higher posted speeds less traffic calming measures.
The best predictions were obtained using all weekdays data set using the nearest neighbours classifier. The model predicted the intersection control type with the accuracy of 96% for the validation dataset. Figure 3 presents a confusion matrix showing the prediction error for the validation intersections using the best model.

Developing the model based on the AM peak period of workdays reduced the total sample size considerably, resulting in a low prediction accuracy. In addition, introducing the detail of all intersection movements (inbound and outbound direction) in the model, also reduced the model’s prediction power.
For projects requiring a higher prediction accuracy, the model can potentially be improved by using a larger sample size to train it. A larger sample size enables the model to have a higher resolution and examine the data patterns in more detail. In addition, since traffic conditions have significantly different characteristics during different times of the day/week, developing a model based on homogeneous temporal characteristics might improve the prediction accuracy if a larger sample is available. Another potential avenue would be to test different model types. In sum, GPS data has a great potential to infer transport network variables for areas where such data is not easily available.