Loading [MathJax]/jax/output/SVG/jax.js
Skip to main content
null
Findings
  • Menu
  • Articles
    • Energy Findings
    • Resilience Findings
    • Safety Findings
    • Transport Findings
    • Urban Findings
    • All
  • For Authors
  • Editorial Board
  • About
  • Blog
  • covid-19
  • search

RSS Feed

Enter the URL below into your favorite RSS reader.

http://localhost:39917/feed
Transport Findings
August 16, 2022 AEST

Aversion to In-vehicle Crowding before, during and after the COVID-19 Pandemic

Stefan Flügel, Nina Hulleberg,
in-vehicle crowdingstated preferencepublic transportcovid-19
Copyright Logoccby-sa-4.0 • https://doi.org/10.32866/001c.37641
Photo by AQEEL AFZALI on Unsplash
Findings
Flügel, Stefan, and Nina Hulleberg. 2022. “Aversion to In-Vehicle Crowding before, during and after the COVID-19 Pandemic.” Findings, August. https:/​/​doi.org/​10.32866/​001c.37641.
Save article as...▾
Download all (3)
  • Figure 1. Illustration of crowding levels (here in the case of train and metro)
    Download
  • Figure 2. Example of a task in the choice experiment (translated from Norwegian)
    Download
  • Figure 3. Estimated crowding multipliers while sitting (upper panel) and standing (lower panel); comparison of selected pairs of data collections. 95% confidence intervals given in dashed lines.
    Download

Sorry, something went wrong. Please try again.

If this problem reoccurs, please contact Scholastica Support

Error message:

undefined

View more stats

Abstract

Based on four consecutive stated choice surveys, we estimate changes in public transport user’s valuation (marginal costs) of in-vehicle crowding due to the COVID-19 pandemic in two Norwegian cities. Compared to the pre-COVID level (November 2018), we find significantly higher costs during COVID (November 2021). Post-COVID costs (May 2022) are significantly reduced but remain above the pre-COVID level.

1. Questions

There is a hypothesis that preference for crowding in public transport vehicles (in-vehicle crowding) changed during the COVID-19 pandemic due to an increased risk of getting a viral infection and increased discomfort of sitting or standing close to other persons. For transport planning, a relevant question is if the valuation/marginal costs of crowding in the post-COVID period differs from the pre-COVID period. If costs persist at a higher level, this might indicate long-term changes in preferences that transport planners should account for when designing future public transport supply.

Our research question is therefore: To what degree has public transport user’s aversion to crowding – measured by crowding multipliers on the value of travel time saving (Wardman and Whelan 2011) – changed during and after the COVID-19 pandemic compared to pre-COVID level?

Our empirical evidence are from two Norwegian cities, and adds to a growing literature on COVID-related crowding costs (Cho and Park 2021; Aghabayk, Esmailpour, and Shiwakoti 2021; Basnak, Giesen, and Muñoz 2022; Shelat, Cats, and van Cranenburgh 2022). To our knowledge, this is the first paper that presents comparable results from all three periods, i.e. before, during and after the pandemic.

2. Methods

We estimate crowding multipliers on the value of travel time savings based on binary stated choice data, using mixed logit models. Available information that enters our statistical model is dummy variables for the round of data collection Da with a={1,2,3,4}, travel time Ti in minutes for alternative i={1,2}, and dummy variables indicating the crowding situation Ci,s,k where s={sitting,standing} indicates if one sits or stands over the whole trip and k={1,…,10 for s=sitting 5,…,10 for s=standing} indicates the crowding level as illustrated Figure 1.

Figure 1
Figure 1.Illustration of crowding levels (here in the case of train and metro)

Figure 2 shows an example of a choice task. The three attributes travel time, sitting place and crowding level were established based on reported reference values and combined by means of an orthogonal design (Flügel et al. 2020). A variant of the choice experiment, assigned to 50% of the sample, omitted the verbal description of sitting place and instead showed seat position in the illustration of the crowding level.

Figure 2
Figure 2.Example of a task in the choice experiment (translated from Norwegian)

In our model, the utility function of alternative i for respondent n in choice task t is given as

Un,t,i,a=μa∗(αi+∑a∑s∑k(βa,s,k∗Da∗Cn,t,i,s,k∗Tn,t,i,a,s,k))+εn,t

with

  • εn,t being i.i.d. Gumbel distributed error terms

  • μa being scale parameters for the different data collections a. For normalization, we apply μ1≡1

  • αi being constant terms. For normalization, we apply α1≡0

  • βa,s,k being parameters capturing the marginal utility of travel time in different crowding situations. The marginal utility of travel in uncrowded situations, i.e. βa,sitting,1, is assumed normally distributed over respondents n to account for unobserved taste heterogeneity. For normalization, we set the mean values of βa, sitting,1 to minus 1.

With the applied normalization, the absolute values of βa,s,k represent the crowding multipliers in different situations (defined by s and k) given the round of data collection a.

Our data collection was done in four rounds (R1 – R4) using different recruitment techniques. Recruitment was concentrated in the area of the Norwegian capital Oslo (the largest urban area in Norway) and Trondheim (the fourth largest urban area in Norway). Table 1 gives an overview over the samples. Note that all respondents in round 4 also participated in round 2 and/or round 3 (mainly round 3).

Table 1.Comparison of samples
Comparison of samples R1 R2 R3 R4
Period Nov. 2018 April 2021 Nov. 2021 May 2022
Main recruitment Intercept method on board and at stations using tablets, with the option to answer later on own device Commercial E-mail register from a postal service, invitations by email Mobile register from commercial provider, SMS invitations Recruited from respondents that left their contact info (mobile number or email address) in R3 (and R2).
Nr. of completed questionnaires 680 475 9701 2912
Female share 54.4% 55.2% 51.0% 51.7%
Age distribution
(under 30, 30-60, over 60 years)
35.6%, 54.6%, 9.4% 21.1%, 66.5%, 12.4% 6.8%, 54.1%, 39.1% 2.6%, 49.7%, 47.7%
Mode shares
(train, metro, tram, bus)
22.8%, 25.0%,
19.6%, 32.6%
21.9%, 25.5%,
10.7%, 41.9%
23.8%, 29.0%,
9.6%, 37.5%
22.3%, 29.1%,
10.2%, 38.4%
Share using mask in PT N.A. 96.6% 33.9% 19.1%
Share agreeing that they are worried about infection in PT N.A. 33.7% 33.6% 17.2%
Share being vaccinated N.A. 25.5% 98.3% 98.6%
Context of the COVID pandemic in Norway Pre-COVID Mild lock-down in Oslo; several national measures; initial vaccination campaign No lockdown but some local measures reintroduced after increases in infection and rumors of omicron variant Post-COVID: all measures were removed already in February 2022

3. Findings

The last four lines of Table 1 paint a picture of the COVID situation in Norway at the different points in time. Based on this context, we expected crowding multipliers to be greater during the pandemic (April 2021 and November 2021) compared to 2018 values, and 2022 values to be close to 2018 values.

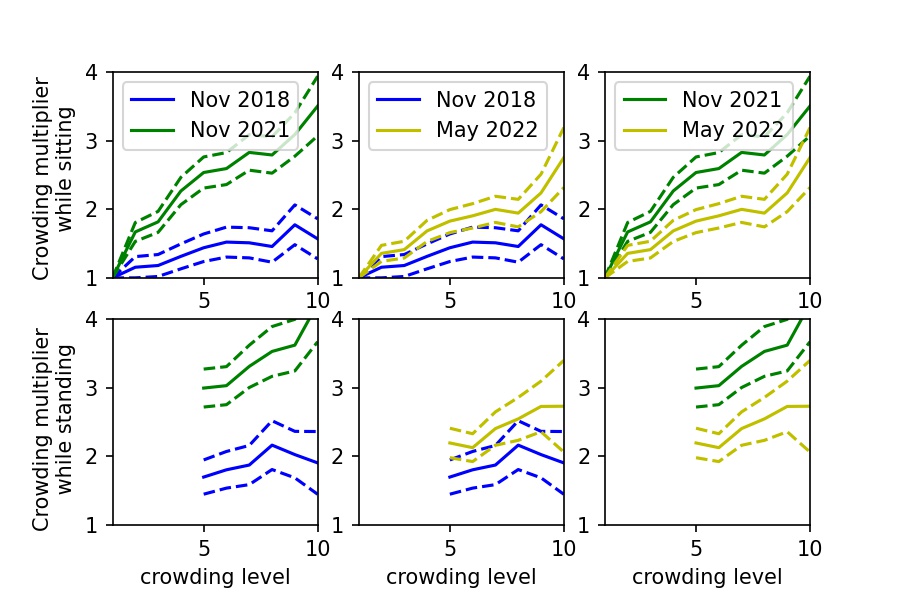
This was largely confirmed as shown in Figure 3.[1] Looking at the two left-most panels we see that estimated crowding multipliers were significantly higher during the pandemic (November 2021) compared to pre-COVID (November 2018). Our assessment about significance is based on the robust standard errors (and T-values) of the estimated beta-parameters. They are shown in the form of 95% confidence intervals in the Figure 3. The figure also shows that the post-COVID (May 2022) values are significantly lower compared to November 2021. The post-COVID values remain somewhat above the pre-COVID levels, however, here the confidence intervals are largely overlapping.

Figure 3
Figure 3.Estimated crowding multipliers while sitting (upper panel) and standing (lower panel); comparison of selected pairs of data collections. 95% confidence intervals given in dashed lines.

The absolute values of the pre-COVID crowding multipliers seem to compare well against other studies (Wardman and Whelan 2011; Kroes et al. 2014; Hörcher, Graham, and Anderson 2017; Tirachini et al. 2017). While our COVID-related values are rather high, some high values (of up to 5.1) are also found in Basnak, Giesen, and Muñoz (2022).

For context, Table 2 gives the share of respondents agreeing to the statement that they may feel discomfort when standing close to other persons.

Table 2.Share of respondents agreeing that they may feel discomfort standing close to other persons
Subsample Round 1 Round 2 Round 3 Round 4
November 2018 "before COVID" "today" (April 2021) "before COVID" "today" (Nov. 2021) "before COVID" "today" (May 2022)
All 57.8 % 61.3 % 91.2 % 58.3% 87.4 % 56.5% 71.7 %
Male 49.4 % 55.5 % 85.6 % 54.3 % 82.3 % 51.8 % 65.6 %
Female 64.9 % 65.6 % 95.4 % 62.0 % 92.2 % 60.2 % 77.0 %
Under 30
years
56.2 % 70.0 % 93.0 % 63.5 % 85.0 % 56.6 % 69.7 %
30-60
years
60.2 % 59.2 % 91.1 % 58.2 % 87.1 % 59.4 % 72.8 %
Over 60
years
50.0 % 57.6 % 88.1 % 57.6 % 88.2 % 53.4 % 70.8 %

We see that the shares increased substantially from round 1 (pre-COVID) to round 2 (April 2021), but has since been on a decline. Still, the 71.7% in round 4 (post-COVID) is substantially above the pre-COVID share, both compared to the 2018-sample and compared to retrospective questions within the 2022-sample (“before COVID”). This indicates that there might be long-term shifts in preferences.

Some caveats should be taken regarding the different samples, e.g. in respect to the age distributions. However, note that the shares in Table 2 for the 2018 sample are rather consistent with the “before COVID” shares from the later samples. This is encouraging with respect to concerns regarding representativity and comparability of the samples. It also seems like the perception of discomfort is less related to age compared to gender.


Acknowledgement

The writing of this paper and data collection 3 and 4 were financed by the Norwegian Research Council trough the CAPSLOCK project (326814). The first data collection was financed by the transport authorities in Norway through the Norwegian Valuation Study 2018-2019. The second data collected was financed by the Norwegian Railway Directorate and supported by the Norwegian Research Council trough the CODAPT project (315679). We want to thank Askill H. Halse and two anonymous reviewers for valuable comments to the manuscript.


  1. Note that the April 2021 results are somewhat indecisive (likely due to the low number of observations) and therefore not shown here.

Submitted: July 23, 2022 AEST

Accepted: August 12, 2022 AEST

References

Aghabayk, Kayvan, Javad Esmailpour, and Nirajan Shiwakoti. 2021. “Effects of COVID-19 on Rail Passengers’ Crowding Perceptions.” Transportation Research Part A: Policy and Practice 154:186–202. https:/​/​doi.org/​10.1016/​j.tra.2021.10.011.
Google ScholarPubMed CentralPubMed
Basnak, Paul, Ricardo Giesen, and Juan Carlos Muñoz. 2022. “Estimation of Crowding Factors for Public Transport during the COVID-19 Pandemic in Santiago, Chile.” Transportation Research Part A: Policy and Practice 159:140–56. https:/​/​doi.org/​10.1016/​j.tra.2022.03.011.
Google ScholarPubMed CentralPubMed
Cho, Shin-Hyung, and Ho-Chul Park. 2021. “Exploring the Behaviour Change of Crowding Impedance on Public Transit Due to COVID-19 Pandemic: Before and After Comparison.” Transportation Letters 13 (5–6): 367–74. https:/​/​doi.org/​10.1080/​19427867.2021.1897937.
Google Scholar
Flügel, Stefan, Askill H. Halse, Nina Hulleberg, Guri N. Jordbakke, Knut Veisten, Hanne Beate Sundfør, and Marco Kouwenhoven. 2020. “Verdsetting av reisetid og tidsavhengige faktorer. Dokumentasjonsrapport til Verdsettingsstudien 2018-2019.”
Hörcher, Daniel, Daniel J. Graham, and Richard J. Anderson. 2017. “Crowding Cost Estimation with Large Scale Smart Card and Vehicle Location Data.” Transportation Research Part B: Methodological 95:105–25. https:/​/​doi.org/​10.1016/​j.trb.2016.10.015.
Google Scholar
Kroes, Eric, Marco Kouwenhoven, Laurence Debrincat, and Nicolas Pauget. 2014. “Value of Crowding on Public Transport in île-de-France, France.” Transportation Research Record 2417 (1): 37–45. https:/​/​doi.org/​10.3141/​2417-05.
Google Scholar
Shelat, Sanmay, Oded Cats, and Sander van Cranenburgh. 2022. “Traveller Behaviour in Public Transport in the Early Stages of the COVID-19 Pandemic in the Netherlands.” Transportation Research Part A: Policy and Practice 159:357–71. https:/​/​doi.org/​10.1016/​j.tra.2022.03.027.
Google ScholarPubMed CentralPubMed
Tirachini, Alejandro, Ricardo Hurtubia, Thijs Dekker, and Ricardo A. Daziano. 2017. “Estimation of Crowding Discomfort in Public Transport: Results from Santiago de Chile.” Transportation Research Part A: Policy and Practice 103 (Supplement C): 311–26. https:/​/​doi.org/​10.1016/​j.tra.2017.06.008.
Google Scholar
Wardman, Mark, and Gerard Whelan. 2011. “Twenty Years of Rail Crowding Valuation Studies: Evidence and Lessons from British Experience.” Transport Reviews 31 (3): 379–98. https:/​/​doi.org/​10.1080/​01441647.2010.519127.
Google Scholar

This website uses cookies

We use cookies to enhance your experience and support COUNTER Metrics for transparent reporting of readership statistics. Cookie data is not sold to third parties or used for marketing purposes.

Powered by Scholastica, the modern academic journal management system