

1. Questions
During the COVID-19 pandemic, delivery quickly became one of the most important resources to consumers. Many storefronts closed, or people did not want to go to stores due to health and safety concerns (Hu et al. 2021). However, underserved populations were less likely to access delivery services during the pandemic (Figliozzi and Unnikrishnan 2021). Access to essential services is often a measure of community resilience, which is the ability of a community to have equitable access to services and to be able to rapidly reestablish access after a disruption (Langridge, Christian-Smith, and Lohse 2006; Logan and Guikema 2020). We investigate community resiliency during the COVID-19 pandemic by considering common indicators of access to delivery services: availability, accessibility, accommodation, and acceptability (Penchansky and Thomas 1981).
2. Methods
The data were collected via a stated preference survey distributed using Qualtrics XM. The survey asked about consumer preferences and the use of delivery services in the New River Valley (NRV), Virginia (Kaplan 2021). The survey was distributed from October 2020 to September 2021. Participants were recruited through paid Facebook advertisements, Facebook groups, and Virginia Tech listservs. The survey comprised 12 socio-demographic questions and 26 delivery service questions, and all survey participants were kept anonymous. Respondents reported that they were at least 18 years of age and located in the NRV (Montgomery, Pulaski, Floyd, and Giles Counties and the city of Radford).
Five hundred seven individuals responded to the survey, and 423 responses were utilized after the data were cleaned. Table 1 shows the socio-demographic data for the sample. 6.3% of survey respondents did not have a vehicle compared to the 9% of the US population does not have a vehicle (“Percentage of Households by Number of Vehicles, 1960-2017” 2017). Montgomery and Pulaski Counties make up most of the NRV population, 54%, and 19%, respectively (“NRV Map-Population 1960-2015” 2015). 57% of respondents were from Montgomery County, and 20% were from Pulaski County in our sample.
Since access enables community resilience, we needed to first identify where the vulnerabilities to delivery access lie to determine how to improve delivery service resilience. Therefore, comparative analyses regarding socio-demographic factors, including vehicle access, location of residence, and delivery use, were used to find differences in delivery service access. These factors were chosen because the COVID-19 pandemic created a unique situation where vehicle access largely determined an individual’s need for home deliveries through their ability to access stores and avoid potential safety hazards on public transit. Location of residence was important during the pandemic because it determined access to home delivery services. Respondent’s level of satisfaction with delivery services available to them was also evaluated because it is a likely indicator of delivery access. We focused our analysis on socio-demographic differences across questions that asked how frequently respondents used third-party restaurant apps (e.g., UberEats), grocery, and package delivery before versus during the pandemic. Wilcoxon signed-rank tests were used to test that the differences were statistically significant.
3. Findings
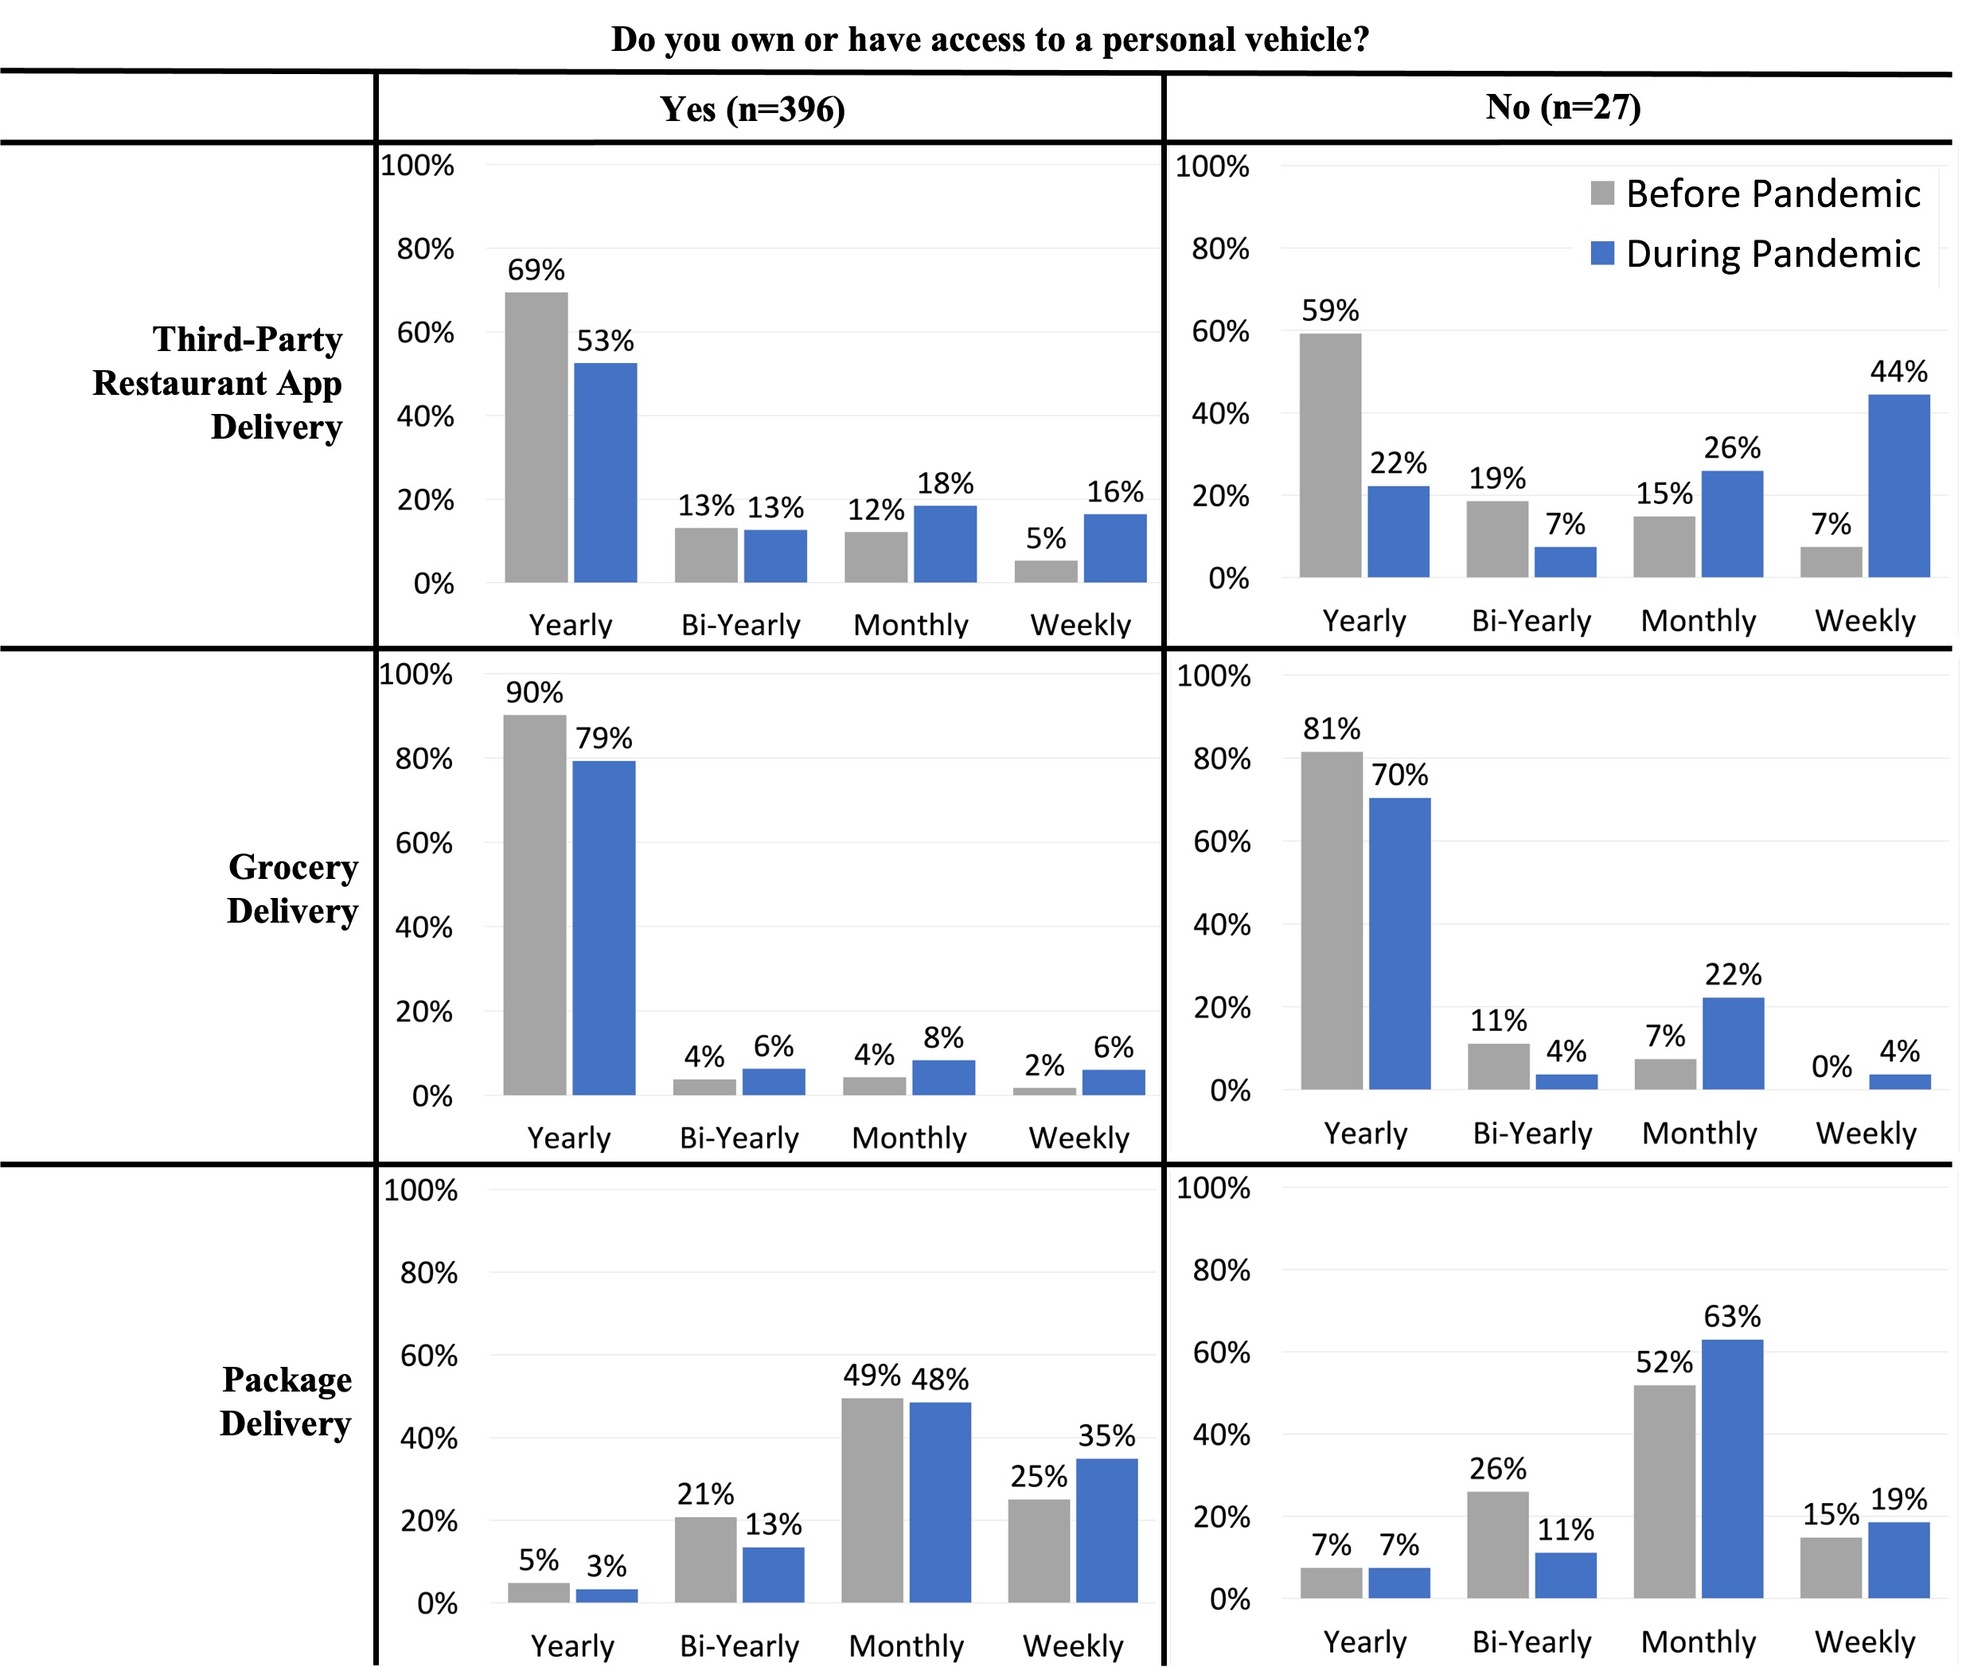
Figure 1 shows differences in third-party restaurant apps, grocery, and package delivery use before versus during the pandemic between respondents who did or did not have a personal vehicle. Respondents who did and did not have a personal vehicle used third-party restaurant app delivery significantly more frequently (p = 0.0000 and 0.0003, respectively) during the pandemic. 16% of respondents who had a vehicle used third-party restaurant app delivery “weekly” during the pandemic, compared to 44% of respondents who did not have a vehicle. There was a significant difference in grocery (p = 0.0000) and package (p = 0.0000) delivery use from before to during the pandemic for respondents with personal vehicles. Overall, respondents without vehicle access likely used third-party restaurant app delivery services more frequently because traveling to stores and restaurants was less accessible compared to respondents with vehicles. Without vehicle access, people are reliant on public transportation or active transportation to get food and other essential items. In rural areas, public transit is extremely limited and active transportation modes may not be adequate to get to the location of the goods or the transport of those goods back to where they are needed.
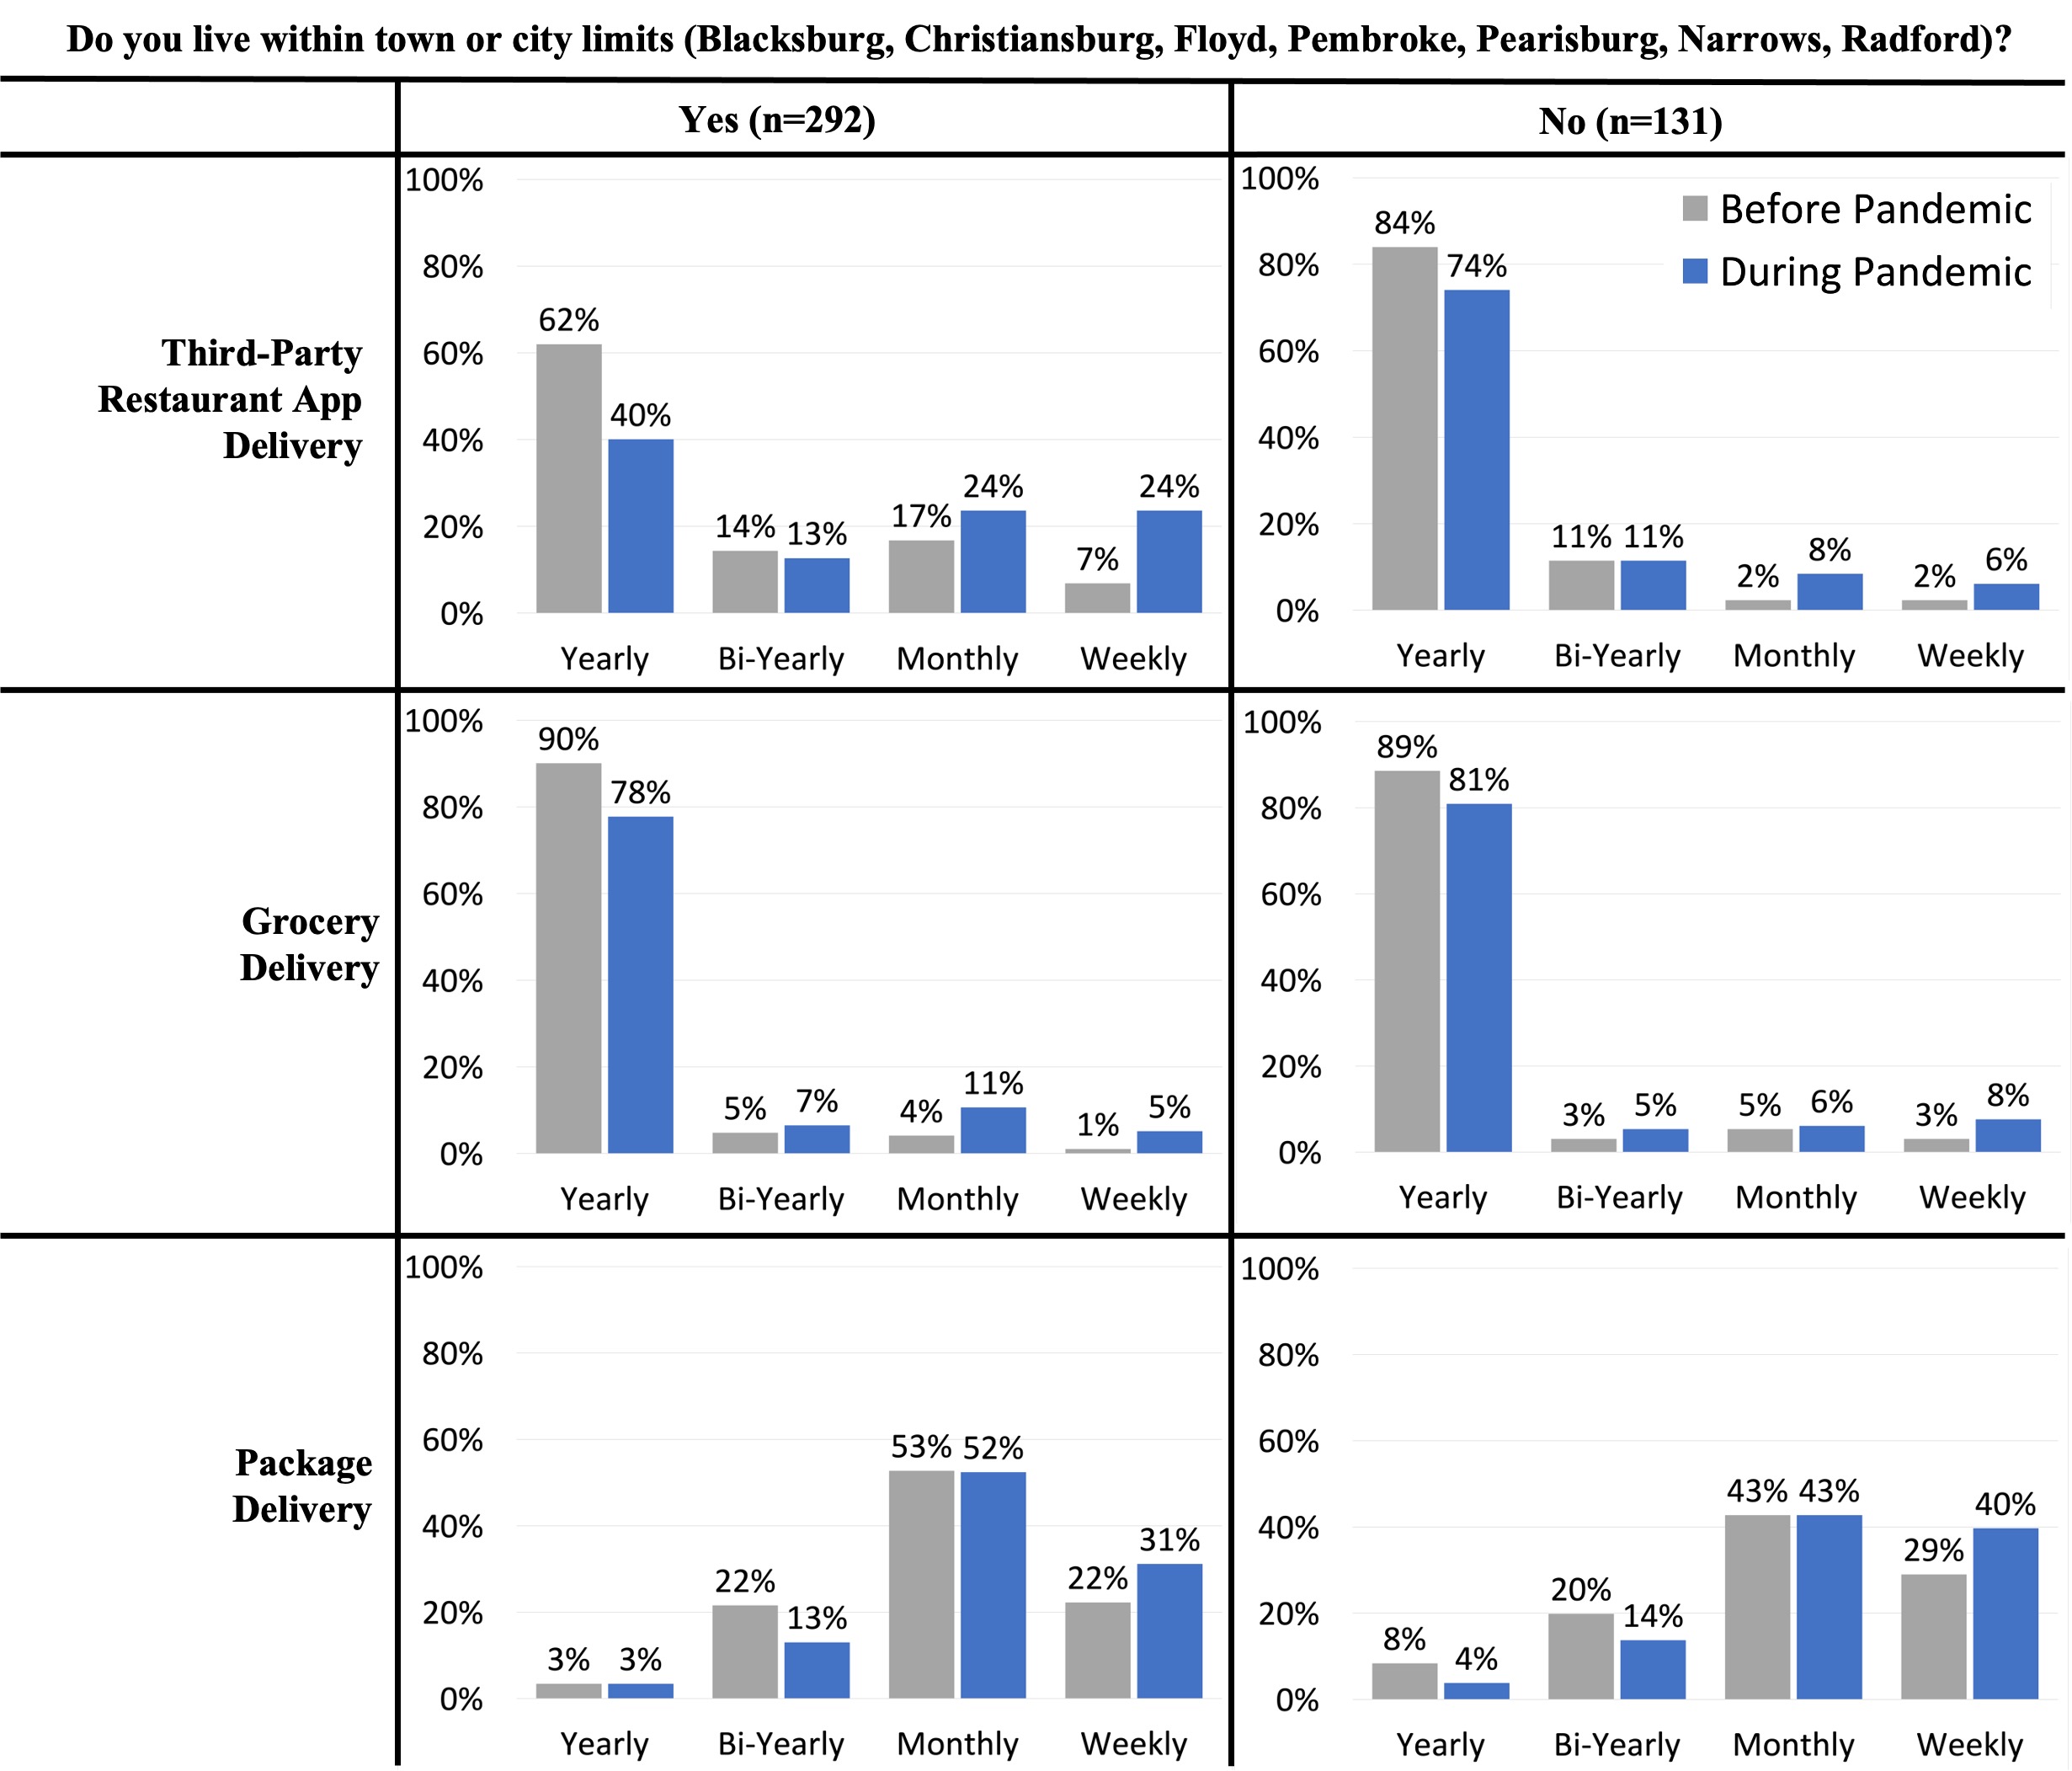
Significant differences (p < 0.05) were found for third-party restaurant apps, grocery, and package delivery use before versus during the pandemic between respondents who lived within versus outside town limits (Figure 2). During the pandemic, 24% of respondents within town limits (more urbanized) used third-party restaurant app delivery on a “weekly” basis, compared to only 6% outside town limits (more rural areas). This likely occurred because of better access to food delivery services in town. Grocery delivery results were relatively similar in town and rural settings, likely because this is a newer service in the area. 40% of respondents outside town limits used package delivery “weekly” during the pandemic, compared to 31% of respondents within the town. The results indicate that location of residence impacted delivery use because respondents in rural areas likely had less access to third-party restaurant delivery apps and a greater need for package delivery due to reduced accessibility to stores. The people who lived in rural areas were more vulnerable to delivery service disruptions because they already had decreased access to essential goods, which also reduces community resilience.

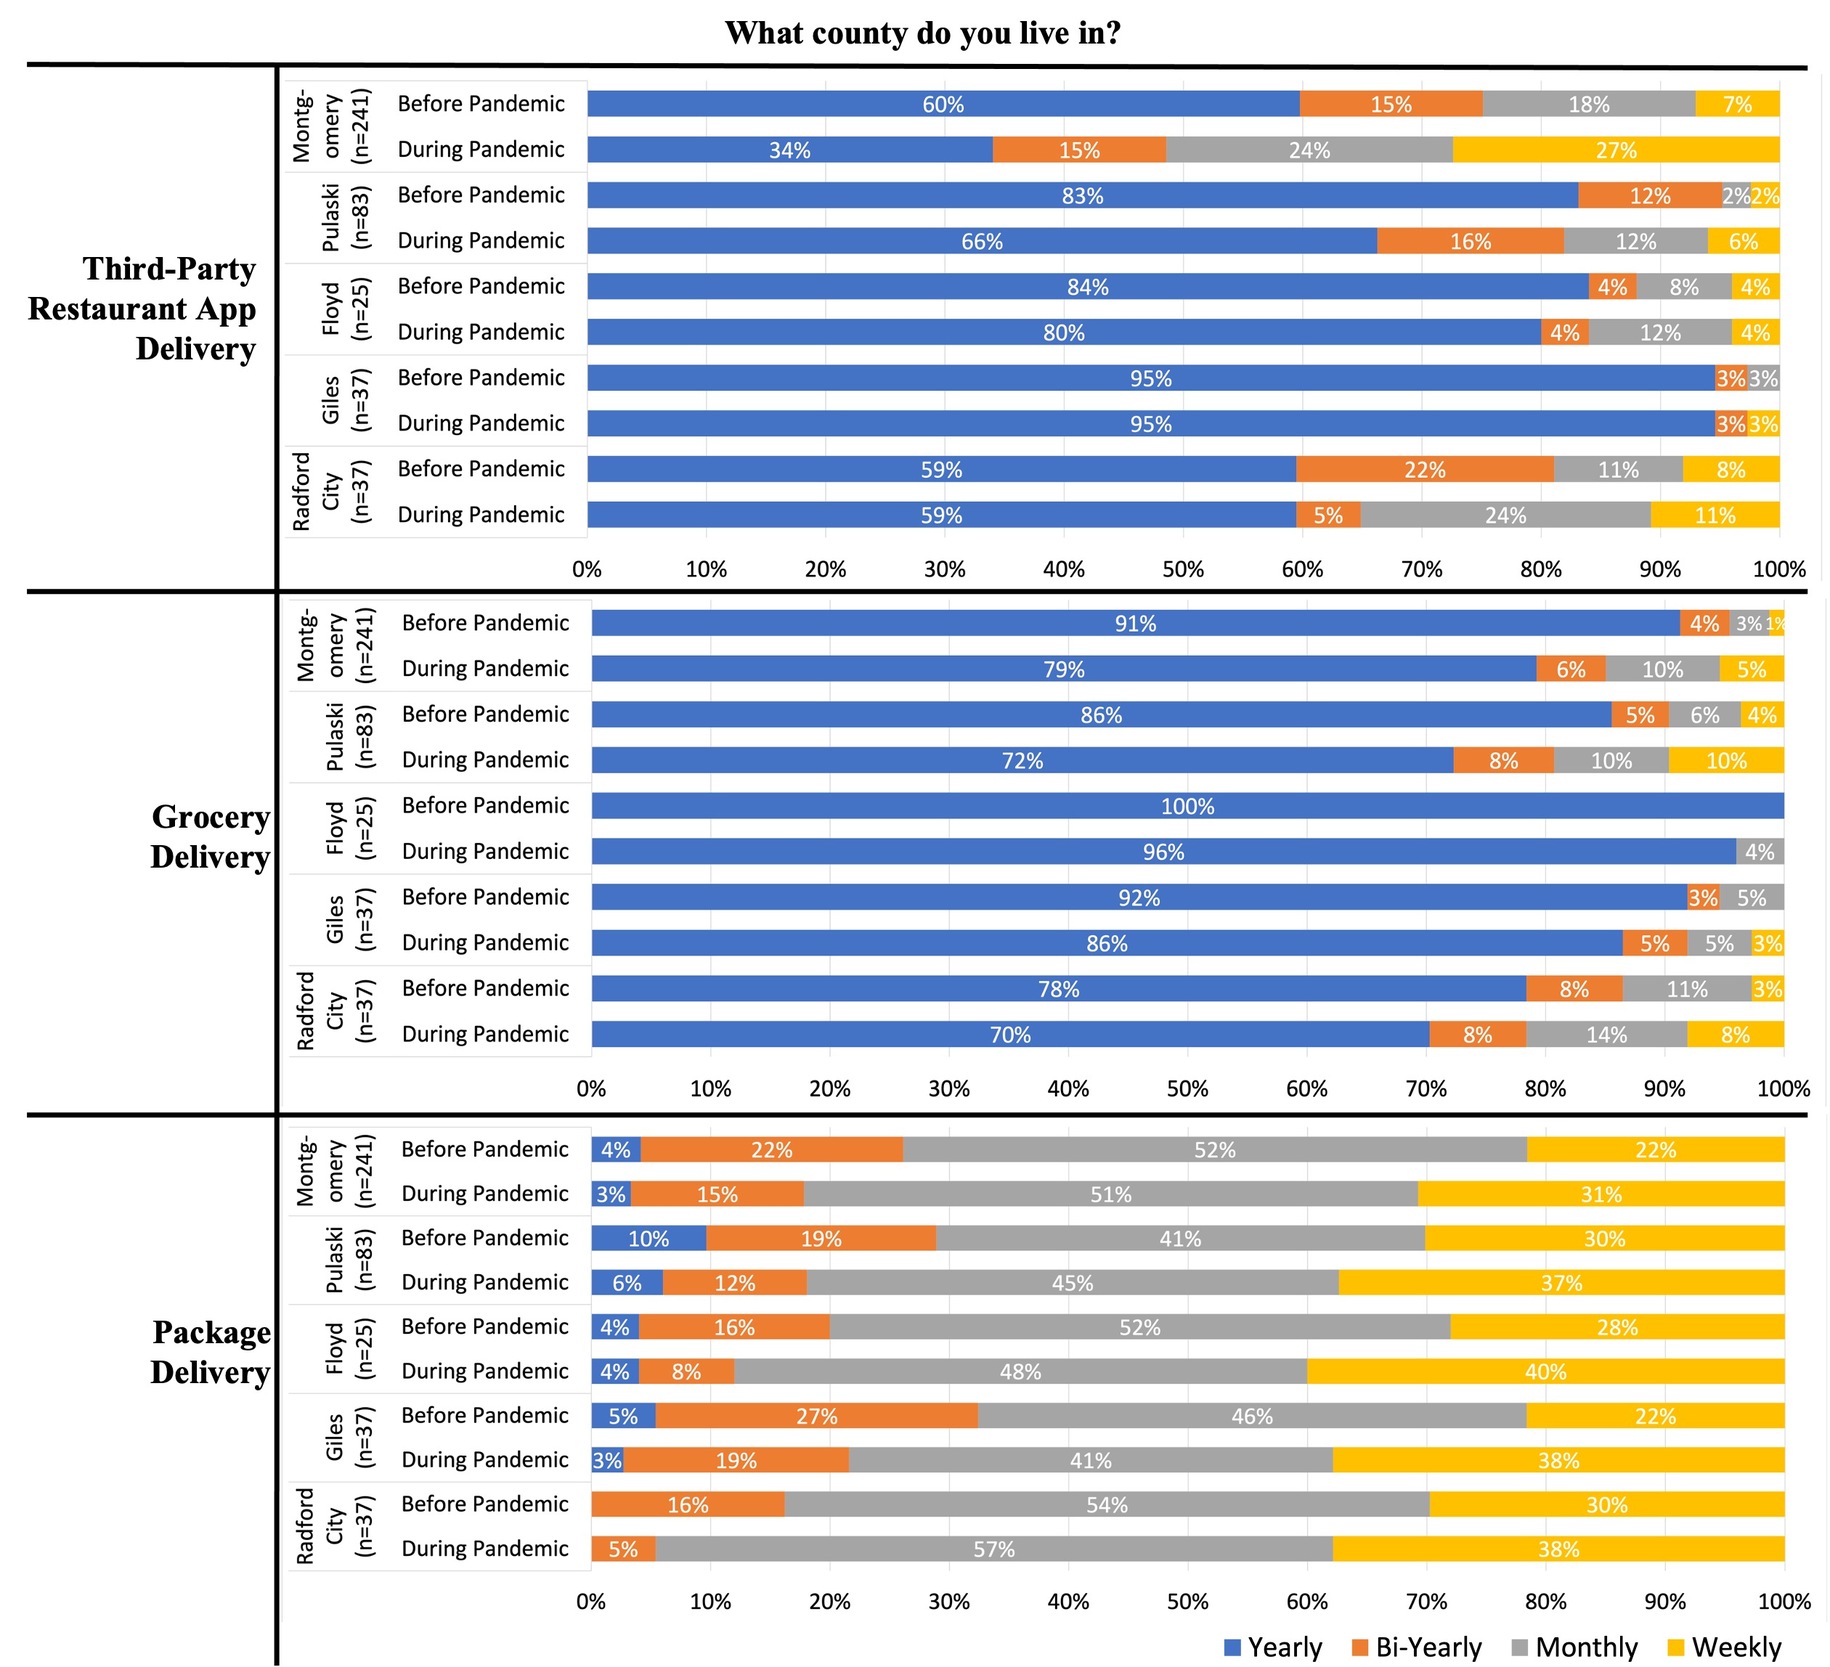
We also observed significant differences in delivery use before versus after the pandemic at the county level (Figure 3). Montgomery and Pulaski Counties used third-party restaurant app delivery significantly more during the pandemic than before (p = 0.0000 and 0.0002, respectively). Similar results were found for grocery delivery in Montgomery County, Pulaski County, and Radford City (p = 0.0000, 0.0029, and 0.0401, respectively). For package delivery, however, while a significant difference in use was found from before to during the pandemic for all counties, distributions between the counties were similar. This is likely because package delivery, compared to third-party restaurant app or grocery delivery, is more widely accessible in rural areas, even though it is not as efficient. People had better access to package delivery and therefore, the communities were more resilient to disruptions such as the COVID-19 pandemic.
Access to delivery services became essential during the COVID-19 pandemic. Essential resources such as vehicle access, location of residence, and presence of established delivery services influenced community resilience for delivery. To improve community resilience for currently underserved areas, vulnerabilities that influence the inequity of access to delivery services should be addressed. Imbalances in populations with access to essential delivery services can be removed by increasing investment in delivery resources in rural areas.
Acknowledgments
This research did not receive any specific grant from funding agencies in the public, commercial, or not-for-profit sectors.
Declarations of Interest
None.