
1. Questions
It is crucial to capture the impacts of congestion effects in public transport when assessing the vulnerability of public transport networks in order to identify the weakest links. Past studies have either accounted for congestion using static (Shimamoto et al. 2008) or dynamic (Cats and Jenelius 2014) assignment models but at the cost of running times prohibiting a full-scan. Alternatively, they did perform a full-scan by relying on a strictly topological analysis (von Ferber et al. 2012; Wang, Wang, and Shen 2020; Krishnakumari and Cats 2020; Zhang et al. 2020), used an all-or-nothing assignment (Rodríguez-Núñez and García-Palomares 2014; Pant, Hall, and Blainey 2016; Cats 2016) or a probabilistic route choice (Cats, Koppenol, and Warnier 2017) without congestion and capacity considerations which are particularly relevant when links fail.
We propose a user-equilibrium congested assignment model inspired by network science indicators which allows for a full-scan analysis of network vulnerability, yet accounts for service properties and related behavioural aspects. Using this model we can address the questions: which is the weakest link in our network? what is the spatial extent of disruption propagation?
2. Methods
The physical infrastructure of the public transport network is represented by a directed graph i.e. Infrastructure graph, where the set represents stops, and the set corresponds to segments connecting a successive pair of stops. Each is labelled using the impedance associated with traversing the respective link. The service layer is represented by a directed graph i.e. Service graph. While the set of nodes is the same as in the set of links represents a direct service connecting two stops. Each link is labelled with the waiting time based on the joint headway of the relevant connections. The Infrastructure and Service graphs are inspired by what has been denoted as L- and P-spaces in the network science literature (e.g. Derrible and Kennedy 2011).
For the choice-set generation, a constrained enumeration approach is adopted following a breadth-first search algorithm (Prato and Bekhor 2006). Logical and behavioural rules are employed for pruning the search tree. Each path is associated with a sequence of stops and links in the Infrastructure- and Service- graphs.
The flow distribution rule is equivalent to the formulation of a probabilistic path choice model. The systematic utility of a path is given by the weighted sum of on-board time (using the labelled Infrastructure graph), waiting time (labelled Service graph) and number of transfers (unlabelled Service graph).
The congested assignment assumes system equilibrium and is attained through an iterative network loading which updates the in-vehicle time multiplier and failure-to-board probabilities. The method of successive averages is used.
We measure the magnitude of the spill-over effect in terms of the relative change and account for the spatial extent by examining the topological distance between these other links and the disrupted link as follows:
\[y_{i} = \sum_{e \in E,\ e \neq i}^{\mathstrut}\frac{\left| \bigtriangleup q_{e}(i) \right| \times d_{e,i}}{\sum_{\mathstrut}^{\mathstrut}\left| \bigtriangleup q_{e}(i) \right|}\tag{1}\]
where is the topological distance between link and link measured as the number of links along the shortest path between these two links. is the relative change in link load due to a link failure defined as:
\[\bigtriangleup q_{j}(i) = \frac{q_{j}(i) - q_{j}(0)}{q_{j}(0)} \times 100 \tag{2}\]
The load on link in the base scenario with no disruptions is and is the corresponding load when link is disrupted.
3. Findings
We use GTFS data of the urban rail network in Amsterdam to generate the Infrastructure and Service graphs consisting of 278 and 7834 unidirectional links, respectively. The origin-destination matrix used for the case study network comprises of approximately 200 thousand trips in the morning peak period. The assignment model is implemented in MATLAB and run on a laptop PC (16GB, Intel i7-6600 @ 2.60GHz). The choice-set generation and congested assignment took about 105 and 55 seconds, respectively, per disruption scenario. The full scan involves disrupting each of the 780 unidirectional links from different services.
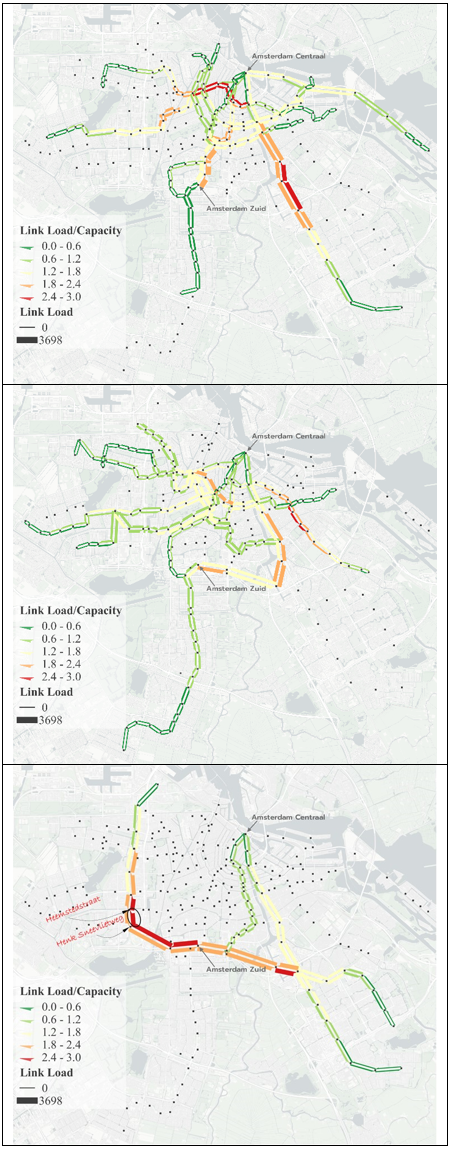
The median choice set size is 5. Figure 1 shows the results for the line-specific congested assignment at equilibrium when there are no disruptions in the network. Although the metro lines have a larger capacity than the tram lines, they are also relatively more crowded. Furthermore, tram lines in and just outside the city centre generally appear to be more congested.

The total travel costs criticality values range within [-0.08%, 2.69%] with a mean value of 0.30% (Figure 2). In absolute terms, link disruption effects vary greatly from network wide savings of 1,922 minutes to a maximum increase of 61,963 minutes. The latter occurs when the most critical link is disrupted, i.e. metro line 50 between the stops Genk Sneevlietweg and Heemstedstraat. On average, a link closure leads to a total loss of 6,942 passenger-minutes equivalent. Link criticality in terms of passenger time losses is only modestly correlated with link load =0.3195) and betweenness centrality =0.2857). We observe that links with similar no-disruption loads and no-disruption betweenness centrality can be associated with largely different criticality values (up to 250% difference). In the case of the Amsterdam, metro service links are more critical due to the higher density of the tram network which allows for short detours in case of disruptions while the metro lines play a more indispensable role.

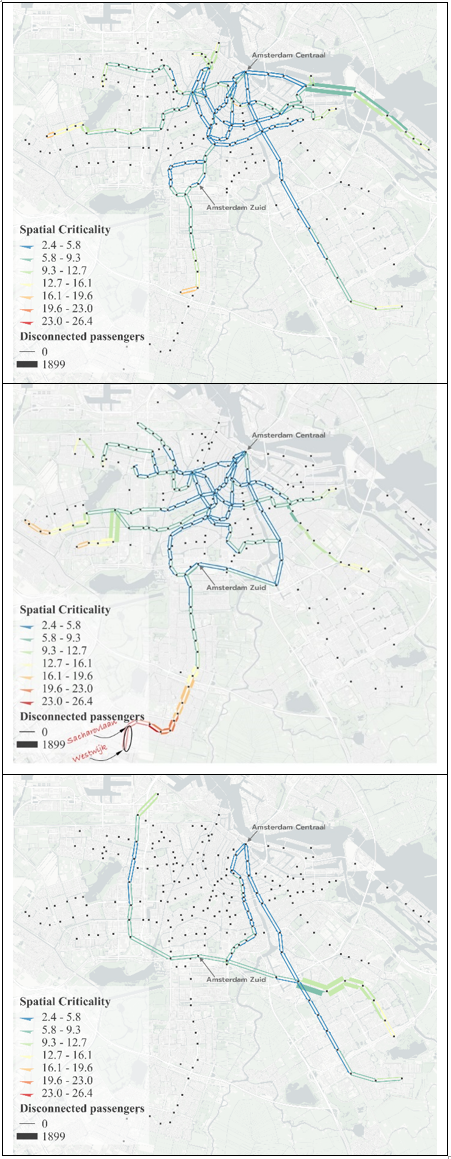
Next, we examine the spatial variation in link criticality. The spatial criticality value varies between 2.39 and 26.44 with an average of 7.19 (Figure 3). This means that, on average, effects of a link disruption propagate up to ~7 links from the malfunctioned link. The spatial criticality of links in the dense section of the network is the lowest and spatial criticality is the highest for links on the outskirts of the network. The links at the beginning of line branches disconnect most passengers since alternatives are not available. Indeed, the highest value is recorded for metro line 51 between Westwijk and Scharovlaan. Interestingly, spatial criticality does not correlate well with betweenness centrality =0.045) and the undisrupted link load =0.1105). It is therefore difficult to predict the spillover effects of disruptions on the basis of static topological indicators or undisrupted assignment results. A network vulnerability analysis is thus needed to adequately assess link spatial criticality.
_as_well_as_the_number_of_disconnected_pass.png)
Acknowledgements
A related work has been presented at the 5th IEEE International Conference on Models and Technologies for Intelligent Transportation Systems (MT-ITS2017).