1. Questions
The resilience of transport systems is defined as their ability to provide effective services in normal conditions and to resist, absorb, accommodate and recover from disruptions (Gu et al. 2020). Recent social shocks have drawn scholars’ attention to transport resilience and led operators and governments to identify individual responsibilities and collective considerations from the user perspective in the form of “responsible transport” policies (Budd and Ison 2020); that is, the focus is shifting from supply-side resilience strategies to demand-side strategies. In current debates on resilience, the demand side has been neglected, as analysis is invariably conducted from the operators’ perspective using topological or system-based indicators. To redress this imbalance, we adopt the travelers’ perspective and ask the following question: how can travelers proactively build resilience by using alternative routes in response to adverse events? A case study is conducted using the Beijing subway network (see Table 1 for relevant information about Beijing and its subway system).
The resilience of a system can be proactively built by its stakeholders if they anticipate adverse events and “actively wait” for them (Sull 2005). We begin by examining how the concept of route diversity, which is a measure of the spatial variability in the number of alternative routes between origin–destination (OD) pairs in transport networks (Chan et al. 2021; Xu et al. 2018; Yang et al. 2017), is treated in the transport literature. This measure, which is one of two network-based measures for characterizing transport network redundancy, has been used to assess the redundancy and vulnerability of various metro networks (Chan et al. 2021; Yang et al. 2017), road networks (Xu et al. 2018), and freight networks (Jansuwan, Chen, and Xu 2021). We suggest that the concept of route diversity is relevant to the proactive resilience of transport systems. Route diversity is here understood as (a) the network’s capability to accommodate route choice behavioral change and (b) the ability of potential travelers to switch routes to eliminate unknown negative scenarios (e.g., severe congestion with long queue) through, ideally, fundamental changes in route choice principles (e.g., the shortest time versus the least number of transfers). A transport system could be considered more resilient if its users behave differently (i.e., if they use different routes for the same OD pairs in normal conditions) and are willing to adapt (i.e., if they use alternative routes for the same OD pairs under disruptions). Assessing route diversity could therefore improve awareness of the proactive actions that travelers themselves can take.
2. Methods
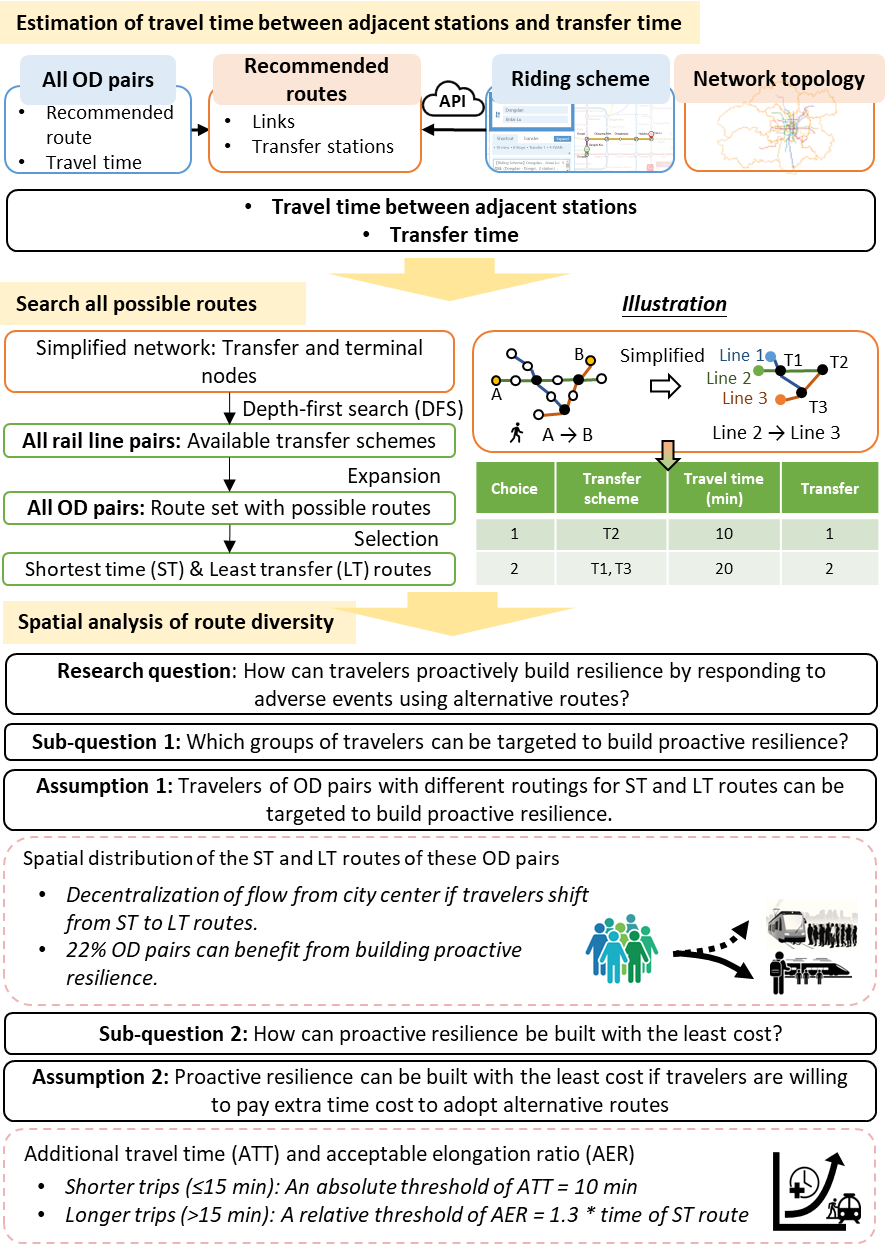
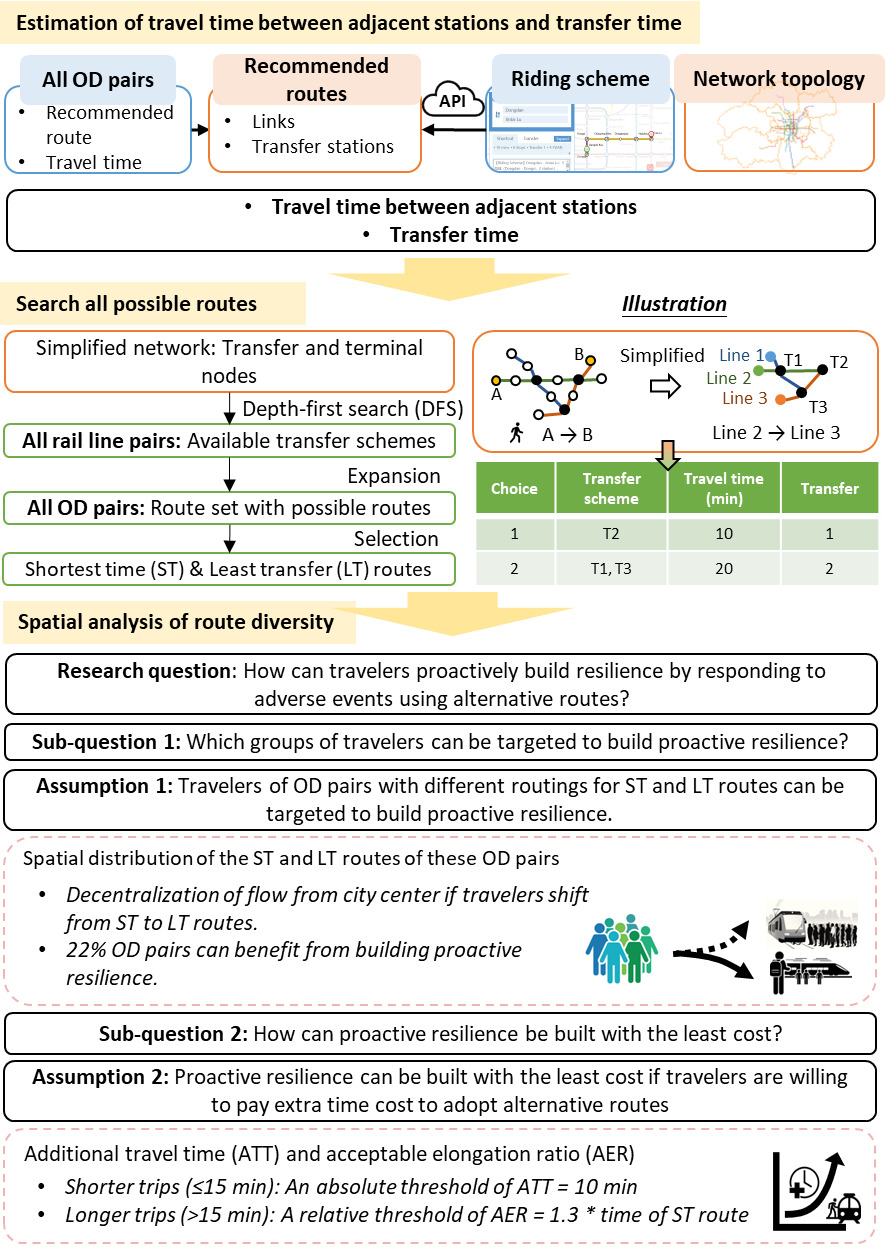
Figure 1 shows our research framework, including the data used and the route search procedure. Our method, which is based on the notion of route diversity, uses two major concepts:
-
Shortest-time (ST) versus least-transfer (LT) route. Existing route search tools, provided by the map services of Google,[1] Baidu[2] and the Beijing subway operator,[3] recommend routes based on the ST and LT criteria. Although ST and LT routes can be identical, we focus on the OD pairs that provide different routes. As deliberate guidance greatly influences the distribution of passenger flow (Ceder and Jiang 2020), we examine how the flow differs when passengers choose different routes from the ST and LT choices.
-
Set of reasonable routes. Routes other than the ST and LT routes are available to passengers. The sizes of reasonable route sets vary among travelers, and reasonability is based on the extra cost compared with the shortest route. We examine how the increase in the acceptable extra cost enhances route diversity and hence contributes to proactive transport resilience. We test the absolute and relative thresholds of the extra cost, the additional travel time (ATT) and the acceptable elongation ratio (AER[4]) of a route relative to the cost of the ST route. Testing for the thresholds uses the empirical values of ATT = 30 min (Huang et al. 2018; Jiang and Levinson 2016) and AER = 1.3 (Zhu et al. 2020).
3. Findings
Which groups of travelers can be targeted to build proactive resilience?
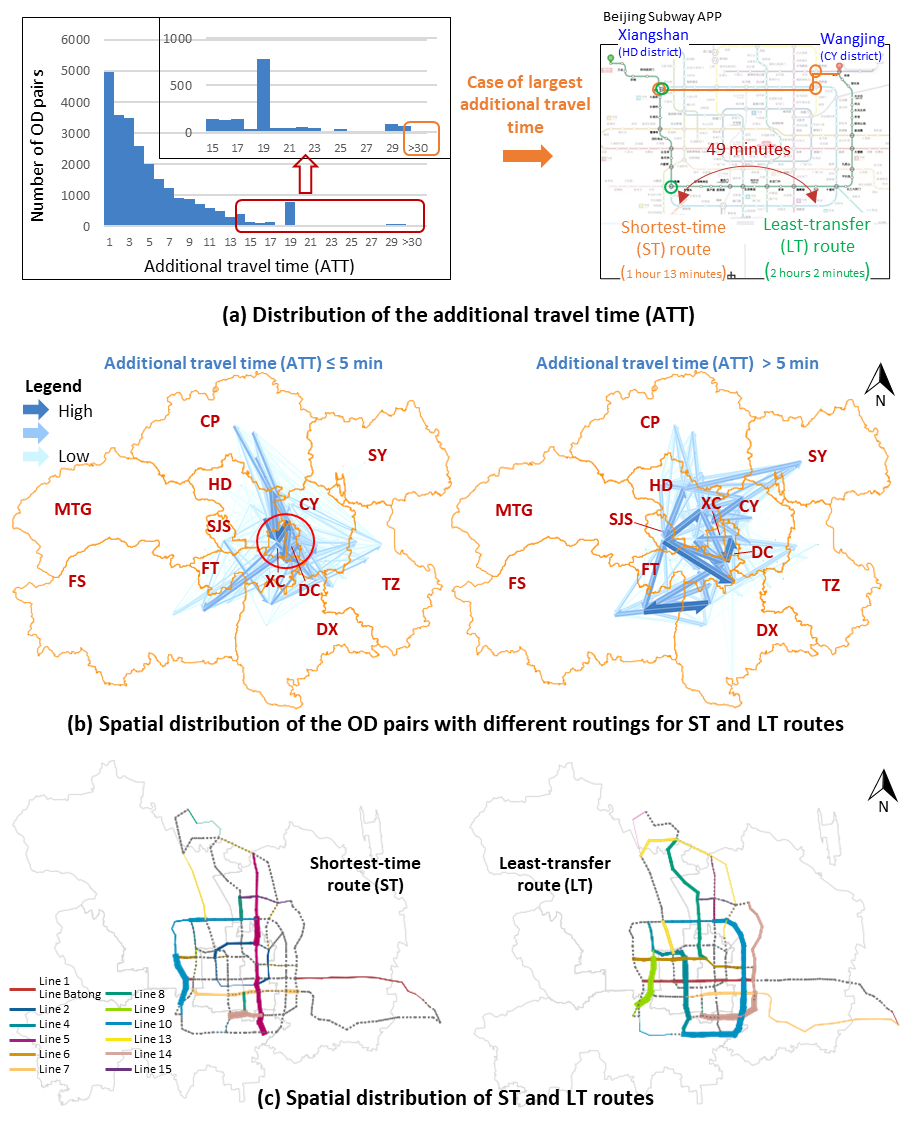
From Figure 2a, 22% of the ST and LT routes of the same OD pairs have different routings. Travelers of 65% of OD pairs can save an average of 5.2 min by opting for an additional transfer. This result is consistent with empirical studies from London and Santiago (5 min; Raveau et al. 2014) and Beijing (4.48 min; Zhang, Yao, and Yang 2013). In this regard, we examine the spatial distribution of OD pairs with different routings for LT and ST routes (Figure 2b). Most of the OD pairs with ATT ≤ 5 min connect to the central area (Xicheng (XC) and Dongcheng (DC) districts). The OD pairs with ATT > 5 min are concentrated in Shijingshan (SJS) district, which connects the western and eastern parts of Beijing. Figure 2c shows a significant difference in the spatial distribution of ST and LT routes. If passengers choose the ST routes, the flow could potentially be directed to Line 5 and to west of Line 10; however, if they choose the LT routes, the eastern section of Line 10 and the links of Lines 4 and 9, which are geographically closed to the central area, are required to cope with the influx of passengers.
_and_least-transfer_(lt)_route.png)
How can proactive resilience be built with the least cost?
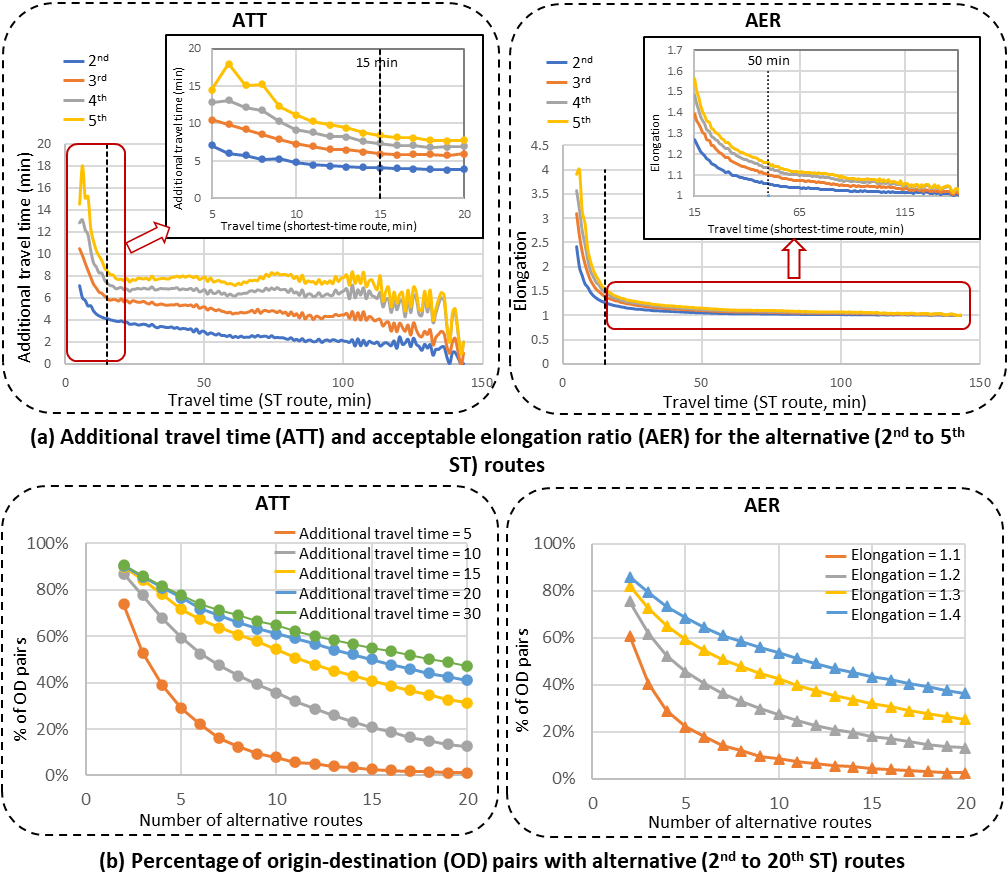
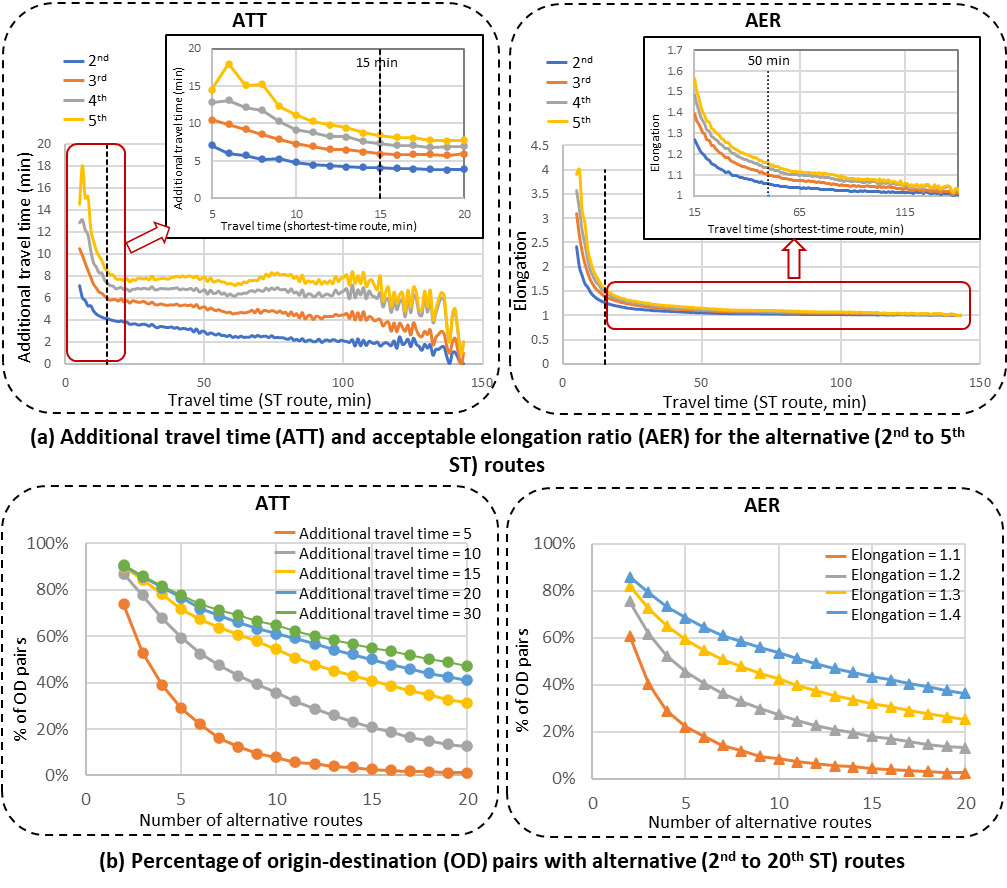
Figure 3a shows the statistics of the routes perceived as reasonable. For short trips (≤15 min), the ATT declines rapidly as the travel time increases. For long trips (>15 min), the AER of the alternative routes decreases slowly as the travel time increases. Another critical threshold is AER = 50 min, as it remains almost constant for trips > 50 min. Therefore, we suggest a combination of the ATT and the AER as the threshold of the extra cost: the ATT for short trips and the AER for long trips. Figure 3b shows the percentage of OD pairs with different numbers of alternative routes. When the ATT is constrained to 5 min, 74% of OD pairs have one or more alternative routes, with only about 20% having five alternative routes. 41% of the OD pairs provide 20 alternative routes with ATT = 20 min, which increases to 47% if the ATT is constrained to 30 min. Changing the AER from 1.1 to 1.4 greatly increases the number of alternative routes. An empirical value of 1.3 based on smart card data (Zhu et al. 2020) increases the number of alternative routes similarly with ATT = 10 min. In conclusion, to build proactive resilience with the least cost, we suggest an absolute threshold of ATT = 10 min for short trips and a relative threshold of AER = 1.3 for long trips.
Acknowledgments
This work was supported by funding from the Innovation and technology Commission of the HKSAR to the Hong Kong Branch of National Rail Transit Electrification and Automation Engineering Technology Research Center (K-BBY1), The Hong Kong Polytechnic University, Kowloon, Hong Kong.
AERi = time cost of route i divided by time cost of the ST route.