
1. Questions
Safety is at the forefront of micromobility policy with rapidly increasing e-scooter use in the United States. The existing literature has a limited understanding of time-of-day and seasonal patterns of e-scooter crashes. While many e-scooter safety policies are based on the number of crashes (Austin Public Health 2019; Santacreu et al. 2020), accounting for exposure provides a measure of risk to inform effective safety strategies (Merlin, Guerra, and Dumbaugh 2020). Nighttime crash risk is generally higher across all modes of transportation and we aim to quantify that relative risk for e-scooter use.
This study focuses on motor vehicle-involved e-scooter crashes since they constitute the most severe injuries. We compare daytime and nighttime motor vehicle-involved e-scooter crashes and combine them with micromobility trip data to generate exposure variables and estimate crash risk. The key research question of this paper is as follows: Are crashes or crash rates disproportionately higher at night than during the day?
2. Methods
We combined crash records and e-scooter usage data from Nashville, Tennessee, from September 2018 to January 2022, using the following two datasets. Crash data was extracted from the Tennessee Integrated Traffic Analysis Network (TITAN) police crash database to identify 82 motor vehicle-involved e-scooter crashes (Tennessee Highway Safety Office 2020), following methods from Shah et al. (2021). We acquired the Shared Urban Mobility Device (SUMD) dataset for e-scooter exposure for September 2018 to February 2020 from the City of Nashville through a data request. Through a similar request, Populus Technologies, Inc, which currently curates e-scooter data for the City of Nashville, provided trip data through January 2022. We extracted dawn and dusk time for each day to identify the proportion of trips completed and crashes occurring during daytime and nighttime hours (Kennedy 2020).
We received hourly aggregated data from Populus with basic data cleaning (a total of 1,758,327 trips from March 2020 to January 2022). We cleaned the SUMD trip dataset from September 2018 to February 2020 following similar criteria as Populus (i.e., duplicates, trips with two or fewer GPS coordinates or more than five thousand GPS coordinates, and trips greater than seven hours). We also removed trips less than 200 feet, leaving 3,162,728 trip records throughout the study period for the analysis.
Figure 1 summarizes the bi-monthly number of crashes, number of e-scooter trips, and the number of crashes per e-scooter trip (crash rate) segmented by day and night throughout the study period. We used the bi-monthly level of aggregation because some months did not have any daytime or nighttime e-scooter crashes. The number of daytime crashes was generally higher than the number of nighttime crashes, as illustrated in Figure 1a. The number of daytime trips was also higher than the number of nighttime trips, as illustrated in Figure 1b. However, nighttime crash rates were generally higher than daytime crash rates, as indicated in Figure 1c.

We used negative binomial regression in Stata to evaluate the statistical difference in the daytime and nighttime crash rates, with the number of trips as the exposure variable. The dependent variable is the number of bi-monthly crashes, and the independent variable is a dummy variable indicating nighttime crashes. We removed the data for peak COVID-19 months between March 2020 to May 2020, as there was low vehicular traffic. We also added a dummy variable for crashes observed between March 2020 to December 2020 as a control for COVID-19 since travel behavior was dramatically disrupted then. We also used dummy variables for bi-monthly observations to control for seasonal variation in e-scooter usage.
3. Findings
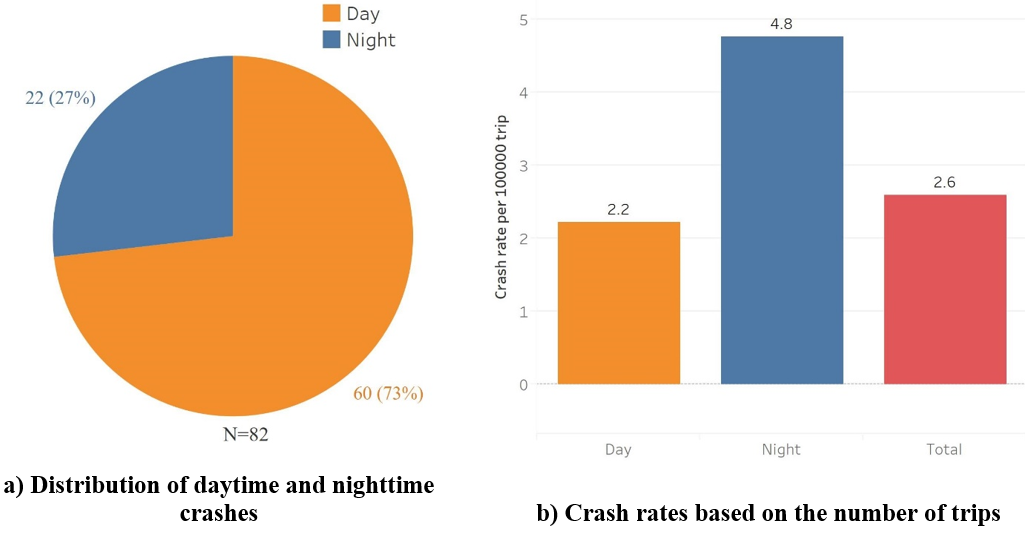
Figure 2 summarizes the total number of e-scooter crashes and bi-monthly crash rates by daytime and nighttime. Out of 82 motor vehicle-involved crashes, 60 (73% of all crashes) occurred during the daytime, while 22 (27% of all crashes) occurred during the nighttime. On average, we observed 2.6 crashes per 100,000 trips. When segmented by daytime and nighttime, the crash rate during the night was higher than during the daytime (4.8 vs. 2.2 crashes per 100,000 trips).

Table 1 includes the negative binomial regression model results of bi-monthly daytime and nighttime e-scooter crash rates. The model is statistically significant (probability of LR test statistics is 0.027). The dummy variable for nighttime crashes is significant, indicating that the likelihood of nighttime crashes is 1.81 times greater than daytime crashes. The COVID-19 control is also significant, suggesting that the number of crashes decreased by a factor of 0.28 during the peak pandemic era, when accounting for exposure.
Possible reasons that e-scooter rides are riskier at night compared to daytime could be a) low conspicuity as e-scooters are small and are not equipped with powerful lights, b) low visibility due to poor lighting of streets that makes it difficult for motor vehicle drivers and e-scooter riders to be aware of their environment and c) higher vehicular speeds because of low congestion. We did not see strong evidence of alcohol impairment in the police crash reports from drivers or e-scooter riders for the same crash dataset (Shah et al. 2021), though nearly one quarter of all car drivers fled the crash scene. The policy implication of the nighttime crash rate being higher than daytime could justify policy or technology interventions to improve the safety of e-scooter riders at night.
Like other Vulnerable Road Users (VRU) (Ferenchak and Abadi 2021), e-scooter riders are more vulnerable to crashes at night. Future research can perform exposure analysis on the network to identify riskier infrastructure and evaluate exposure with rider demographics (gender and age group) and riders’ experience (first time vs. regular riders). It is possible that tourists, students, or first-time riders are more prone to crashes with cars. Researchers can also explore crash severity and types of infrastructure used during the day or night as well as compare the crash rates over time.
Acknowledgment
This study was supported by the Collaborative Sciences Center for Road Safety, a USDOT University Transportation Center. It was also supported by the Oak Ridge National Laboratory GATE fellowship program. The authors appreciate the data access from Nashville Metro Government and participation from Populus.