1. Questions
Route choice modelling, especially for bicyclists, quantifies the factors determining route selection and, based on those factors, can be used for facility location and network improvement. For revealed choice datasets, the plausibility of the models is undermined by the challenge of creating realistic choice sets. Moreover, the routes that were actually considered by the traveller may be difficult to identify. Previous studies (Li, Muresan, and Fu 2017; Zhu and Levinson 2015) have used ratio of overlap to evaluate the quality of the alternatives, but in dense urban networks, this ratio is low. In this study, we introduce ‘deviation’ which captures the closeness or average distance between alternative routes and actual trajectories. High values for deviation indicate that the route alternative was not similar to the chosen route, and when all alternatives for a particular trip have high deviation, the choice set has not captured the attribute(s) that are most important to the route choice decision.
The hypotheses are:
-
Shorter lengths are more likely to result in smaller deviation.
-
Less traffic signals are more likely to result in smaller deviation.
-
Lower traffic flow is more likely to result in smaller deviation.
-
Routes with high percentage of bike trail are more likely to result in less deviation.
-
Route with high percentage of dedicated bike lane (or on-street bike lane) are more likely to result in less deviation.
2. Methods
2.1. Data collection
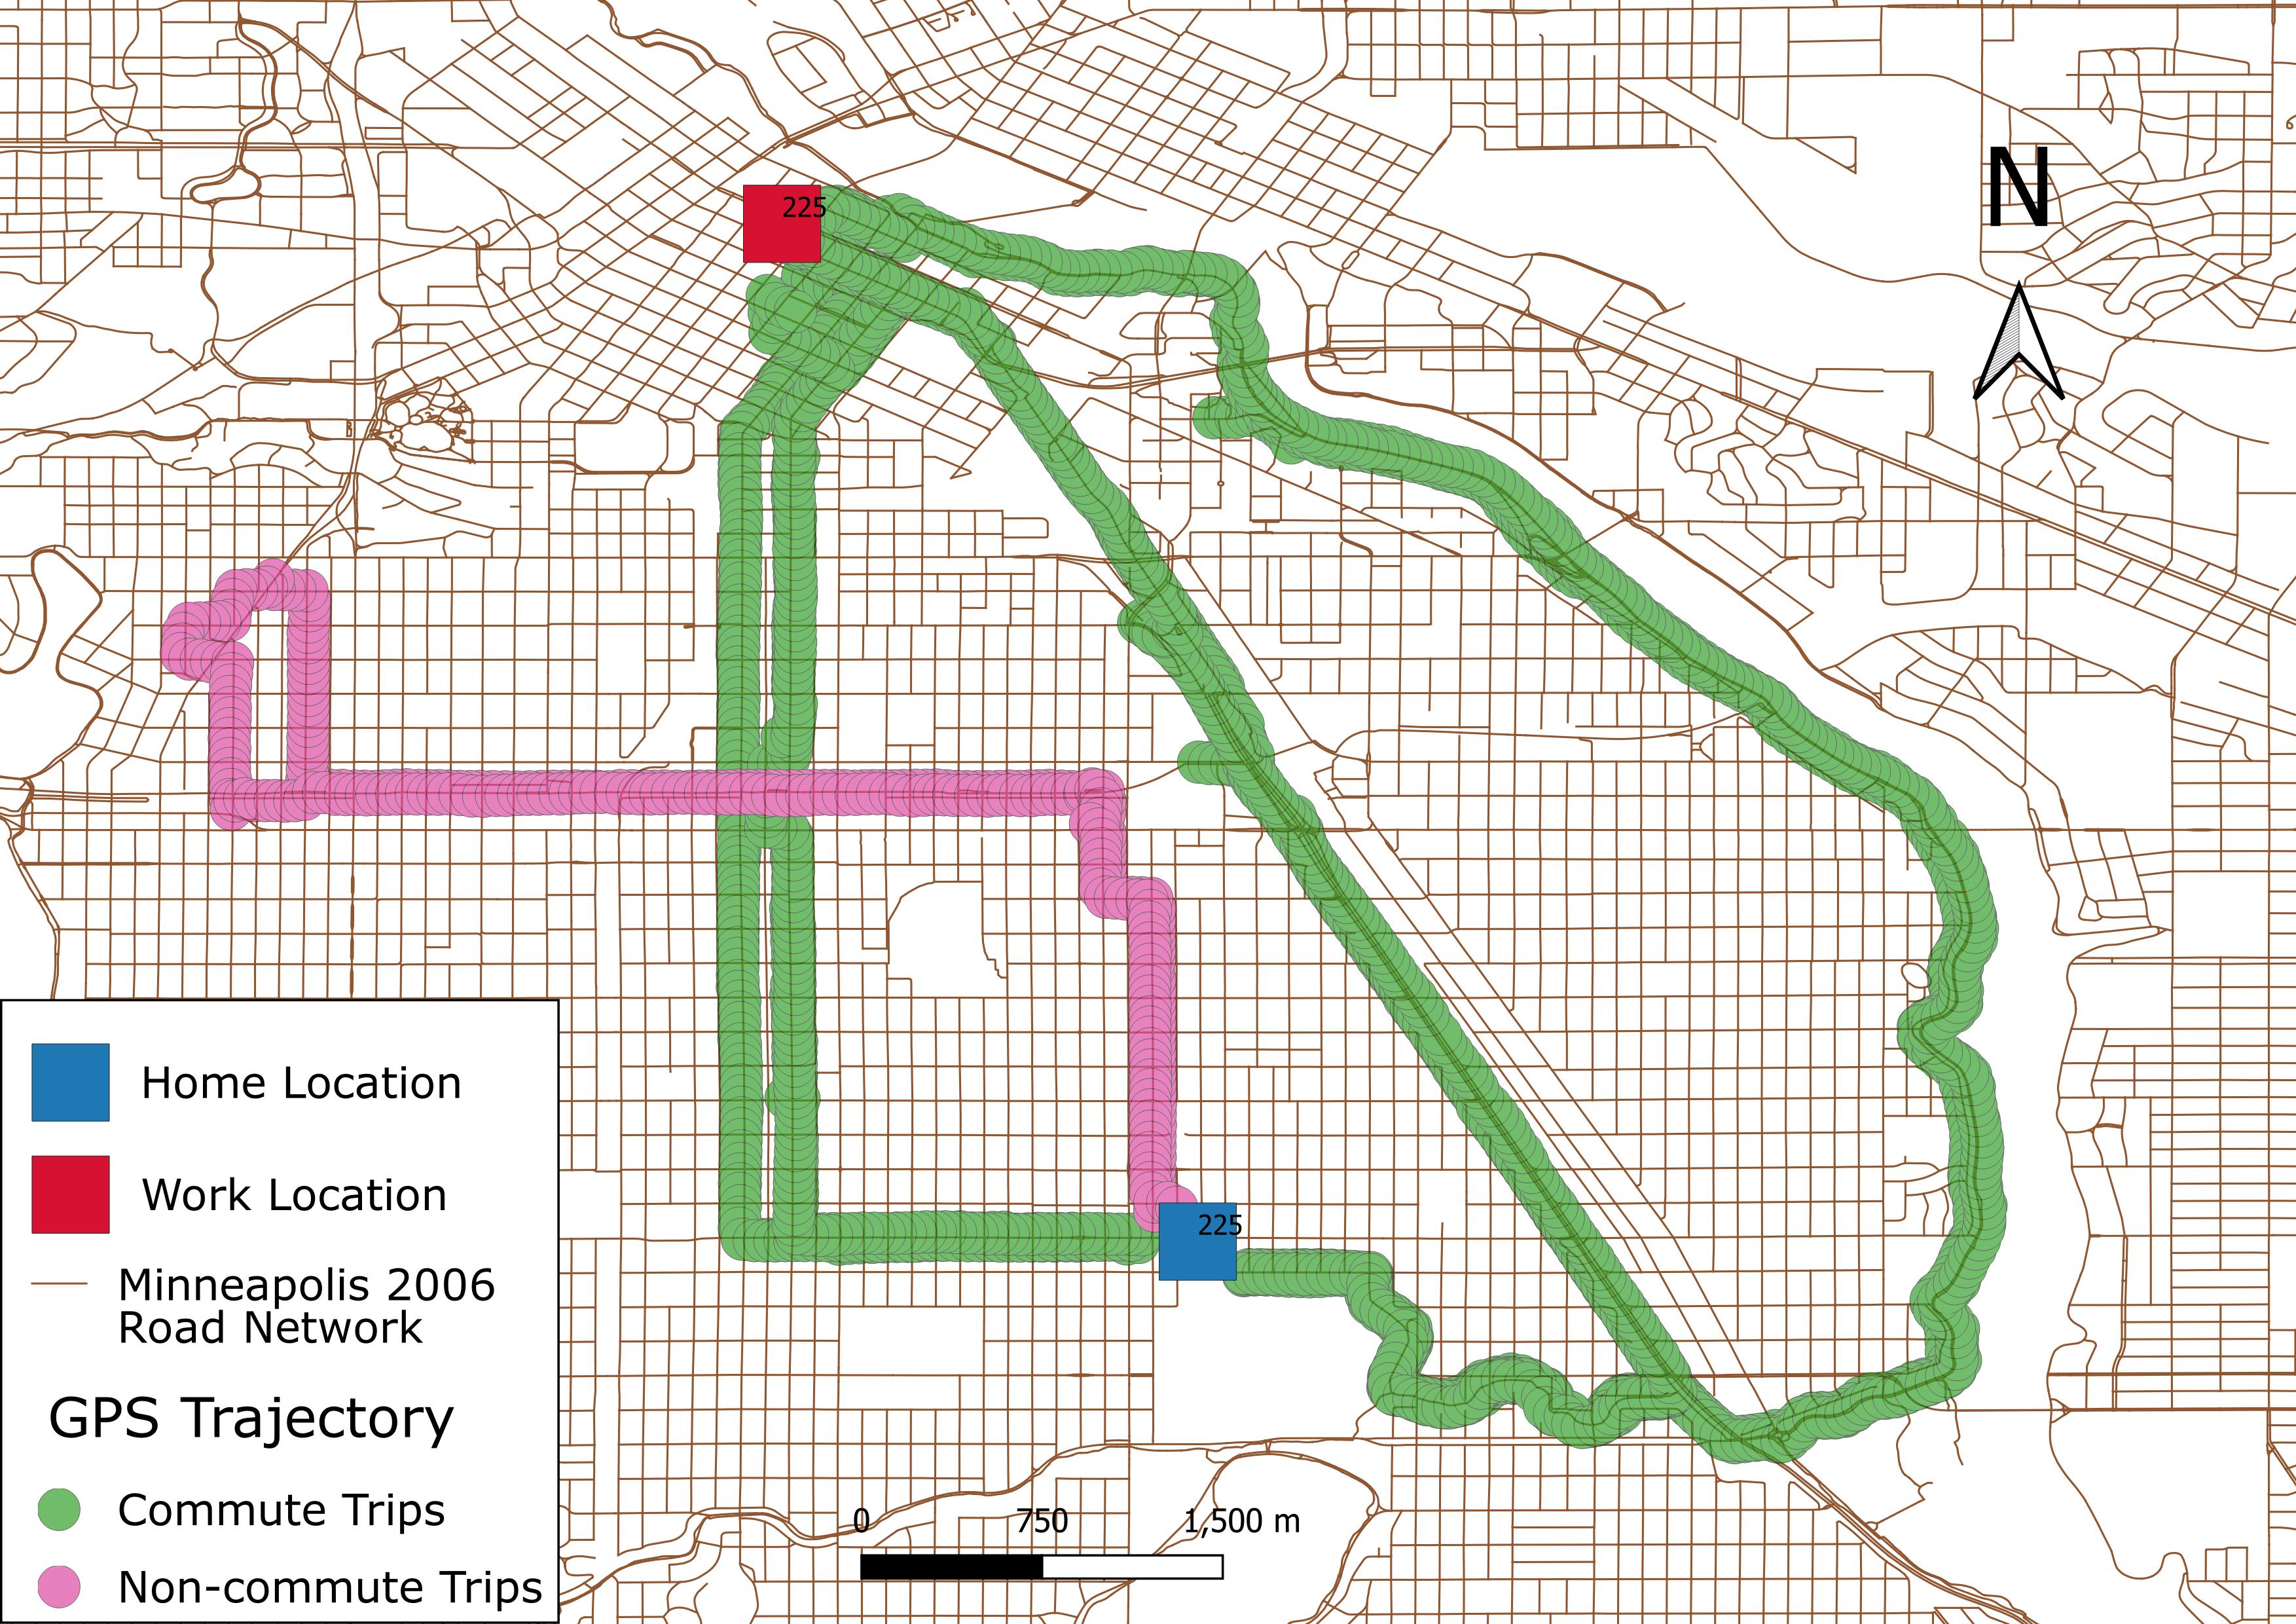
In this study, all GPS data are obtained from Harvey et al. (2008) and Menard et al. (2009), who collected repeated data over 2 weeks from 49 regular bicyclists living in South Minneapolis in 2006. Small GPS dataloggers, which record location and elevation every 2 seconds with roughly 3 meters accuracy, are attached to participants’ bicycles. All GPS points which are located in a 100m radius of the participant’s home or workplace location, are removed and the recorded home and workplace locations have been randomized within the same radius to protect the privacy of participants. In addition, as recorded GPS for home and workplace were jittered, and participants might not start recording their trips exactly at the home or work place, there is a discrepancy between home or workplace and the start point or end point of some trips. A 250-m radius around the home and workplace is used to filter out origins and destinations of non-commute trips such as shown in Figure 1. After filtering, 600 of 831 trips remain.

2.2. Map matching
As the map data are downloaded from OpenStreetMap version 2021 and the trajectories were recorded in 2006, adjustments based on archival Google Maps StreetView are carried out to reproduce the historical road network before matching GPS data to network. In addition, the 2021 cycleways have been categorized as three different types of cycleway in 2006.
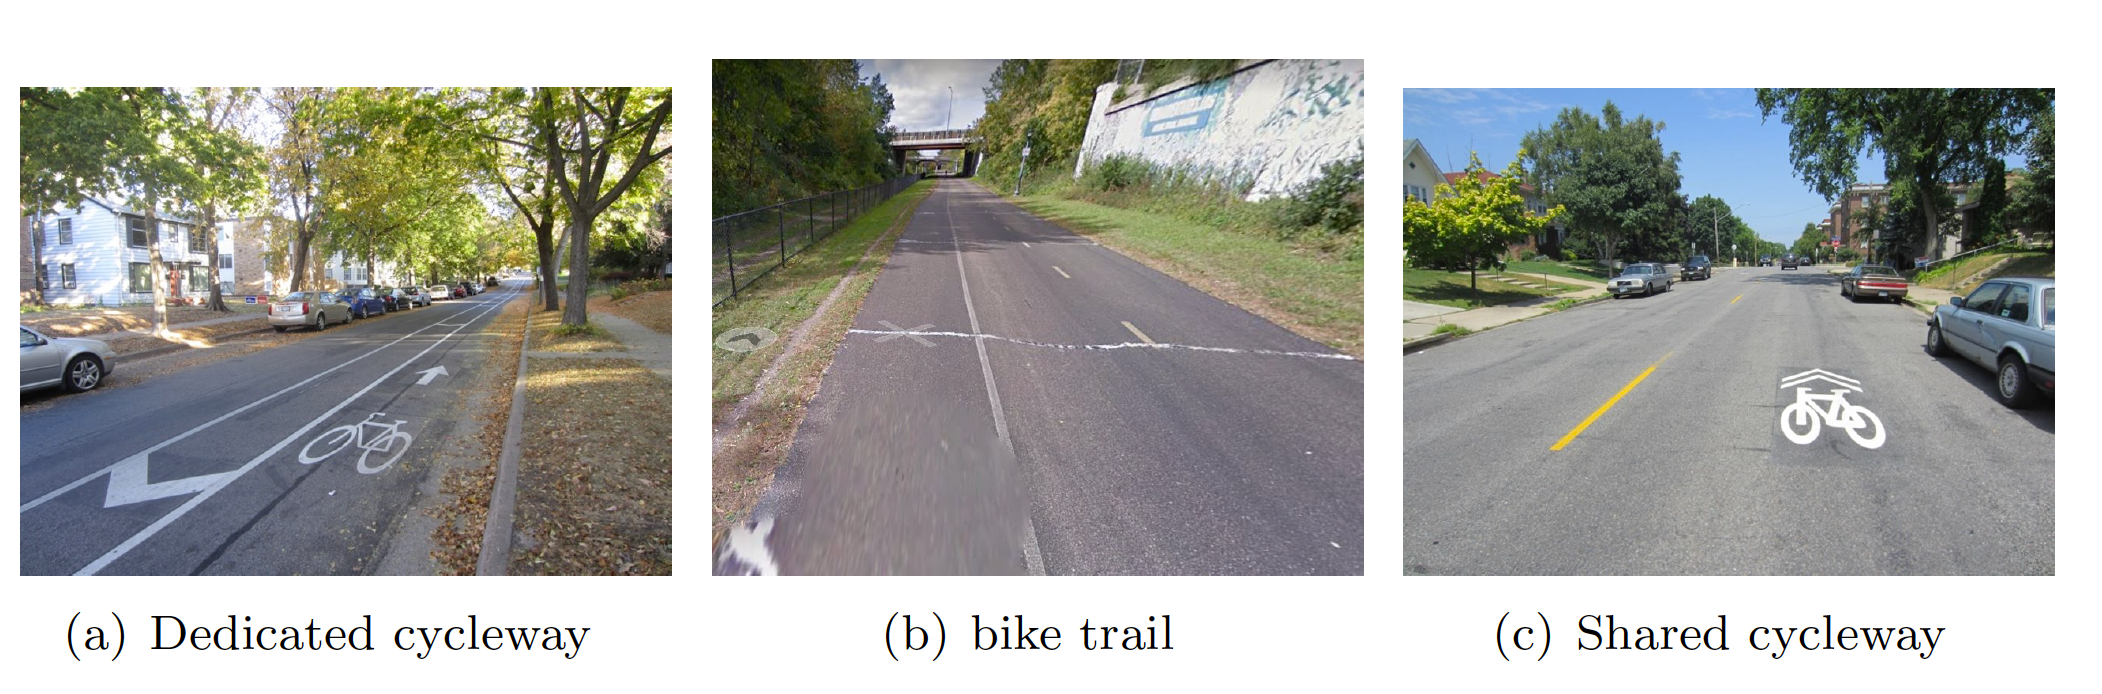
As shown in Figure 2, the first type is dedicated cycleway, which are approximately 5 ft-wide (1.5 m) and located on the edge of the roadway. Bike trails are another facility designed for bicycles but do not share the right of way with cars to provide safer travelling conditions for cyclists. The last type is shared cycleways, (typically sharrows) which are shared with other transport modes like buses or cars.

In this study, we use KD-Tree which is a geometric measure for matching trajectories to the network. To populate network points set a point was generated every 55 meters along each segment. The basic idea of this method is setting as reference layer and trajectory points set as target layer. For each point in target layer the algorithm finds the closest point in reference layer and records it into the matched trip set
2.3. Choice set generation
The size and quality of the choice set influence the route choice modelling (Prato 2009). To gain a choice set which better captures actual trajectories, a link labelling approach (Ben-Akiva et al. 1984), which generates alternative paths by optimizing different criteria, is implemented. According to previous studies (Bernardi, La Paix-Puello, and Geurs 2018; Broach, Dill, and Gliebe 2012; Lin and Fan 2020; Zimmermann, Mai, and Frejinger 2017), distance, traffic flow, and bike facilities are important factors for cyclists planning their trips.
To understand the preference of bike facilities for 49 participants, the constitution of each trip is analysed. For each type of bike facility, the number of trips for which the length percentage of that facility is higher than other road types is listed in Table 1. Based on the lack of trips dominated by shared cycleways, this facility is not as important as the other two when people choose travel routes. Thus paths with maximized bike trail proportion and paths with maximized dedicated cycleway proportion are included in the choice set. However, paths with maximized percentage of bike trails sometimes result in extremely long routes (approximate 3 times the shortest path length) which might be unrealistic for most commute trips. To include a more realistic percentage of the length on bike trails, a set of factors from 0.1 to 1 with 0.1 increase each time are used to weight the bike trails’ length. In addition, as recommended in previous study (Ghanayim and Bekhor 2018; Sobhani, Aliabadi, and Farooq 2019; Tilahun, Levinson, and Krizek 2007), the shortest path and the fastest path are generated for each OD pair.
All generated path are then included into a set and alternative routes for a OD pair with more than 80% similarity, which is measured by the length of common links, are removed from The size of is too large for efficient modeling, and the difference of the size of choice sets between travelers might also create bias. Therefore, for each traveller, 6 paths are defined
-
shortest path
-
path with maximum proportion of dedicated cycleways
-
path with maximum proportion of on-street cycleways
-
path with maximum proportion of secondary road
-
path with maximum proportion of cycleway and
-
path with maximum proportion of bike trail but total length within 1.3 times shortest path length
have been selected to form choice set The reason for containing is that secondary roads are found have a relative high proportion of recorded trips, and fewer turns are needed on secondary roads. For scenarios with length within 1.1 to 1.6 times shortest path length are tested, and 1.3 gives the highest similarity to observed trajectories.
2.4. Deviation
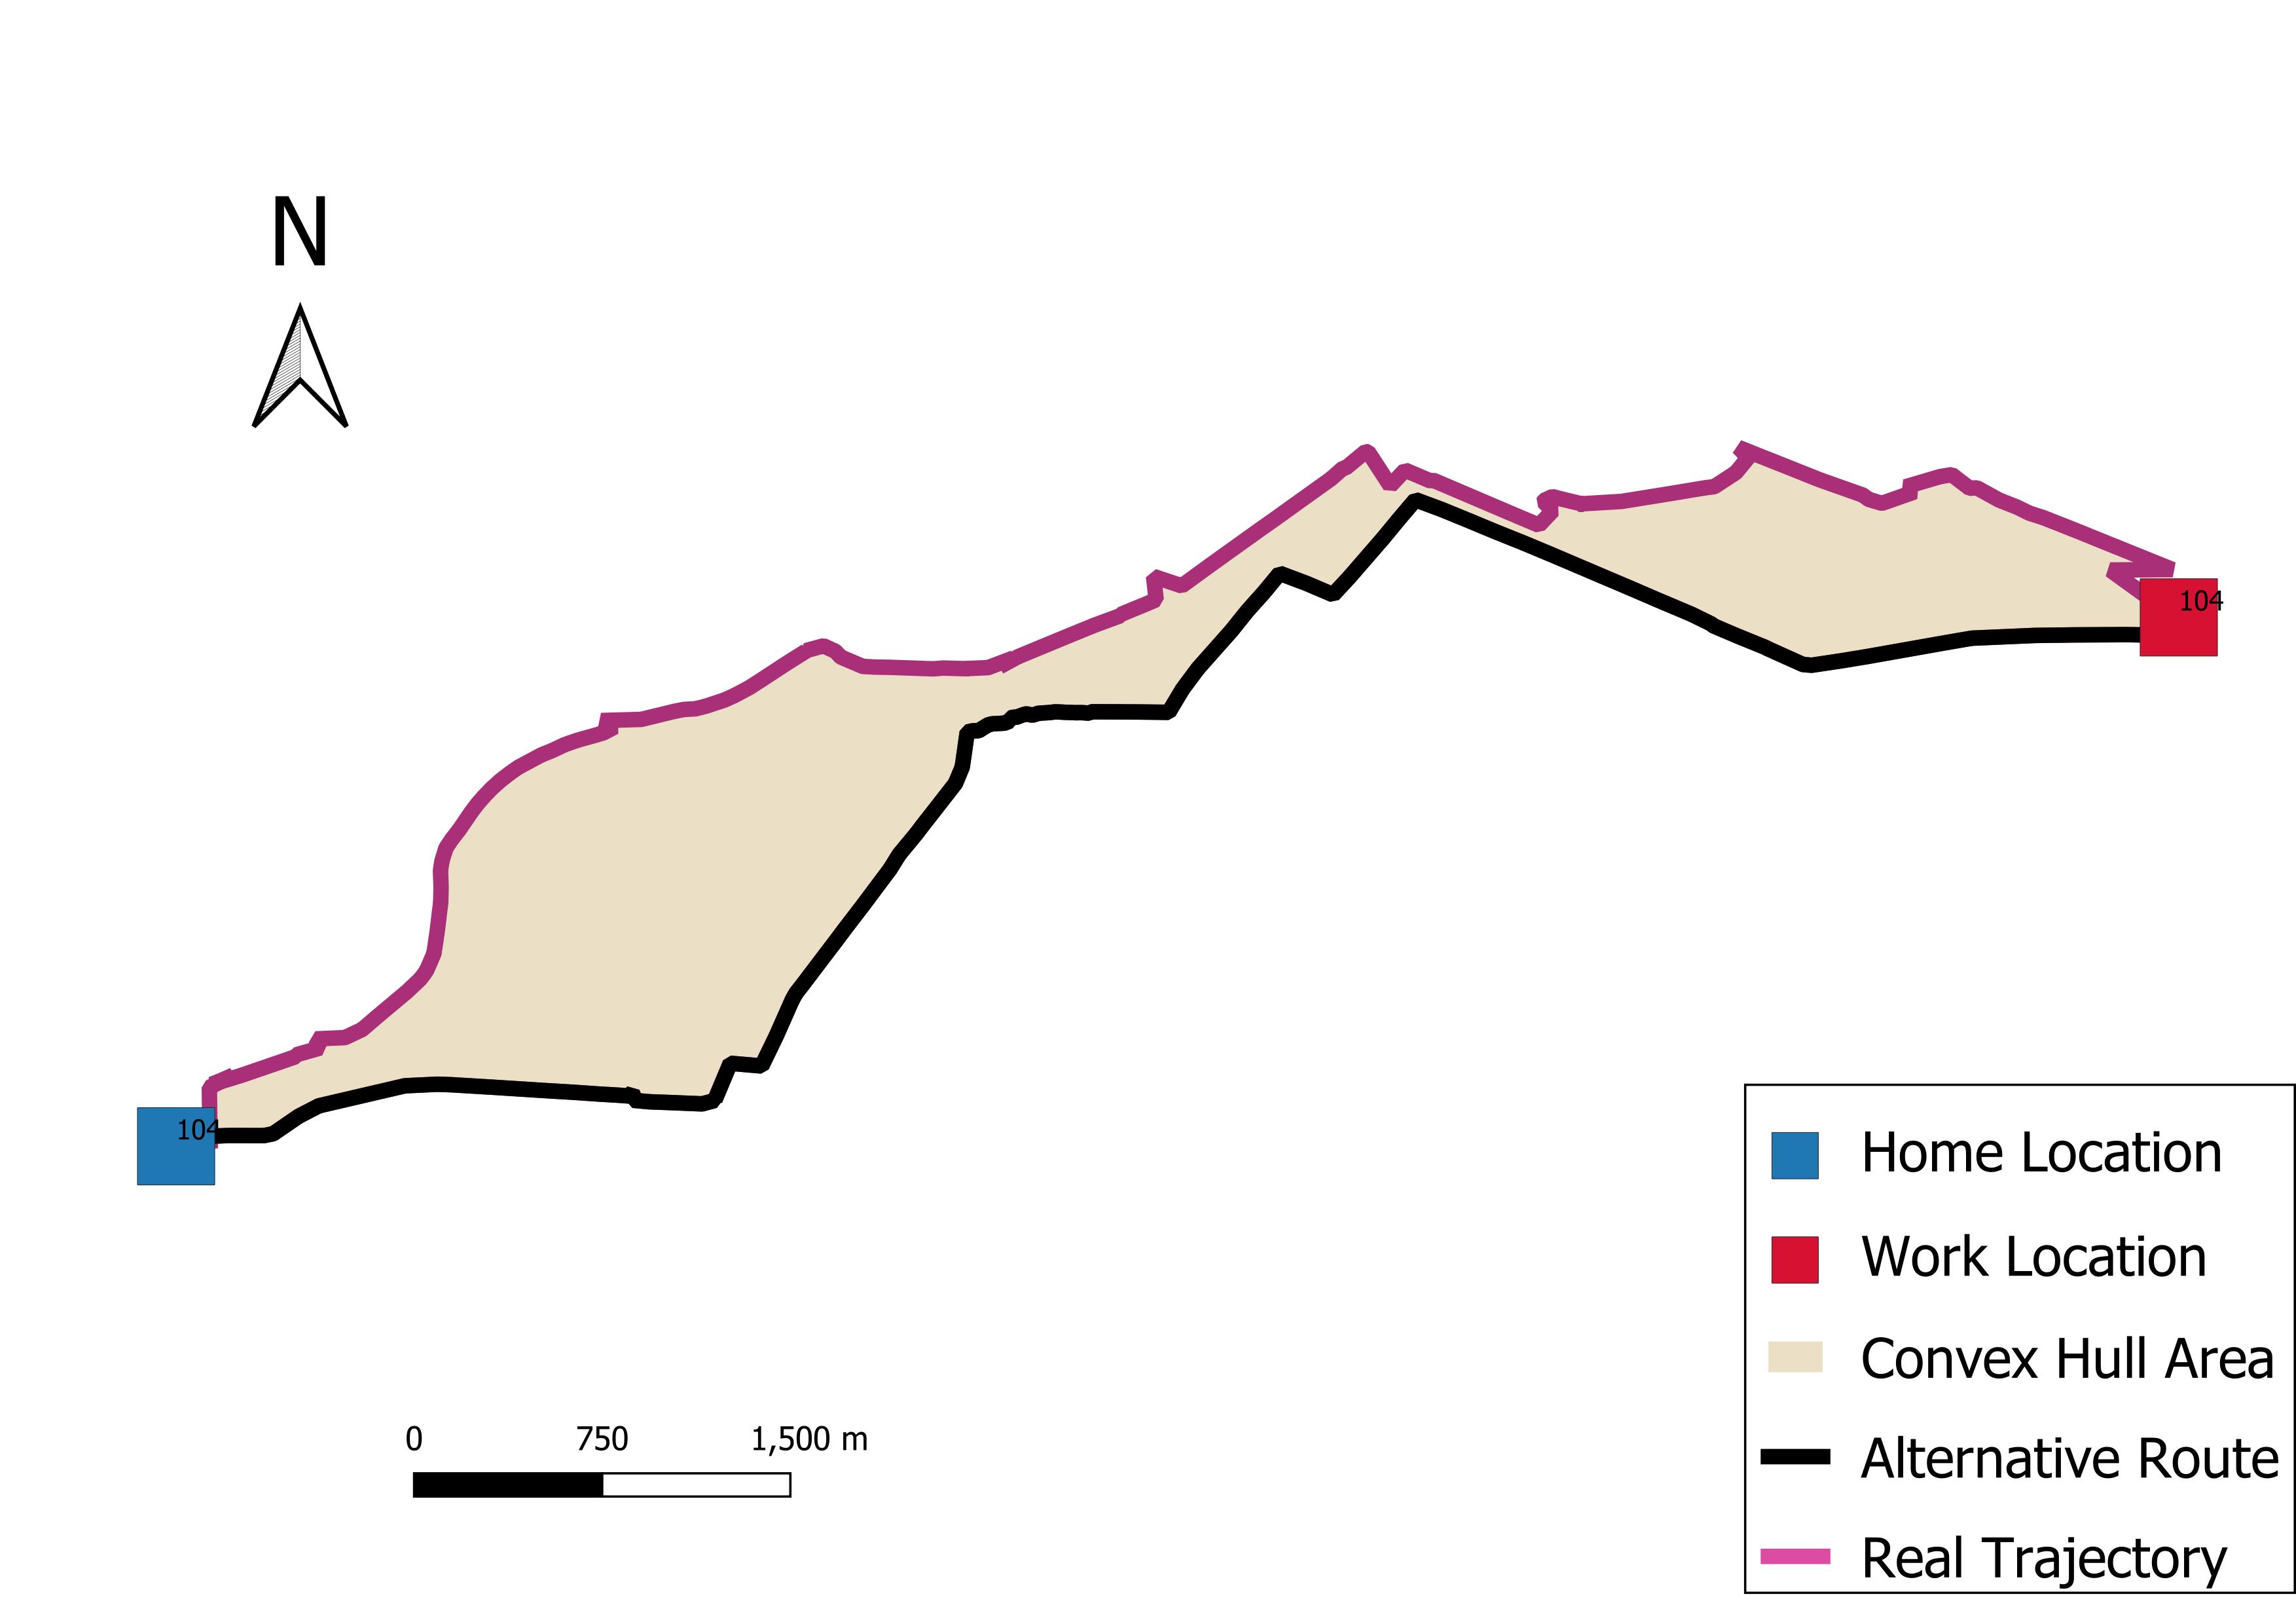
Deviation measures the similarity between paths. It can be applied to compare the generated alternative routes and actual trajectories. To measure the dependent variable ‘deviation’, we construct the convex hull, which is the polygon formed by the set of all points in the alternative route and trajectory as shown in Figure 3. equals to the square root of that area.

2.5. Panel regression model
The alternative route with the lowest best captures the features of the selected route. Since 600 trips are collected from 49 travelers during a period of time, to control the correlation of the errors due to unobserved variables associated with panel data, a Fixed Effect (FE) regression model is applied to model the deviation and the results are compared to pooled ordinary least squares (OLS) regression model. The variables in regression models are presented in Table 2.
3. Findings
Overall, as shown in Table 3, routes with shorter length and higher percentage of bike trail minimize deviation with actual trips. So the hypotheses 1 and 4 made in section 1 are corroborated. Percentage of on-street bike lane, VKT, and traffic lights per km are not statistically significant at 95% confidence level in this data set.