
1. QUESTIONS
Studies of neighbourhood food environments typically rely on commercial or registry-based data systems. Previous work has focused on data quality and geographical biases in commercial data sources (Lebel et al. 2017; Daepp and Black 2017; Clary and Kestens 2013). Yet it is unclear whether community science food outlet data are a reliable alternative to costly commercial datasets, which can be used by academics, practitioners, and policy makers to understand food environments in real time. To understand the utility of commercial and community science data, overall and for counts of specific food outlet categories, we calculated the validity of food outlet data from commercial data (DMTI Enhanced Points of Interest) and community science data (OpenStreetMap (OSM) and Yelp) via comparisons to Google Street View (GSV), the ‘reference standard’.
2. METHODS
We conducted a case study in two Canadian cities: Vancouver and Montreal; using 2020 DMTI Enhanced Points of Interest dataset (Supplemental Table 1) and obtained Yelp data (Supplemental Table 2) and OSM data (Supplemental Table 3) in Summer 2021. The DMTI Enhanced Points of Interest is a proprietary dataset commonly used for research, though its validity varies substantially, and food outlets in DMTI were modestly correlated with food outlets from Canadian tax records (Stevenson et al. 2022). Both OSM and Yelp are community science datasets. OSM uses crowdsourced data to populate maps that are free to use, which has attracted attention from research communities (“OpenStreetMap Research” 2022). Yelp is a public company that publishes crowd-sourced business reviews. Yelp data can be used for research purposes, but data access is restricted.

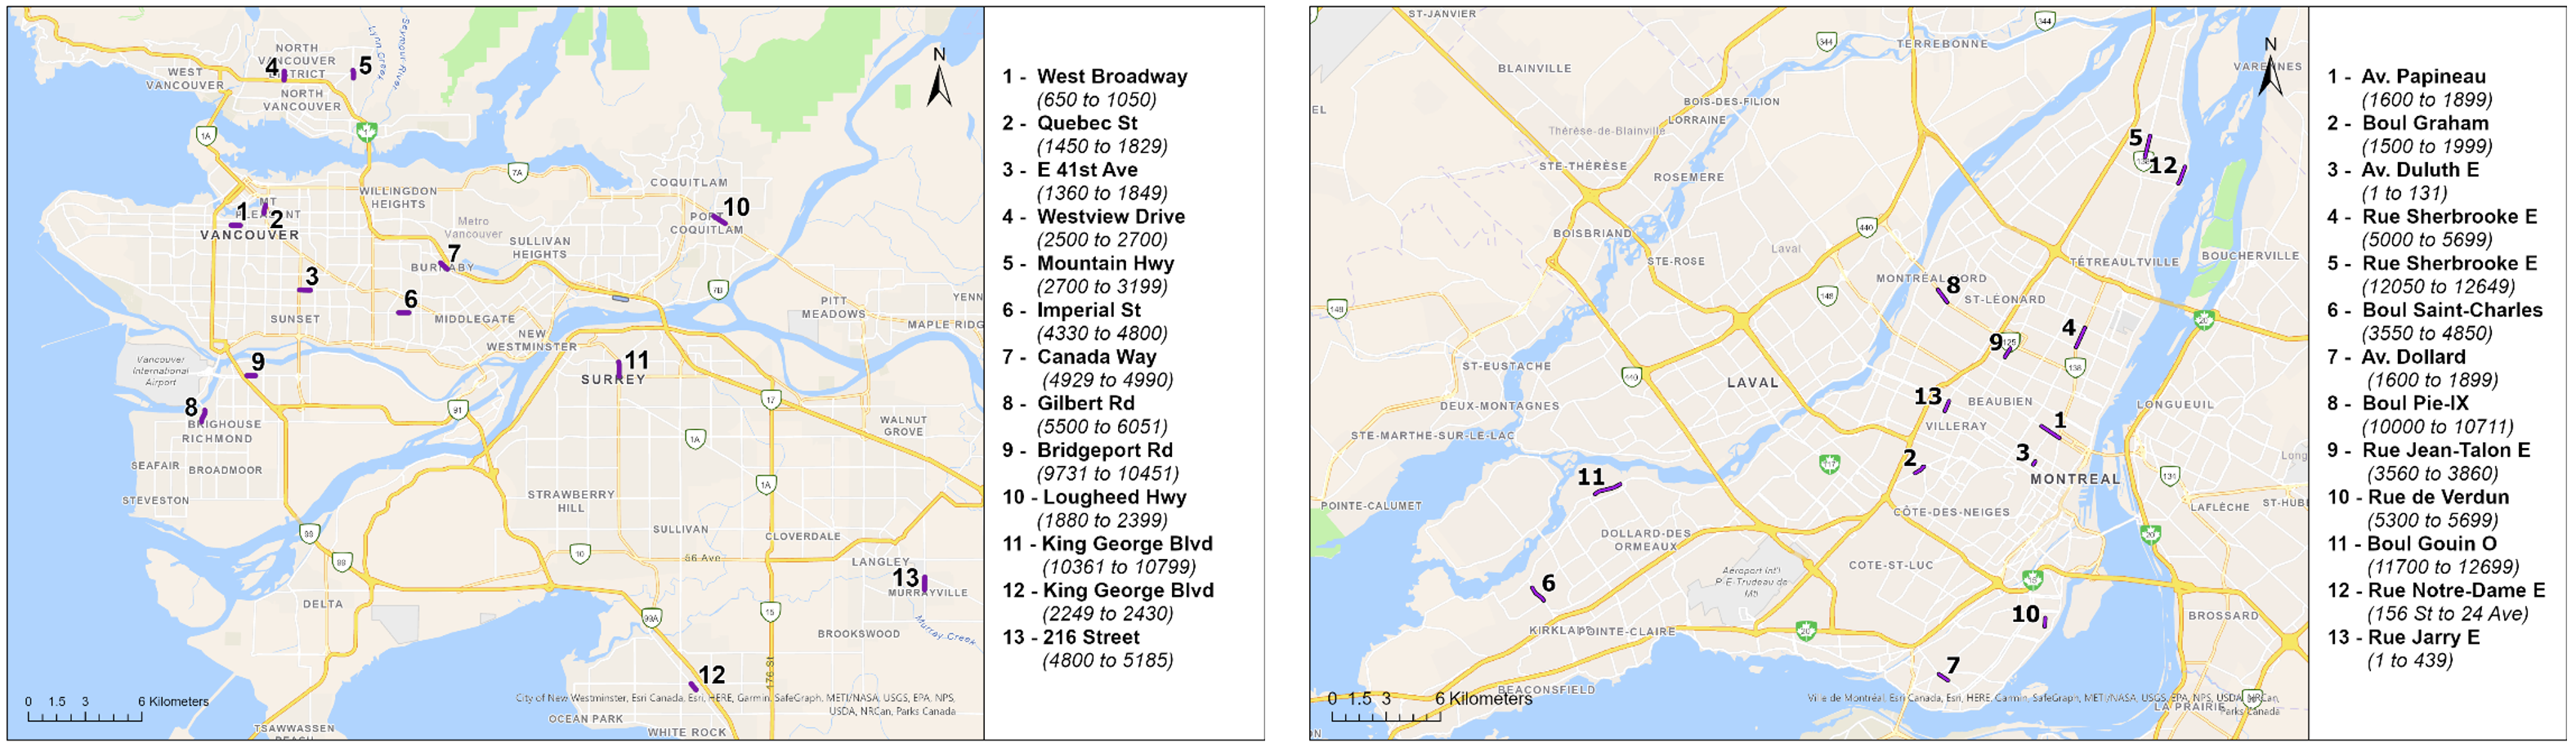
We compared the number of outlets in DMTI, OSM, and Yelp to GSV for a sample of 13 randomly selected street segments each across the Island of Montreal and the Vancouver Metropolitan Area (Figure 1). Eligible street segments were 200 to 1,000 meters long with at least two food outlets identified in GSV. Sampled segments with ≤1 food outlets were resampled from a generated list of street segments in each city. Along each street segment, we recorded the name and location of food outlets in each dataset. We identified food outlets as buildings used primarily for the purpose of selling food and beverages for on and off-premise consumption. We considered seven categories of outlets (grocery, convenience, cafes, bakeries/dessert shops, bars/liquor stores, restaurants, fast food) and included outlets that sold alcoholic beverages because of public health harms associated with access to alcohol outlets (Bright et al. 2018). For the comparisons, GSV was used as the reference standard, as previous work has shown it accurately identifies street-level environmental features (Steinmetz-Wood et al. 2019) and food outlets when compared to in-person fieldwork (de Menezes et al. 2020). We considered a food outlet to be correctly identified if it had the same or similar name, location, and was an operating business on GSV. Analysis completed September 2021.
To evaluate the validity of each dataset, we calculated two validity measures and their corresponding 95% confidence intervals using Clopper-Pearson exact method for binomial probability: 1) Sensitivity (i.e., the percentage of actual food outlets that are present in the dataset), and 2) Positive predictive value (PPV) (i.e., the percentage of food outlets in the dataset that are actually food outlets). Validity measures were calculated for each city and by food outlet categories in Vancouver (grocery, convenience, café, bakeries/dessert shops, bars/liquor stores, restaurants, fast food, supplemental Tables 1-3 for detail). It is important to consider multiple measures of validity because sensitivity alone does not account for false negative results. For example, low sensitivity and high PPV means that the dataset did not identify all food outlets but for the outlets in the dataset, most were correct.
3. FINDINGS
The number of food outlets per segment in Vancouver was 15 outlets on average (range 2-38), and 10 in Montreal (range 2-20). In both cities, OSM and Yelp undercounted the total number of food outlets and DMTI overcounted the number of food outlets in Vancouver by 32 and undercounted in Montreal by 14 (Table 1).
Validity of food outlet datasets. In Vancouver, OSM had the highest sensitivity and PPV, meaning that most outlets identified in OSM were present in GSV and OSM captured the largest proportion of food outlets that were in GSV (Table 1). Of the 194 food outlets in Vancouver, OSM correctly identified 121 (sensitivity 62%, 95% CI: 56%,70%). In Montreal, there were 133 food outlets and OSM correctly identified 71–which corresponded with a lower sensitivity (53%, 95% CI: 45%, 62%) compared to the other datasets, and a higher PPV (89%, 95% CI: 80%, 95%). Validity measures varied substantially across street segments (Figure 2). OSM had accurate counts of all food outlets for 10 of the 26 street segments, Yelp had eight, and DMTI three–all in Montreal.

Both DMTI and Yelp performed better in Montreal relative to Vancouver. In Montreal, both DMTI and Yelp identified a similar number of stores with relatively few false positives. In Vancouver, Yelp identified fewer outlets than GSV; whereas DMTI overcounted, with two-thirds of stores in DMTI not identified in GSV. The large number of ‘extra’ food outlets may include outlets that closed between DMTI data release (2020) and the ascertainment of other datasets (Summer 2021). Data inaccuracies (e.g. different addresses between datasets, duplicate entries) were more common in DMTI. Examining data inaccuracies at the record level is time consuming and may be not feasible for larger scale projects or without local knowledge. In addition, DMTI included non-food businesses (e.g. daycares) despite selecting businesses with food-related Standardized Industry Codes (Supplemental Table 3).
Validity by food outlet type Some research requires data on specific food outlets, thus we explored dataset validity across seven categories of food outlets in Vancouver. OSM correctly identified the most outlets across types, though OSM missed most grocery stores (Table 2). DMTI suffered from overcounting outlets and only identified 17% of restaurants on GSV. Yelp consistently undercounted across outlet types and, importantly, did not identify any convenience stores. These results provide insights into how to pair research questions with the most appropriate dataset.
Our analysis sheds lights on the validity of business registries – both commercial (DMTI) and open data (OSM, Yelp) – at counting and categorizing food outlets for a sample of streetscapes in two Canadian cities. The results can inform how food environment practitioners and researchers can use data registries in their work. We encourage future users of community science datasets to incorporate validity assessments, to characterize how availability of data and validity measures vary across space, as previous work found that Yelp data coverage is clustered within specific neighbourhoods (Folch, Spielman, and Manduca 2018). While we only assessed 13 street segments in each city, these segments were in diverse neighbourhood environments. We acknowledge that our matching criteria may be restrictive given we matched food outlets by location (within a 100-meter buffer) and similar name. Depending on the research question, relaxing matching criteria may improve results (Clary and Kestens 2013). For example, a study that calculates the number of grocery stores within a 3 km buffer may benefit from a more relaxed approach than a study that measures the nearest grocery store from home.
Accessing and obtaining Yelp data are resource intensive and require advanced data management and processing decisions, including deriving food categories from open-ended text fields. However, Yelp provides timely business attributes like operating hours, delivery, and wheelchair accessibility and insights on patrons. OSM data are well documented and relatively straightforward to obtain (Ferster et al. 2019; “OpenStreetMap Wiki” 2022), but OSM does not contain the level of detail available in Yelp. Finally, accessing DMTI remains a barrier, restricted to universities and other entities that pay to use their data services. Further research is needed to determine the potential for systematic error in datasets, in particular the effects of community science users and neighbourhood characteristics (eg, socio-demographics, urban/rural) on the completeness of OSM and Yelp data.
ACKNOWLEDGMENTS
The authors would like to acknowledge Linnea Soli, Sophie Cardinal, and Fiona McClave for their excellent research assistance during the initial stage of this project. CLF, JB, CF, YK, and MW were supported by the Canadian Institutes of Health Research (CIHR) for Environments and Health: Intersectoral Prevention Research.