1. Questions
Strava is a social fitness app that people use to track their bicycling activities. Strava data, generated from crowdsourced activity tracking on the Strava fitness app, provide bicycle ridership data with unprecedented spatial and temporal resolution and the data are used in a growing number of bicycling research, planning, and advocacy projects (Lee and Sener 2021; Nelson, Ferster, et al. 2021). Strava data have shown moderate to strong correlations with the general bicycling population (Lee and Sener 2021). Bias related to who uses Strava to track their rides is well documented (Lee and Sener 2021), with the data tending to underrepresent women and older adults (Griffin and Jiao 2019). Research on sociodemographic representation outside of age and gender (e.g., by race or socioeconomic status) is sparse because Strava does not systematically collect such characteristics, but the limited work available suggests that fitness app users are predominantly White and more affluent (Garber, Watkins, and Kramer 2019)—a trend that mirrors the sociodemographic characteristics of who bikes in Canada (Firth et al. 2021). Yet, through the pandemic time many more people have started using Strava, with app usership rising 33% to 73 million, and collectively users uploading 82% more activities (1.1 billion) from 2019 to 2020 (Strava 2020). These huge increases provoke further questions about changes in data representativeness. Our goal is 1) to evaluate the impacts of increased Strava app use on city-level correlation with counts of all bicycling and 2) to identify changes in correlation in subsets of Strava data representing trip purpose and demographics.
2. Methods
Study area
The study area is in the west coast of Canada and includes the city of Vancouver and Greater Victoria (including Victoria, Oak Bay, Saanich, and Esquimalt municipalities), BC, Canada (Statistics Canada 2016). We chose these cities because both had official bike counts, measures of all bicycle ridership that are needed as a benchmark to assess change in representativeness of bicycling. Both cities also have similarly high bicycling to work mode shares relative to provincial and national averages and have substantial city investment in all ages and abilities bicycling infrastructure but differ in size and the extent of Strava usage (Table 1).
Bicycle count data
We created a bicycle count database for the period April 1-October 31 (2019 and 2020). City staff provided counts from 19 permanent bicycle counter locations in Vancouver, and 29 temporary and permanent locations in Victoria. City count data were provided at hourly aggregations. We used the Strava dashboard to access city data profiles on the total number of people and public bicycling activities recorded on Strava and to download the Strava bicycle count data used in analysis (Strava Metro 2022). These data were provided as aggregate hourly-level counts of bicycling activities across all links in the street network. We matched counts from both sources by location, date, and hour of the day, removing observations with missing data. Then we grouped observations by year for analysis.
Analysis
To compare trends between cities, we calculated the proportional change in the number of app users and bicycling activities logged to Strava using data profiles from the Strava dashboard (Strava Metro 2022). To evaluate how Strava ridership represented counts of all bicyclists, we measured Strava usage rates and assessed correlation between Strava and counts of all bicyclists. The Strava usage rate is the proportion of all trips counted at city bike counters that were captured in the Strava data (Camacho-Torregrosa et al. 2021), and the correlation indicates whether Strava bicyclists provide a good approximation of all bicyclists (Lee and Sener 2021). Subsets of Strava data may be more representative of the general population and drive trends observed in the pooled sample (all observations combined) (Fischer, Nelson, and Winters 2020; Nelson, Roy, et al. 2021); so, we calculated usage rates and correlation measures for the pooled sample of Strava ridership and for subsets of Strava data by trip purpose and demographics. Specifically, we used labels in the Strava data to extract data subsets for recreation and commute ridership, and for the sample of ridership generated by women and by older adults (55+).
3. Findings
The number of people using Strava to track bicycling activities and the total volume of bicycling activities recorded on Strava increased in both cities, with the greatest increases in Vancouver (Table 2). In Vancouver app usership nearly doubled (48% increase) and Strava bicycling activities increased by 41%, whereas in Victoria app usage and activities increased by 26 and 27%, respectively.
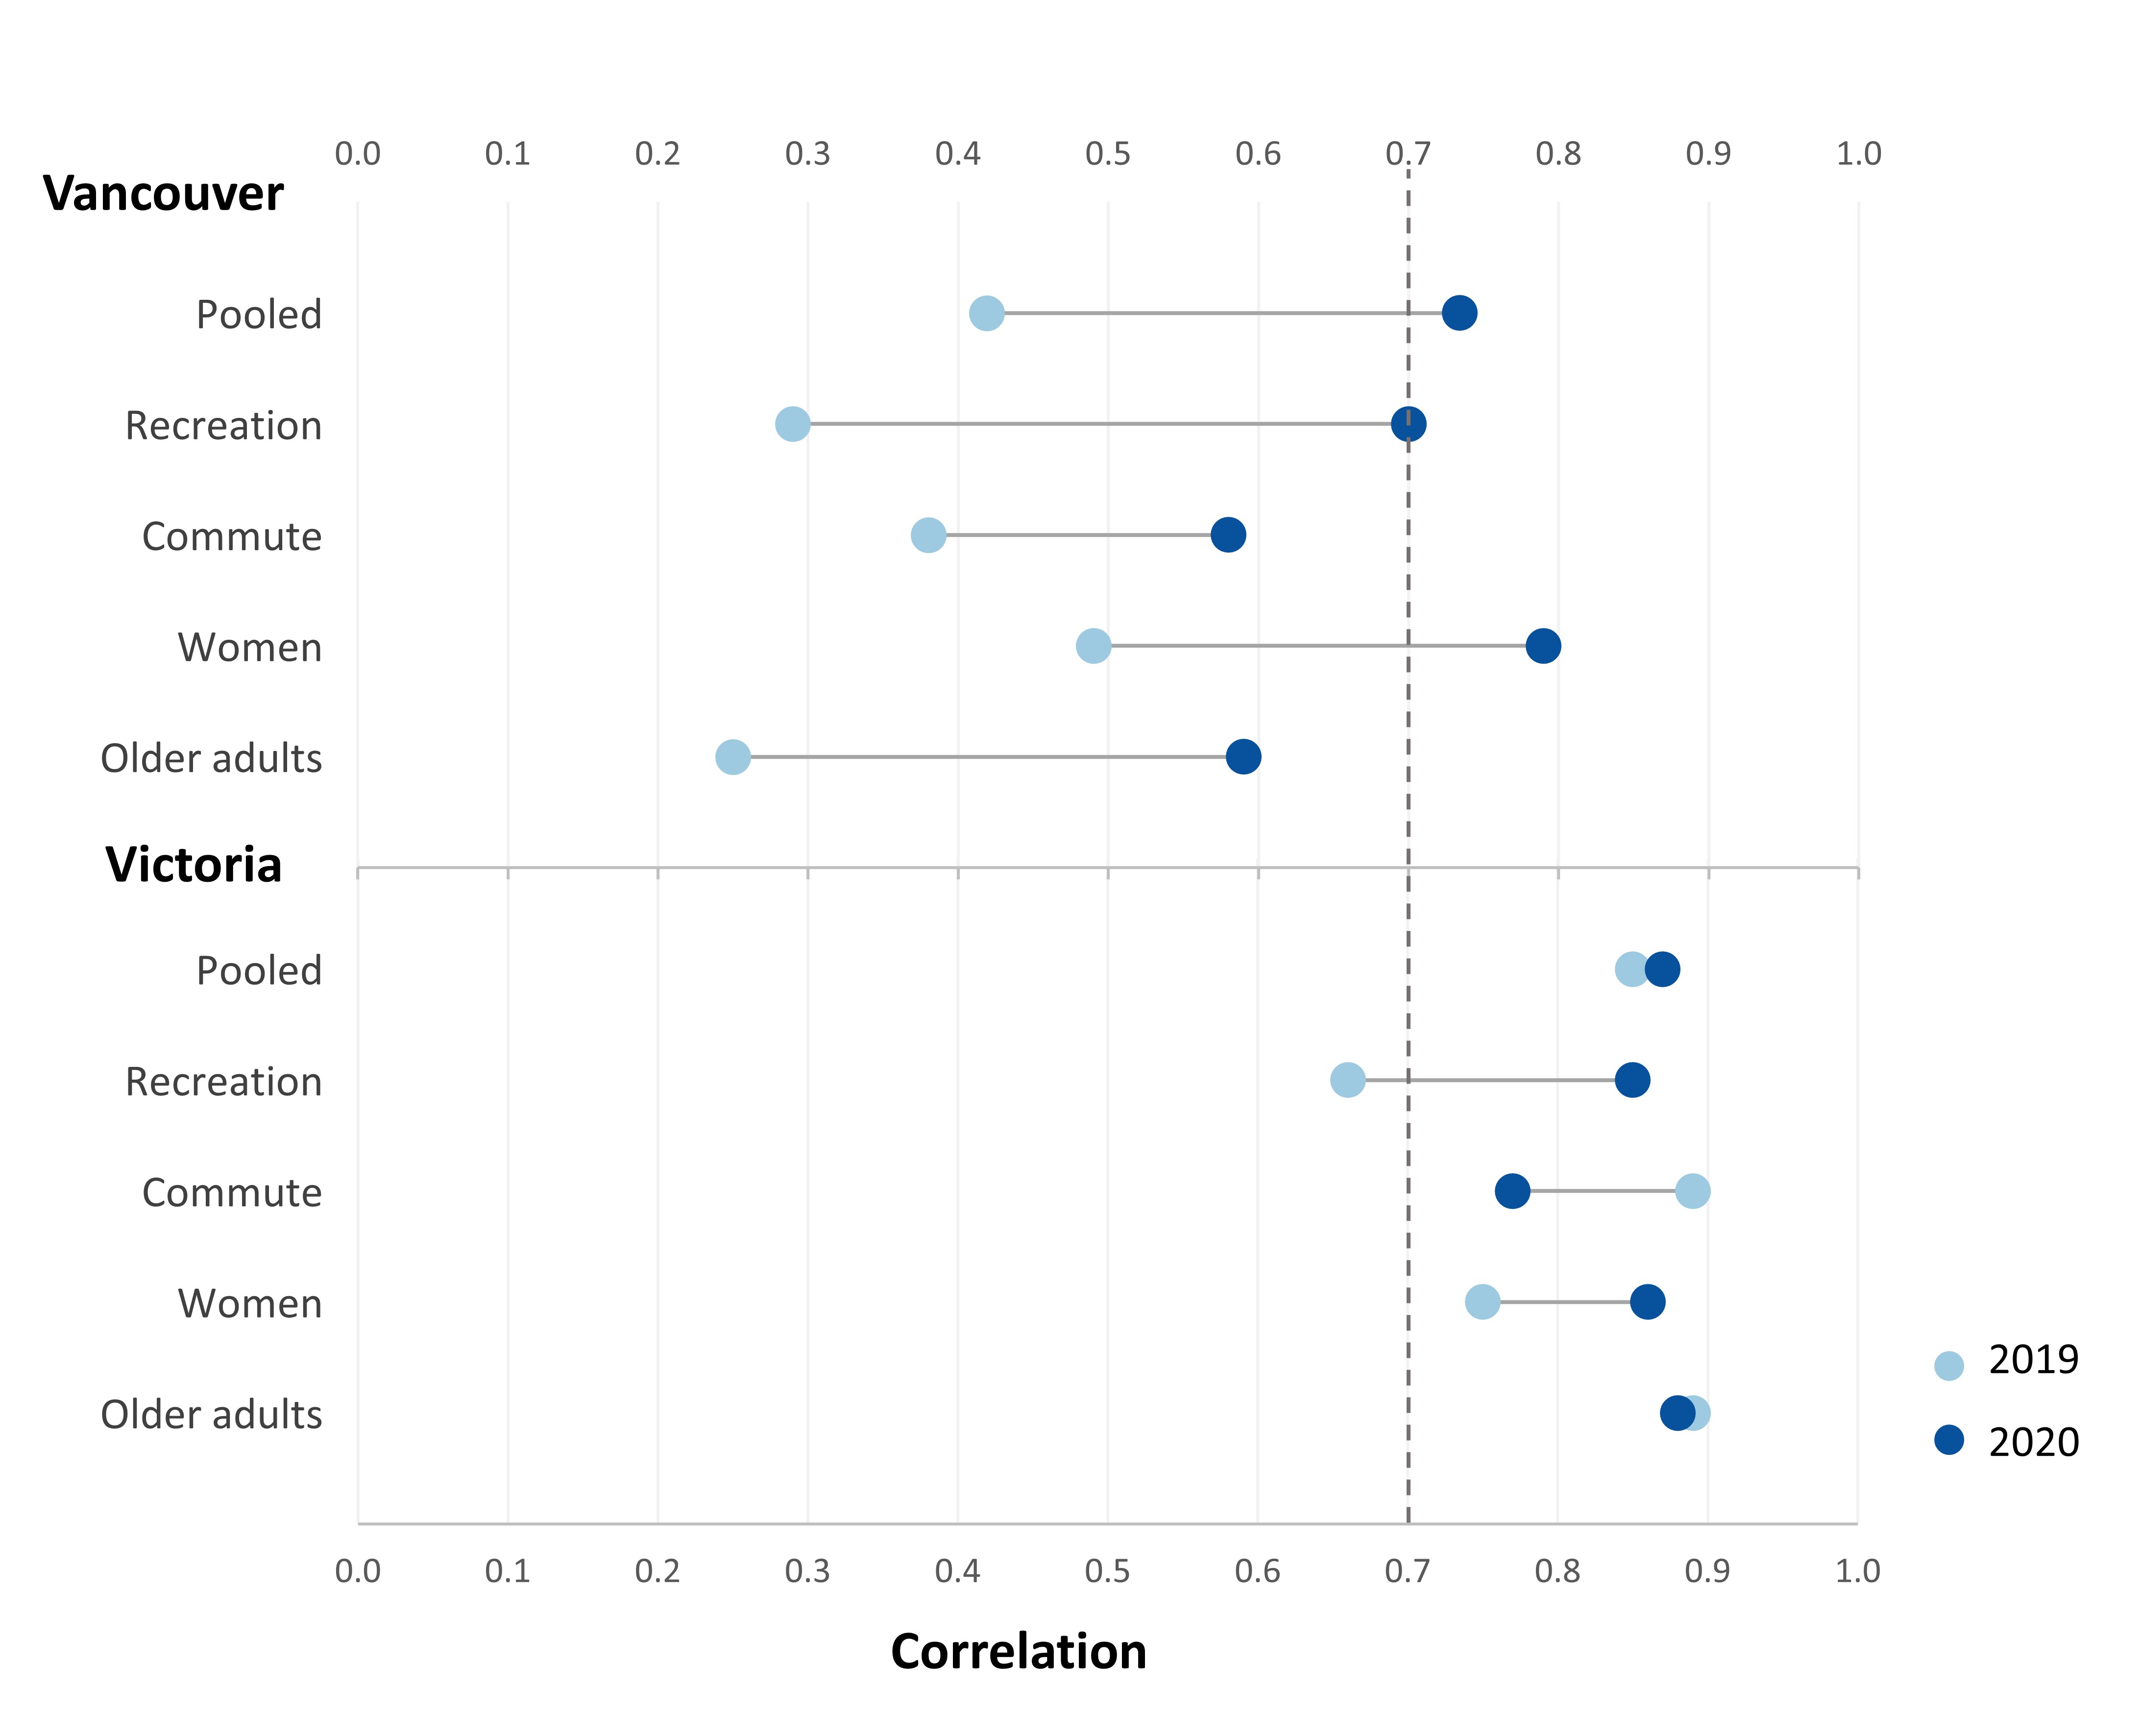
City-level Strava usage rates and correlations between Strava and counts of all bicyclists appear to be linked, with usage rates ~7-10% possibly corresponding to strong city-level correlation (R > = 0.7). To illustrate, the Strava usage rate rose from 5.7 to 12.1% in Vancouver and city-level correlation increased substantially, jumping from 0.42 in 2019 to 0.73 in 2020. Pre-COVID correlation was already strong in Victoria when the Strava usage rate was 7% (2019) and increased marginally in 2020 (0.85 to 0.87) even as the Strava usage rate exceeded 15%.
_between_strava_and_counts_of_all_bicyclists._the_dashed_.jpg)
Differences in correlation by trip purpose and demographics imply that subsets of Strava ridership may be more representative of the general bicycling population. In Vancouver, all Strava data subsets showed year-on-year increase in correlation with counts of all bicycling, and the strongest correlation overall was for the sample of Strava ridership generated by women (0.79). In Victoria the strongest correlation occurred in the sample of ridership generated by older adults (0.88). In both cities, large increases in correlation (28-140%) in the recreational ridership sample substantiate research demonstrating that bicycling for recreation increased dramatically when cities went into lockdown during the first wave of the pandemic (Buehler and Pucher 2021).
With higher city-level Strava usage rates, we also see stronger correlations in the data subsets for women and older adults, suggesting these higher usage rates may be indicative of better representation of women and older adults in the data. Bias in Strava data related to who is using the app impacts data reliability (Lee and Sener 2021). Our findings imply that age and gender bias in Strava app use may have decreased in these cities and that Strava data became more representative when app use surged in the first months of the pandemic. These findings also reflect how bicycling, especially for recreation, increased as cities went into pandemic lockdowns in 2020. Virtual connection, work from home, and policy that supports active transportation are likely to continue (van Wee and Witlox 2021), but the long-term effects of COVID-19 on bicycling and Strava use are still unknown. We expect at least some of the demographic shifts in Strava data to persist, but future studies would help clarify these uncertainties.
Through this analysis we show that Strava representativeness of the general bicycling population is dynamic and influenced by level of app use, which is influenced by external individual (Garber, Watkins, and Kramer 2019), social (Couture 2021), and environmental forces (e.g., pandemic lockdown measures and more recently, extreme weather events (Strava 2020, 2021)). With better representation of women and older adults in Strava data, planners and researchers might use these subsets more purposefully to advance active transportation equity goals as these are priority populations for increasing bicycling in Canada. As well, when enough women and older adults are using Strava they may be a subsample of Strava data that best represent population-level bicycling patterns. In both cities, increases in Strava app use corresponded with better representation (i.e., higher correlation) of the general bicycling population, but further gains may be marginal when the proportion of all bicycling trips logged by Strava reaches some threshold. For cities looking to increase Strava data representativeness we suggest a benchmark Strava usage rate of ≥ ~7%. This recommendation could be bolstered by additional studies in medium, small, and low bicycling cities. For cities looking to increase Strava usage rates, campaigns that encourage bicyclists to map their rides on Strava can increase app uptake (Boss et al. 2018).
Acknowledgements
The authors would like to acknowledge Strava for providing the data and timely review of our work and staff at the Capital Regional District and the City of Vancouver for providing us with official bicycle count data.