
1. Questions
In their seminal work “Reconsidering social equity in public transit”, Garrett and Taylor (1999) shed light on the inequities resulting from disproportionate investments in suburban rail transit as compared to local buses in the US. Similarly, the disproportionate negative impacts (namely traffic, air pollution, destruction of urban fabric) of highway development also end up falling upon poor and minority neighborhoods (Bullard and Johnson 1997), while subsidized investments in flow improvements inequitably benefit the wealthy (Manville and Goldman 2018). We add to this knowledge base by specifically investigating the potential mobility benefits of highway investments across income groups in the Canadian context. Can building more highways or enlarging existing ones be equally beneficial to all groups of society? Three known indicators and a new one capturing potential time savings together describe how lower income populations are less likely to benefit from these investments.
Some empirical, theoretical, and pragmatic evidence does suggest that these inequities exist (Bullard, Johnson, and Torres 2004; Lucas 2004). Save for Manville and Goldman (2018) who characterized peak-hour drivers in the ten most congested areas in the US, there is little quantitative work explicitly analyzing the impacts of highway investments from a travel behavior perspective, especially in the Canadian context. To date, most equity studies have focused on which population groups are more likely to benefit from a specific infrastructure based on the neighborhoods it serves. The idea here is to assess the equity implications of investing in highway development, considering trends in travel behavior across income groups.
Highway building and expansion has been, in much of North America, and for the greater part of the last century, a tool for economic development and a political instrument to ensure favorable election outcomes. When fungible transport budgets favor roadways over transit, we expect greater improvements in mobility conditions of high-income populations relative to those of low-income populations.
2. Methods
We used the 2013 Origin Destination (O-D) travel survey of the Montreal metropolitan region (MMR), augmented by restricted access files that include household income. Four categories of income are included. The lowest income group is defined by a household income of less than CAD $30,000. Because many respondents do not answer the income question, we focus on the survey subset of respondents for which this information was available. Analyses of 341,026 trips made during the survey day used agency-provided weights to represent the MMR populations’ travel. We explore income group distribution, shares of car trips as drivers or passengers, and time of day where trips are taken. Chi-square tests are reported when relevant.
The Montreal area transit agencies and the Ministry of Transport extensively use this survey to model travel behaviors, produce population level estimates, make projections of travel demand, and develop ancillary measures to augment reported data. Traffic flow model of the Ministry of Transport (MOTREM13) simulate vehicle trips using the 2013 O-D survey. The model provides travel distances and travel times for the peak AM congested period and for a free flow situation. As in Lachapelle, Boisjoly, and Vermesch (2020), we calculated a ratio between the latter two as an indicator of the time savings that flow improvements would provide. We descriptively compare these trip-level continuous measures by income groups. One-way ANOVA tests are reported, and Tukey post-hoc tests compare the lowest income group to the second income category.
3. Findings
Large investments in roadways to reduce traffic congestion may lead to inequitable benefits due to the coexistence of four major factors.
1. Fewer low-income workers and low-income travelers in general travel by car
Based on Table 1, 13.9% of trips are taken by low-income travelers, but only 50.4% of these trips are made using a car (compared to 69% for the entire sample, 75.3% for the wealthiest group). The difference is similar when focusing only on work trips. Inversely, transit ridership is proportionally higher for members of low-income groups (not shown). Investments in roadway improvements thus proportionally benefit fewer lower income individuals.
2. Fewer low-income workers travel during peak periods
Because low-income workers often work shifts that begin or end outside of peak periods, fewer of their trips occur during the congested periods that highway expansion or development seek to address (Table 2). People with early morning, mid-day or late-night shifts stand to gain less from these investments when using these roads.
3. Trip distances are typically lower for low-income car drivers, which also reduces their average exposure time to congested driving
Travel distances of low-income workers are generally shorter as they tend to work near their place of employment and make fewer discretionary trips to farther destinations. Figure 1 shows that low-income car drivers travel shorter distances by car during the morning peak period. Highest income car drivers travel on average distances that are nearly 60% greater (median of 5.3 vs. 8.4 km). Based on this OD survey data, 43.3% of low-income respondents of the MMR live in suburban areas (Lachapelle, Boisjoly, and Vermesch 2020). This contrasts with US cities where poverty is concentrated in central, more congested areas. Even when living in suburban neighborhoods, lower income travelers still tend to travel shorter distances.
__.jpg)
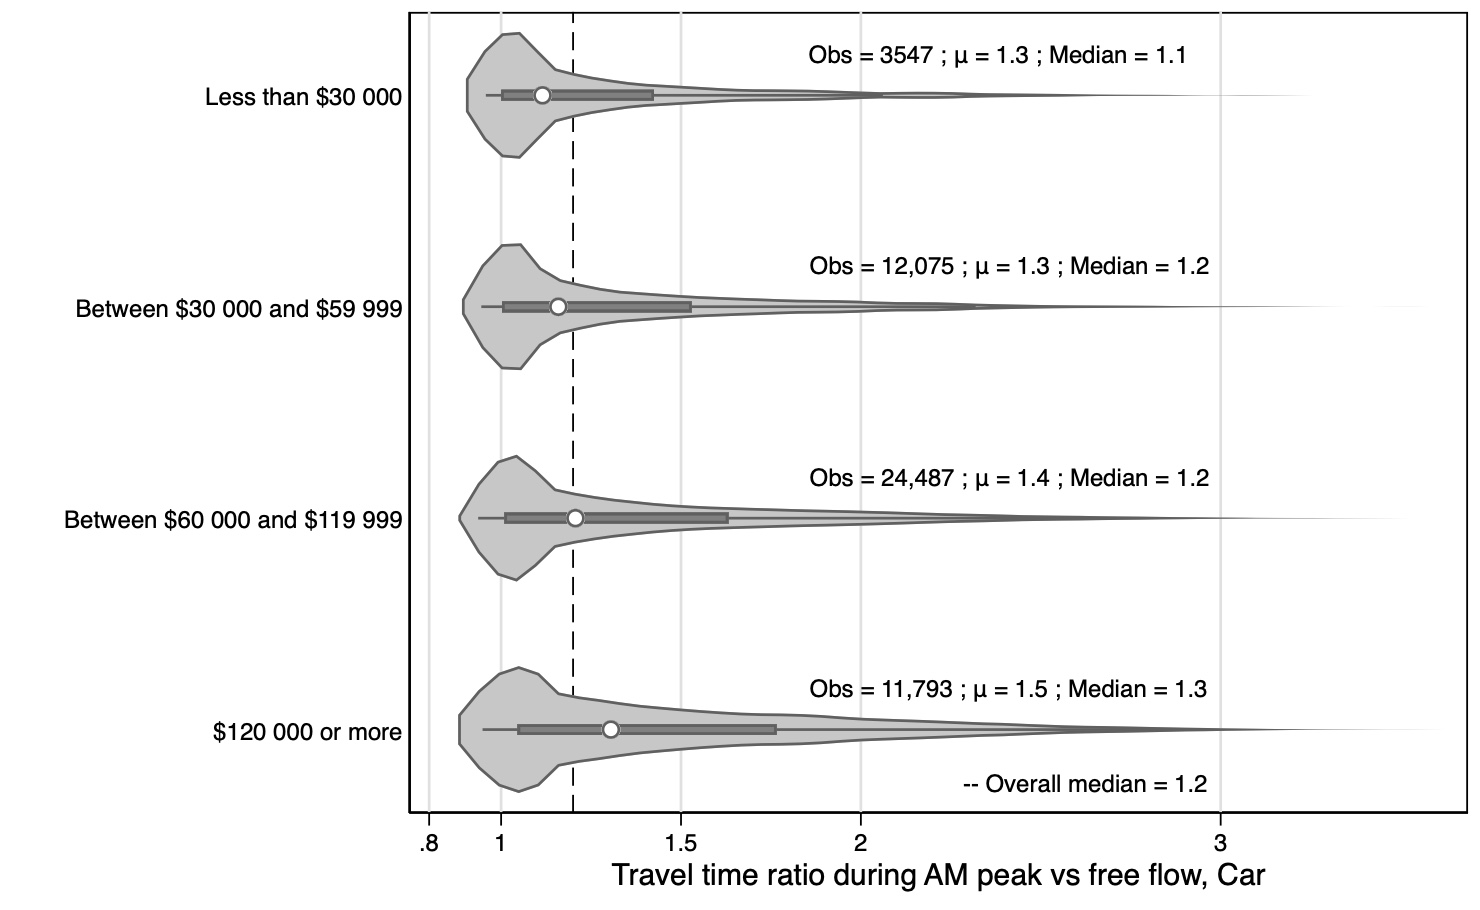
4. Travel time differences between peak traffic and free flow conditions are lower for low-income car drivers
Improvements in travel time due to congestion mitigation (new or expanded highways) thus likely generate fewer benefits for low-income households due to reduced exposure to traffic (less gains in speed or reductions in travel time).
Figure 2 shows that those low-income car drivers travelling during the morning peaks have a smaller difference (ratio) between travel time in peak traffic and estimated free flow speed conditions (means of 1.3 times free flow). This is likely because they travel shorter distances in congested conditions to access their destination. In comparison, higher income drivers, in greater numbers, have a mean ratio of 1.5). Improvements leading to speeds nearing free flow conditions would thus provide greater benefits to more numerous higher income drivers that drive longer distances.

While multiple reasons have been presented to avoid or reconsider major roadway expansion, including for environmental or urban planning motives, inequities resulting from these investments have rarely been documented. We presented four major arguments with their accompanying indicators to describe these inequities and their implications. Some low-income travelers will accrue benefits, but in significantly lower proportion than higher income ones.
This inequity problem is particularly important when transportation budgets are modally fungible, and subject to political interference, so that an investment in one mode may reduce investments in other modes. Such is the case in Québec, Canada. Government investments in roads can in such circumstances be unavailable for transit expansion, thus increasing imbalances. Furthermore, such imbalances can perpetuate forced car ownership for low-income populations over the long run. Fixing inequity by improving access to cars for low-income travelers might improve the situation in the short term, but will perpetuate car-based urban development and resulting inequities. Ensuring separate envelopes for both modes and exposing income imbalances in benefits of investments are important starting points towards more equitable transport investments.
Acknowledgements
We thank the City of Montreal and the Autorité Régionale de Transport Métropolitain (ARTM) for the research contract that inspired this short paper, and for providing us with access to income information as well detailed trip information produced by the ARTM and the Ministry of Transportation. Any error or omissions beyond the raw data is the full responsibility of the authors.