Loading [Contrib]/a11y/accessibility-menu.js
Findings
  • Menu
  • Articles
    • Resilience Findings
    • Transport Findings
    • Urban Findings
    • All
  • For Authors
  • Editorial Board
  • About
  • Blog
  • search

    Sorry, something went wrong. Please try your search again.
    ×

    • Articles
    • Blog posts

RSS Feed

Enter the URL below into your favorite RSS reader.

https://findingspress.org/feed
×
Transport Findings
March 09, 2022 AEST

Typologies of 20-Minute Neighbourhoods, Active Transport Use, and Spatial Spillovers

Liton Kamruzzaman,
20-minute neighbourhood Design Typology Distribution of Opportunities Street Patterns Active Transport Spatial Spillover Neighbourhood Effect
Copyright Logoccby-sa-4.0 • https://doi.org/10.32866/001c.33158
Photo by Annie Spratt on Unsplash
Findings
Kamruzzaman, Liton. 2022. “Typologies of 20-Minute Neighbourhoods, Active Transport Use, and Spatial Spillovers.” Findings, March. https://doi.org/10.32866/001c.33158.
Save article as...▾
  • PDF
  • XML
  • Citation (BibTeX)
Data Sets/Files (6)
Download all (6)
  • Table 1. Opportunity types considered to identify 20-minute neighbourhoods
    Download
  • Figure 1. Distribution of 20-minute neighbourhoods in Melbourne
    Download
  • Table 2. Indicators used to classify the 20-minute neighbourhoods
    Download
  • Figure 2. Typologies of 20-minute neighbourhoods in Melbourne
    Download
  • Table 3. Spatial autoregressive models showing the direct and spillover effects of the different typologies on 20-minute neighbourhoods on percent of people use active transport to work
    Download
  • Figure 3: Direct, indirect and total impacts of the different typologies of 20-minute neighbourhoods to promote active transport use compared to non-20-minute neighbourhoods in Melbourne
    Download

Sorry, something went wrong. Please try again.

If this problem reoccurs, please contact Scholastica Support

Error message:

undefined
×

View more stats

Abstract

20-minute neighbourhoods aim to promote active transport (AT) use by providing amenities locally. Using compactness and directional distribution of amenities, threshold population, and street patterns, this study derives five different typologies of 20-minute neighbourhoods: 1) Isolated and circular; 2) Semi-compact and semi-linear; 3) Compact and linear; 4) Organic; and 5) Semi-compact and circular. Spatial autoregressive models show that all types of 20-minute neighbourhoods promote people to use AT to work. However, Typology 5 has the largest effects, directly encouraging 7% more people to use AT locally and indirectly leading 18% more people to use AT in the neighbouring areas.

1. Questions

The 20-minute neighbourhood is only a decade-long old planning concept (The Portland Plan 2012), but it received a renewed policy interests globally as a response to the COVID-19 related travel restrictions (Local Government Information Unit 2021; Moreno et al. 2021; Wu et al. 2021). As the name implies, residents living in a 20-minute neighbourhood should be able to perform their day-to-day tasks within a 20-minute return journey from home on foot (Victoria State Government 2017, 2019). This means that most of the basic goods and services should be located within an 800-metre from home to facilitate walking access. Apart from this overarching structural guidance, little knowledge exists about the detailed design principles of the concept to facilitate future planning and implementations. This study aims to address this gap in the literature. Two guiding research questions of the study are: a) What typologies/variations exist in the design of 20-minute neighbourhoods within the overarching structural guidance?, and b) How do these variations affect active transport use directly on the areas where they are located and indirectly on the neighbouring areas (also referred to as spillover or neighbourhood effect), if any – the ultimate goal of the concept? An answer to the questions will equip planners with alternative toolsets to overcome the one-size-fits-all approach and enable them to make an informed decision about the expected outcomes of their chosen decision.

Typology enables to identify neighbourhoods with a unique set of design characteristics (Kamruzzaman et al. 2014). The typologies then can be intervened with common strategies, for example, to improve performance or to design future adaptations (Zemp et al. 2011; Belzer and Autler 2002). Different approaches to typology development have been applied in the literature, which vary depending on the spatial scale of analysis. Nationally, urban centres are grouped into monocentric, polycentric, sprawl, and linear categories (Sapena and Ruiz 2021). Metropolitan areas are typically classified based on the well-known transect classification system (Duany 2002), which serves as an instrument for zoning and divides a metropolis into seven rural-to-urban continuums (special districts, urban core, urban centre, general urban, sub-urban, rural reserve, and rural preserve). Bertolini’s (1999) node-place framework has widely been applied to classify railway stations (Reusser et al. 2008; Zemp et al. 2011), and transit-oriented development patterns (Kamruzzaman et al. 2014; Vale 2015). Since the garden city concept, hundreds of neighbourhood types appeared in the literature with some overlapping design principles including neighbourhood unit, traditional neighbourhood development, planned unit development, transit-oriented development, new town, eco city, and redburn/superblock (Sharifi 2016; Rohe 2009; Bae 2007). However, researchers rarely attempted to classify the internal variations within these types. This study partly addresses this gap using the 20-minute neighbourhoods as a case.

2. Methods

Given the recency of the concept, there is no officially designated/designed 20-minute neighbourhoods that can be used as case studies for this research. As a result, I focused on existing statistical areas (SA1) of Greater Melbourne (9,209 in total by excluding those with a population of 10 persons or less) and identified the ones that evolved with the characteristics of a 20-minute neighbourhood. To do so, I mapped 21 different amenity types across Greater Melbourne as key defining features for a 20-minute neighbourhood (Table 1) (Shatu and Kamruzzaman 2021), and counted the types of amenities available within an 800m from the centre of each SA1. I made a standard deviation classification of the SA1s based on the types of amenities available and selected the SA1s that are two standard deviations away (positively) from the mean, which resulted in 478 SA1s that qualify for a 20-minute neighbourhood (Figure 1). The remaining SA1s are considered as non-20-minute neighbourhoods. To identify the typologies of the 20-minute neighbourhoods, I derived four design indicators as shown in Table 2. Given the categorical nature of the indicators, a two-step cluster analysis technique was employed to identify natural groupings among the 20-minute neighbourhoods.

To answer the second research question, I estimated six regression models using percent of people used active transport (walking and cycling) to work as dependent/outcome variable and typologies of 20-minute neighbourhoods as a factor variable. First, a multiple linear regression (MLR) model was estimated to identify if the typologies are associated with active transport use (Model 1). Second, I conducted Moran test, which showed that the residuals of the MLR model are correlated with nearby residuals (Chi2 15845.67 with p 0.001) – i.e. the observations are not independent. To address this neighbourhood effect, I estimated five spatial autoregressive (SAR) models, which extended the MLR model by allowing active transport use in one SA1 to be affected by the outcome/typologies/errors from nearby SA1 (Ferraresi, Galmarini, and Rizzo 2018). The five models are: Model 2: spatial lag of the outcome (active transport use); Model 3: spatial lag of the factor (typologies); Model 4: spatial lag of the outcome and factor; Model 5: spatially autoregressive errors; and Model 6: a combination of Models 2, 3 and 5. A spatial weight matrix was derived using spatial contiguity criterion (SA1s that share a border) capturing the extent to which individual neighbours mutually influence each other (spatial relationships) (Zangger 2019). Average marginal effects are estimated of the typologies to avoid misinterpretation of the model coefficients and also to distinguish between direct, indirect and total effects of the neighbourhood typologies (Fageda and Gonzalez-Aregall 2017). All models were estimated in Stata (version 16.0). The active transport use data were obtained from the 2016 census, Australian Bureau of Statistics.

Table 1.Opportunity types considered to identify 20-minute neighbourhoods
List Amenity Type Data Source Number of features
1 Aged care DATA VIC 560
2 ATM or Bank Open street map 790
3 Bar, pub and nightclub Open street map 730
4 Bus stop DATA VIC 18,485
5 Childcare centre PSAM, AURIN 3797
6 Community centre PSAM, AURIN 304
7 Dine in places (café, fast food, food court, restaurant) Open street map 5,782
8 Health facility including dental PSAM, AURIN 1,656
9 Kindergarten PSAM, AURIN 1,354
10 Library PSAM, AURIN 145
11 Maternal & child health centre PSAM, AURIN 121
12 Neighbourhood parks DATA VIC 13,459
13 Place of worship (church, mosque) PSAM, AURIN 1,452
14 Playground DATA VIC 3,559
15 Post office PSAM, AURIN 187
16 Pharmacy Open street map 449
17 Primary schools PSAM, AURIN 2,513
18 Secondary schools PSAM, AURIN 1,452
19 Shopping centre PSAM, AURIN 49
20 Train station DATA VIC 220
21 Tram stop DATA VIC 1,659
Figure 1
Figure 1.Distribution of 20-minute neighbourhoods in Melbourne
Table 2.Indicators used to classify the 20-minute neighbourhoods
Indicators Description Mean Standard deviation (SD) Classification Classification method
Concentration of amenities (metre) Standard distance of the amenities from the mean centre. A shorter distance represents that the amenities are more centred. 439.97 51.18 Compact =< -1SD
Semi-compact > -1SD & < +1SD
Dispersed >= +1SD
Directional distribution of the amenities Ratio of the minor over major axis of standard deviation ellipse of the amenities. A zero ratio represents that the amenities are located along a straight line whereas a ratio of 1 means that the amenities are distributed in a circular fashion. 0.73 0.13 Linear =< -1SD
Semi-linear > -1SD & < +1SD
Circular >= +1SD
Threshold population (person per amenities) Total population within the 800m network buffer from the centre of the SA1s is divided by the number of amenities located within the buffer. Total population was calculated using the proportionate method based on the SA1 population. 63.34 23.78 Dependent on neighbouring SA1 =< -1SD
Adequate > -1SD & < +1SD
Over populated >= +1SD
Street network patterns Derived based on combinations of intersection and cul-de-sac densities – these were respectively calculated as the number of 3 (or more) way intersections and dead-ends divided by the buffer area of the SA1s. Intersection and cul-de-sac densities were classified as low (=< -1SD), moderate (> -1SD & < +1SD) and high (>= +1SD). 1.28 interse-ction per hectare 0.44 Organic (Int-den = low & cul-den = moderate) or (Int-den = low & cul-den = high) or (Int-den = moderate & cul-den = high)
0.25 dead-ends per hectare 0.21 Semi-grid (Int-den = low & cul-den = low) or (Int-den = moderate & cul-den = moderate) or (Int-den = high & cul- den = high)
Complete grid (Int-den = high & cul-den = low) or (Int-den = high & cul-den = moderate) or (Int-den = moderate & cul-den = low)

Key: SD = standard deviation, Int-den = intersection density, Cul-den = cul-de-sac density

3. Findings

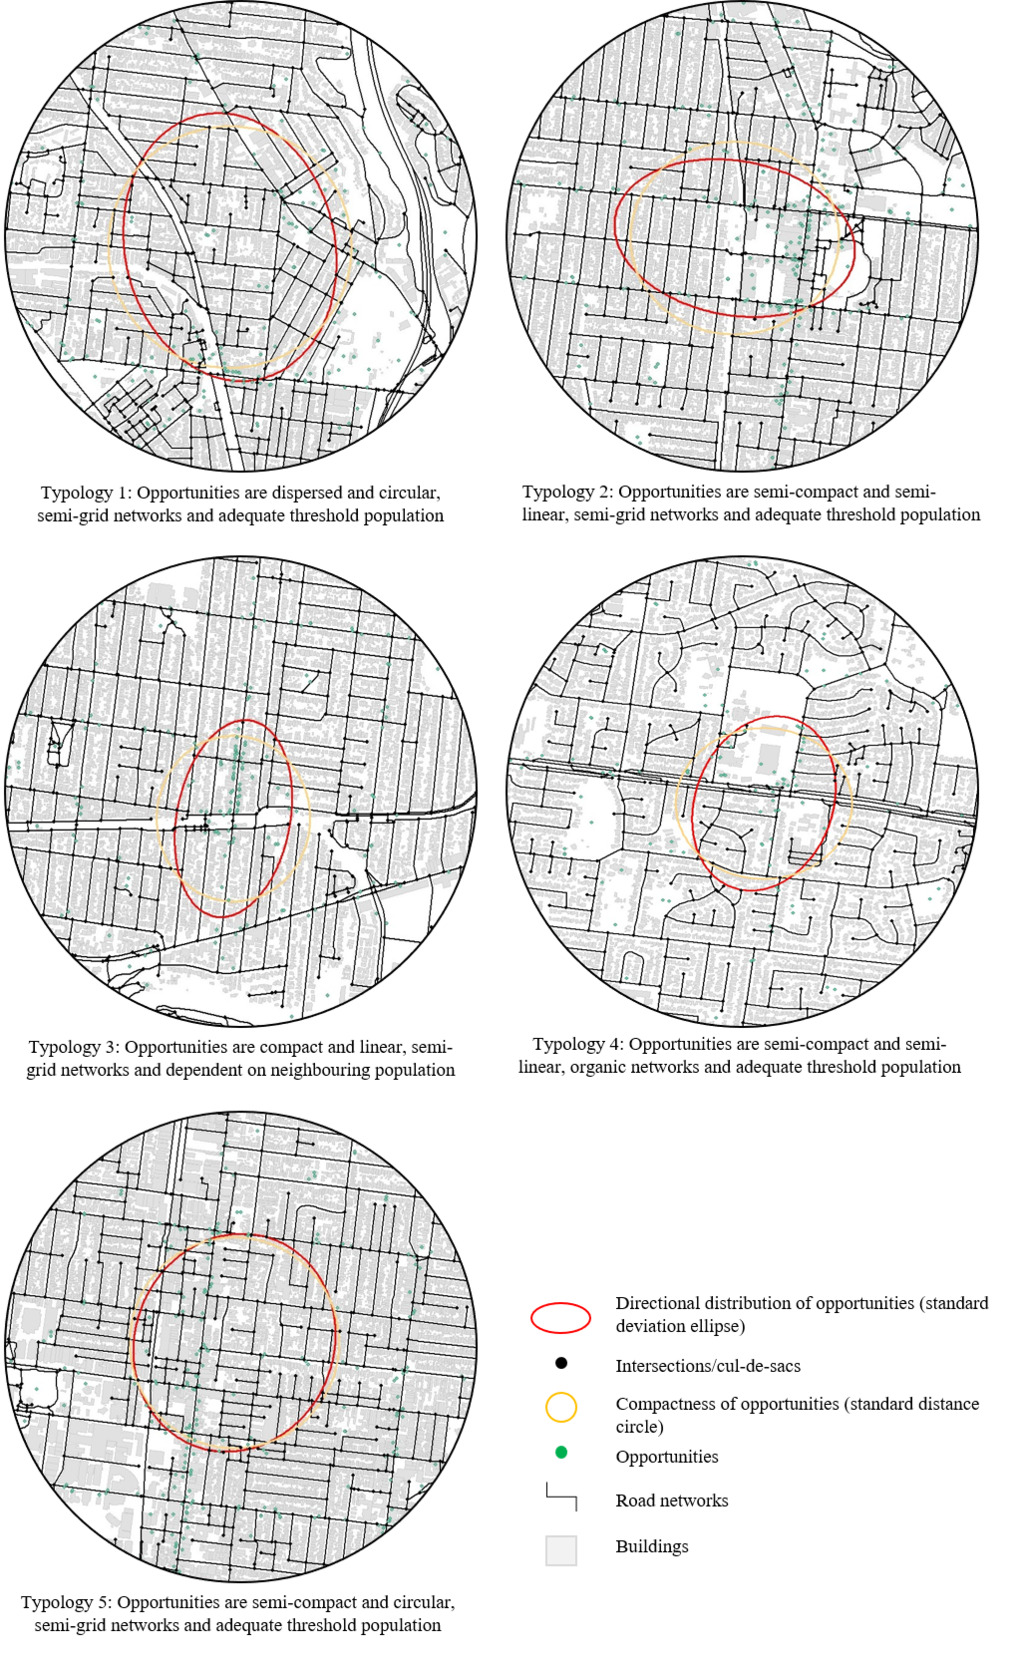
The cluster analysis resulted in a 5-cluster solution (Figure 2). These five clusters can be labelled and characterised as:

  • a) Cluster 1 — Isolated and circular 20-minute neighbourhoods: Amenities are dispersed (i.e. relatively longer distances between them) and are distributed in a circular fashion overall. These 20-minute neighbourhoods have semi-grid street patterns and have adequate threshold population to support the amenities. About 16% of the 20-minute neighbourhoods belong to this type;
  • b) Cluster 2 — Semi-compact and semi-linear 20-minute neighbourhoods: Amenities are semi-compact (i.e. relatively shorter distances between them) and are distributed in a semi-linear fashion overall. They have similar street pattern and threshold population to that Cluster 1. The highest proportion of 20-minute neighbourhoods in Melbourne falls into this category (33%);
  • c) Cluster 3 — Compact and linear 20-minute neighbourhoods: Amenities are located close by (i.e. the shortest distance between them) and are distributed in a linear fashion overall. They have similar street pattern like Cluster 1 and 2, but they depend on neighbouring SA1s to meet the threshold. 18% of the 20-minute neighbourhoods belong to Cluster 3;
  • d) Cluster 4 — Organic 20-minute neighbourhoods: This cluster possesses the characteristics of Cluster 2 except that these 20-minute neighbourhoods have organic street pattern; and
  • e) Cluster 5 — Semi-compact and circular 20-minute neighbourhoods: This cluster possesses the characteristics of Cluster 1 or 2 except that Cluster 1 is isolated and Cluster 2 is semi-linear. Only 14% neighbourhoods fall into this category.
Figure 2
Figure 2.Typologies of 20-minute neighbourhoods in Melbourne

On average, 19% commuters used active transport to work in 20-minute neighbourhoods compared to only 3.8% in non-20-minute neighbourhoods. Table 3 shows the estimates obtained from the 6 models. Model 1 shows that all five typologies are associated with increased active transport use compared to non-20-minute neighbourhoods. However, Model 2 shows that the spatial lag of the dependent variable is statistically significant, and as expected, the coefficients drop markedly for the different typologies. The overall explanatory power increased from 0.18 in Model 1 to 0.48 in Model 2. The inclusion of other factors (spatial lags) did not improve the explanatory powers of the remaining 4 models. As a result, Model 2 was selected as the operational model in this study. From Model 2, one might be tempted to think, for example that, 2.53% as the direct effect of Typology 1 and 0.92% as the spillover effect, but they are not. They are ingredients into a recursive calculation of those effects. If a neighbourhood changes from a non-20-minute neighbourhood to Typology 1, that increases active transport use by 2.53%, and that increase spills over to produce a further increase in active transport use of 0.89%, and that increase spills over to produce yet another increase in active transport use, and so on. The marginal effects show the average effects from these recursive process (Figure 3).

Table 3.Spatial autoregressive models showing the direct and spillover effects of the different typologies on 20-minute neighbourhoods on percent of people use active transport to work
Explanatory factors Outcome variable: % of people use active transport to work
Model 1: Linear regression Model 2: Spatial lag of dependent variable Model 3:
Spatial lag of Independent variable
Model 4: Spatial lag of dependent and independent variable Model 5: Spatially autoregressive errors Model 6: All spatial lags
Coefficient Coefficient Coefficient Coefficient Coefficient Coefficient
Direct effect
Typologies (ref: non-20-minute neighbourhood)
Typology 1: 15.29** 2.53** 1.10 2.94** 3.87** 2.93**
Typology 2: 17.64** 4.64** 3.30** 5.27** 6.16** 4.94**
Typology 3: 8.44** 2.09** 0.77 2.53** 3.02** 2.27**
Typology 4: 10.36** 2.11** 0.83 2.31** 2.92** 2.06**
Typology 5 19.90** 5.78** 5.27** 6.42** 7.41** 6.18**
Constant 3.72** 0.92** 3.20** 0.82** 3.66** 0.53**
Spatial lag (spillover /indirect) effect
Typologies (ref: non-20-minute neighbourhood)
Typology 1: - - 23.99** 0.04 - -1.84*
Typology 2: - - 27.81** -3.05** - -2.94**
Typology 3: - - 13.98** -1.50 - -0.85
Typology 4: - - 20.40** -1.01 - -0.80
Typology 5 - - 40.36** -4.51** - -6.71**
Active transport use - 0.89** - 0.93** - 0.98**
Spatially autoregressive errors - - - - 0.93** -0.68**
N 9,209 9,209 9,209 9,209 9,209 9,209
Wald Chi2 - 13935.45** 3979.86** 17134.45** 365.25** 49263.98**
Wald test of spatial terms (Chi2) - 7770.08** 1511.43** 10916.38** 33265.75** 30659.79**
(Pseudo) R2 0.19 0.48 0.30 0.48 0.18 0.49

* Coefficients are significant at the 0.1 level
** Coefficients are significant at the 0.05 level
- Variables not included in the model

Figure 3 shows that all types of 20-minute neighbourhoods have the potential to increase active transport use both directly on the areas in which they are located and indirectly on neighbouring SA1s. It is also noticeable from Figure 3 that the spillover effects are larger than the direct effects. Both direct and indirect effects, however, vary between different types of 20-minute neighbourhoods. Figure 3 shows that switching from a non-20-minute to Typologies 3 and 4 will have a similar rate of increase in active transport use despite the differences in design principles between them. A conversion to Typology 5, however, will have the greatest effects in active transport use both directly (7%) and indirectly (19%), followed by Typology 2 (5% and 15% respectively) and Typology 1 (3% and 8% respectively). Overall, the findings suggest that although a 20-minutes neighbourhood can be designed in various ways to promote active transport use, preference should be given to Typology 5 to maximise the benefits.

Figure 3
Figure 3:Direct, indirect and total impacts of the different typologies of 20-minute neighbourhoods to promote active transport use compared to non-20-minute neighbourhoods in Melbourne

Submitted: December 16, 2021 AEST

Accepted: March 04, 2022 AEST

References

Bae, Kim Kyung. 2007. “Sustainable Neighbourhood Design (SND): Critical Analysis on the Key Concepts of Global Eco-Village, Urban Village and New Urbanism Movement.” Seoul Studies 8 (1): 69–83.
Google Scholar
Belzer, Dena, and Gerald Autler. 2002. “Transit Oriented Development: Moving from Rhetoric to Reality.” The Brookings Institution Center on Urban and Metropolitan Policy and The Great American Station Foundation.
Bertolini, L. 1999. “Spatial Development Patterns and Public Transport: The Application of an Analytical Model in the Netherlands.” Planning Practice & Research 14 (2): 199–210.
Google Scholar
Duany, Andrés. 2002. “Introduction to the Special Issue: The Transect.” Journal of Urban Design 7 (3): 251–60. https://doi.org/10.1080/1357480022000039321.
Google Scholar
Fageda, Xavier, and Marta Gonzalez-Aregall. 2017. “Do All Transport Modes Impact on Industrial Employment? Empirical Evidence from the Spanish Regions.” Transport Policy 55: 70–78. https://doi.org/10.1016/j.tranpol.2016.12.008.
Google Scholar
Ferraresi, Massimiliano, Umberto Galmarini, and Leonzio Rizzo. 2018. “Infrastructure Spillovers and Strategic Interaction: Does the Size Matter?” International Tax and Public Finance 25 (1): 240–72. https://doi.org/10.1007/s10797-017-9449-0.
Google Scholar
Kamruzzaman, M., D. Baker, S. Washington, and G. Turrell. 2014. “Advance Transit Oriented Development Typology: Case Study in Brisbane, Australia.” Journal of Transport Geography 34: 54–70. https://doi.org/10.1016/j.jtrangeo.2013.11.002.
Google Scholar
Local Government Information Unit. 2021. “Perspectives on the 20-Minute Neighbourhood - Progress around the World.” https://lgiu.org/perspectives-on-the-20-minute-neighbourhood-progress-around-the-world/.
Moreno, Carlos, Zaheer Allam, Didier Chabaud, Catherine Gall, and Florent Pratlong. 2021. “Introducing the ‘15-Minute City’: Sustainability, Resilience and Place Identity in Future Post-Pandemic Cities.” Smart Cities 4 (1): 93–111.
Google Scholar
Reusser, Dominik E., Peter Loukopoulos, Michael Stauffacher, and Roland W. Scholz. 2008. “Classifying Railway Stations for Sustainable Transitions – Balancing Node and Place Functions.” Journal of Transport Geography 16 (3): 191–202. https://doi.org/10.1016/j.jtrangeo.2007.05.004.
Google Scholar
Rohe, William M. 2009. “From Local to Global: One Hundred Years of Neighborhood Planning.” Journal of the American Planning Association 75 (2): 209–30. https://doi.org/10.1080/01944360902751077.
Google Scholar
Sapena, Marta, and Luis A. Ruiz. 2021. “Identifying Urban Growth Patterns through Land-Use/Land-Cover Spatio-Temporal Metrics: Simulation and Analysis.” International Journal of Geographical Information Science 35 (2): 375–96. https://doi.org/10.1080/13658816.2020.1817463.
Google Scholar
Sharifi, Ayyoob. 2016. “From Garden City to Eco-Urbanism: The Quest for Sustainable Neighborhood Development.” Sustainable Cities and Society 20: 1–16. https://doi.org/10.1016/j.scs.2015.09.002.
Google Scholar
Shatu, Farjana, and Md Kamruzzaman. 2021. “Determining Optimum Design Density for 20-Minute Neighbourhoods.” Findings, 27391.
Google Scholar
The Portland Plan. 2012. https://www.pdxplan.com.
Vale, David S. 2015. “Transit-Oriented Development, Integration of Land Use and Transport, and Pedestrian Accessibility: Combining Node-Place Model with Pedestrian Shed Ratio to Evaluate and Classify Station Areas in Lisbon.” Journal of Transport Geography 45: 70–80.
Google Scholar
Victoria State Government. 2017. “Plan Melbourne 2017-2050: Metropolitan Planning Strategy.” Melbourne: Department of Environment, Land, Water and Planning.
———. 2019. “20-Minute Neighbourhoods: Creating a More Liveable Melbourne.” Melbourne: Department of Environment, Land, Water and Planning.
Wu, Hao, Paolo Avner, Genevieve Boisjoly, Carlos K. V. Braga, Ahmed El-Geneidy, Jie Huang, Tamara Kerzhner, et al. 2021. “Urban Access Across the Globe: An International Comparison of Different Transport Modes.” npj Urban Sustainability 1 (1): 16. https://doi.org/10.1038/s42949-021-00020-2.
Google Scholar
Zangger, Christoph. 2019. “Making a Place for Space: Using Spatial Econometrics to Model Neighborhood Effects.” Journal of Urban Affairs 41 (8): 1055–80. https://doi.org/10.1080/07352166.2019.1584530.
Google Scholar
Zemp, Stefan, Michael Stauffacher, Daniel J. Lang, and Roland W. Scholz. 2011. “Classifying Railway Stations for Strategic Transport and Land Use Planning: Context Matters!” Journal of Transport Geography 19 (4): 670–79. https://doi.org/10.1016/j.jtrangeo.2010.08.008.
Google Scholar

Powered by Scholastica, the modern academic journal management system