
1. Questions
We examine how land use measures can be used to site hypothetical bikeshare stations and how measures of the fraction of residents within 5- and 10-minute travel from transit can be used as a measure of bikeshare effectiveness.
2. Methods
As our study area, we selected 114 census block groups in the unincorporated areas of East Los Angeles and Maywood (population = 159,243, Figure 1). We divided the study area into 300x300m cells. Within each cell, we selected a single location for a hypothetical docked bikeshare station using a framework adapted from analysis of the CitiBike bikeshare in Brooklyn, New York. We chose CitiBike to develop our siting method because it is a mature bikeshare system with several locations in residential neighborhoods and with ridership information available via open data. The CitiBike Brooklyn neighborhoods have a census tract population density of 21,456 – 47,287 persons/mi2 compared to similar population densities in East Los Angeles and Maywood of 16,983 and 23,255 persons/mi2, respectively.

We regress CitiBike station bikeshare rides on variables that measure population density, bike lanes, and distance to transit, and we use the results to site locations for East Los Angeles/Maywood bikeshare stations. We then use changes in East Los Angeles/Maywood population within 5- and 10-minutes of frequent transit (≤10-minute morning peak headway) as a measure of bikeshare impact. Prior research indicates one free-floating bikeshare ride correlates with 0.54 additional transit trip during peak hours (Ma et al. 2019), suggesting transit accessibility as a performance indicator for bikeshare. We note that our use of total bikeshare trips to model access to transit is a limitation, but data on bikeshare to transit was unavailable.
Brooklyn CitiBike Analysis: We pulled October 2019 data on bikeshare trips from CitiBike (2019) for the 178 CitiBike stations in Brooklyn, bounded by the borders of 15th Street on the South, the waterfront on the West and North sides, and Bedford Avenue on the East side. The variables to predict CitiBike bikeshare trips, and then site stations in our East Los Angeles/Maywood case study, are:
-
Population (P):, Population in 300m radius areas around each bikeshare station based on 2013-2018 American Community Survey (ACS) average. Census data cover an area larger than the 300m buffer; hence we multiply census block group population by the ratio of (interior space in residential buildings within 300m of a bikeshare station) divided by (interior space in residential buildings within the block group), both from Open Street Map data.
-
Bike Lane Network Length (B): The total length of bicycle lanes in meters within a 300m radius of the bikeshare station.
-
Distance to transit (T): Straight line distance between the bike station and the closest subway station, in meters.
We ran a multivariate regression with bikeshare trips per month at a docked station as the dependent variable (Table 1).
The results (column “full model”) imply that moving a bikeshare station 100 meters closer to a transit station is associated with 94 more monthly bikeshare trips, and that within 300 meters of bikeshare 100 meters more of bike lane length is associated with 47.6 more bikeshare trips and 100 more persons is associated with 14.6 fewer bikeshare trips. That last result is counterintuitive. In Brooklyn, bikeshare locations with higher population within 300 meters also have higher fractions of residents who are African-American (r = 0.416), and African-Americans are under-represented among CitiBike riders (McNeil et al. 2017, Table 4-1). We conduct a robustness test using a siting regression that omits population, P, with coefficients shown in the “reduced model” column of Table 1, and we find that our results, described below, are robust to excluding P in the siting analysis.
Siting Bikeshare in East Los Angeles/Maywood: Within each 300x300m grid cell in East Los Angeles/Maywood, we scored possible docked bikeshare locations at 50m intervals on the street network. The 50m intervals start at the point within a grid cell nearest the beginning of the road in Los Angeles County GIS files, and then every 50m thereafter along the road’s path. Each 50m point is scored with a value that is the predicted value from the multivariate regression in Table 1 (“full model”), forming the independent variables in the same way (for surrounding 300m radius areas) as for Brooklyn. We then chose the top scoring location in the 300m grid cell as the bikeshare site. Distance to transit is distance to the nearest bus stop or light rail stop with morning peak headway ≤ 10 minutes. Data for the frequency of transit service for February 2020 was obtained from Los Angeles Metro (2020), and data for proposed bike lanes was from the Southern California Association of Governments (2020) Regional Bike Lane Master Plan. East Los Angeles/Maywood lacks an existing bike lane network, hence we used the SCAG (2020) planned bike lane network to measure B.
This yielded 355 possible bikeshare locations, one in each of the 300x300m grid cells. We combined any two bikeshare locations that were closer than 50m to each other, which was common around transit hubs, taking the centroid between those two stations and realigning that with the road network. Finally, we removed stations that were in 300x300m grid cells with no resident population. These steps left us with 296 locations. The 74 locations in the top 25th percentile of predicted values are a realistic system size given other cities experiences.[1]
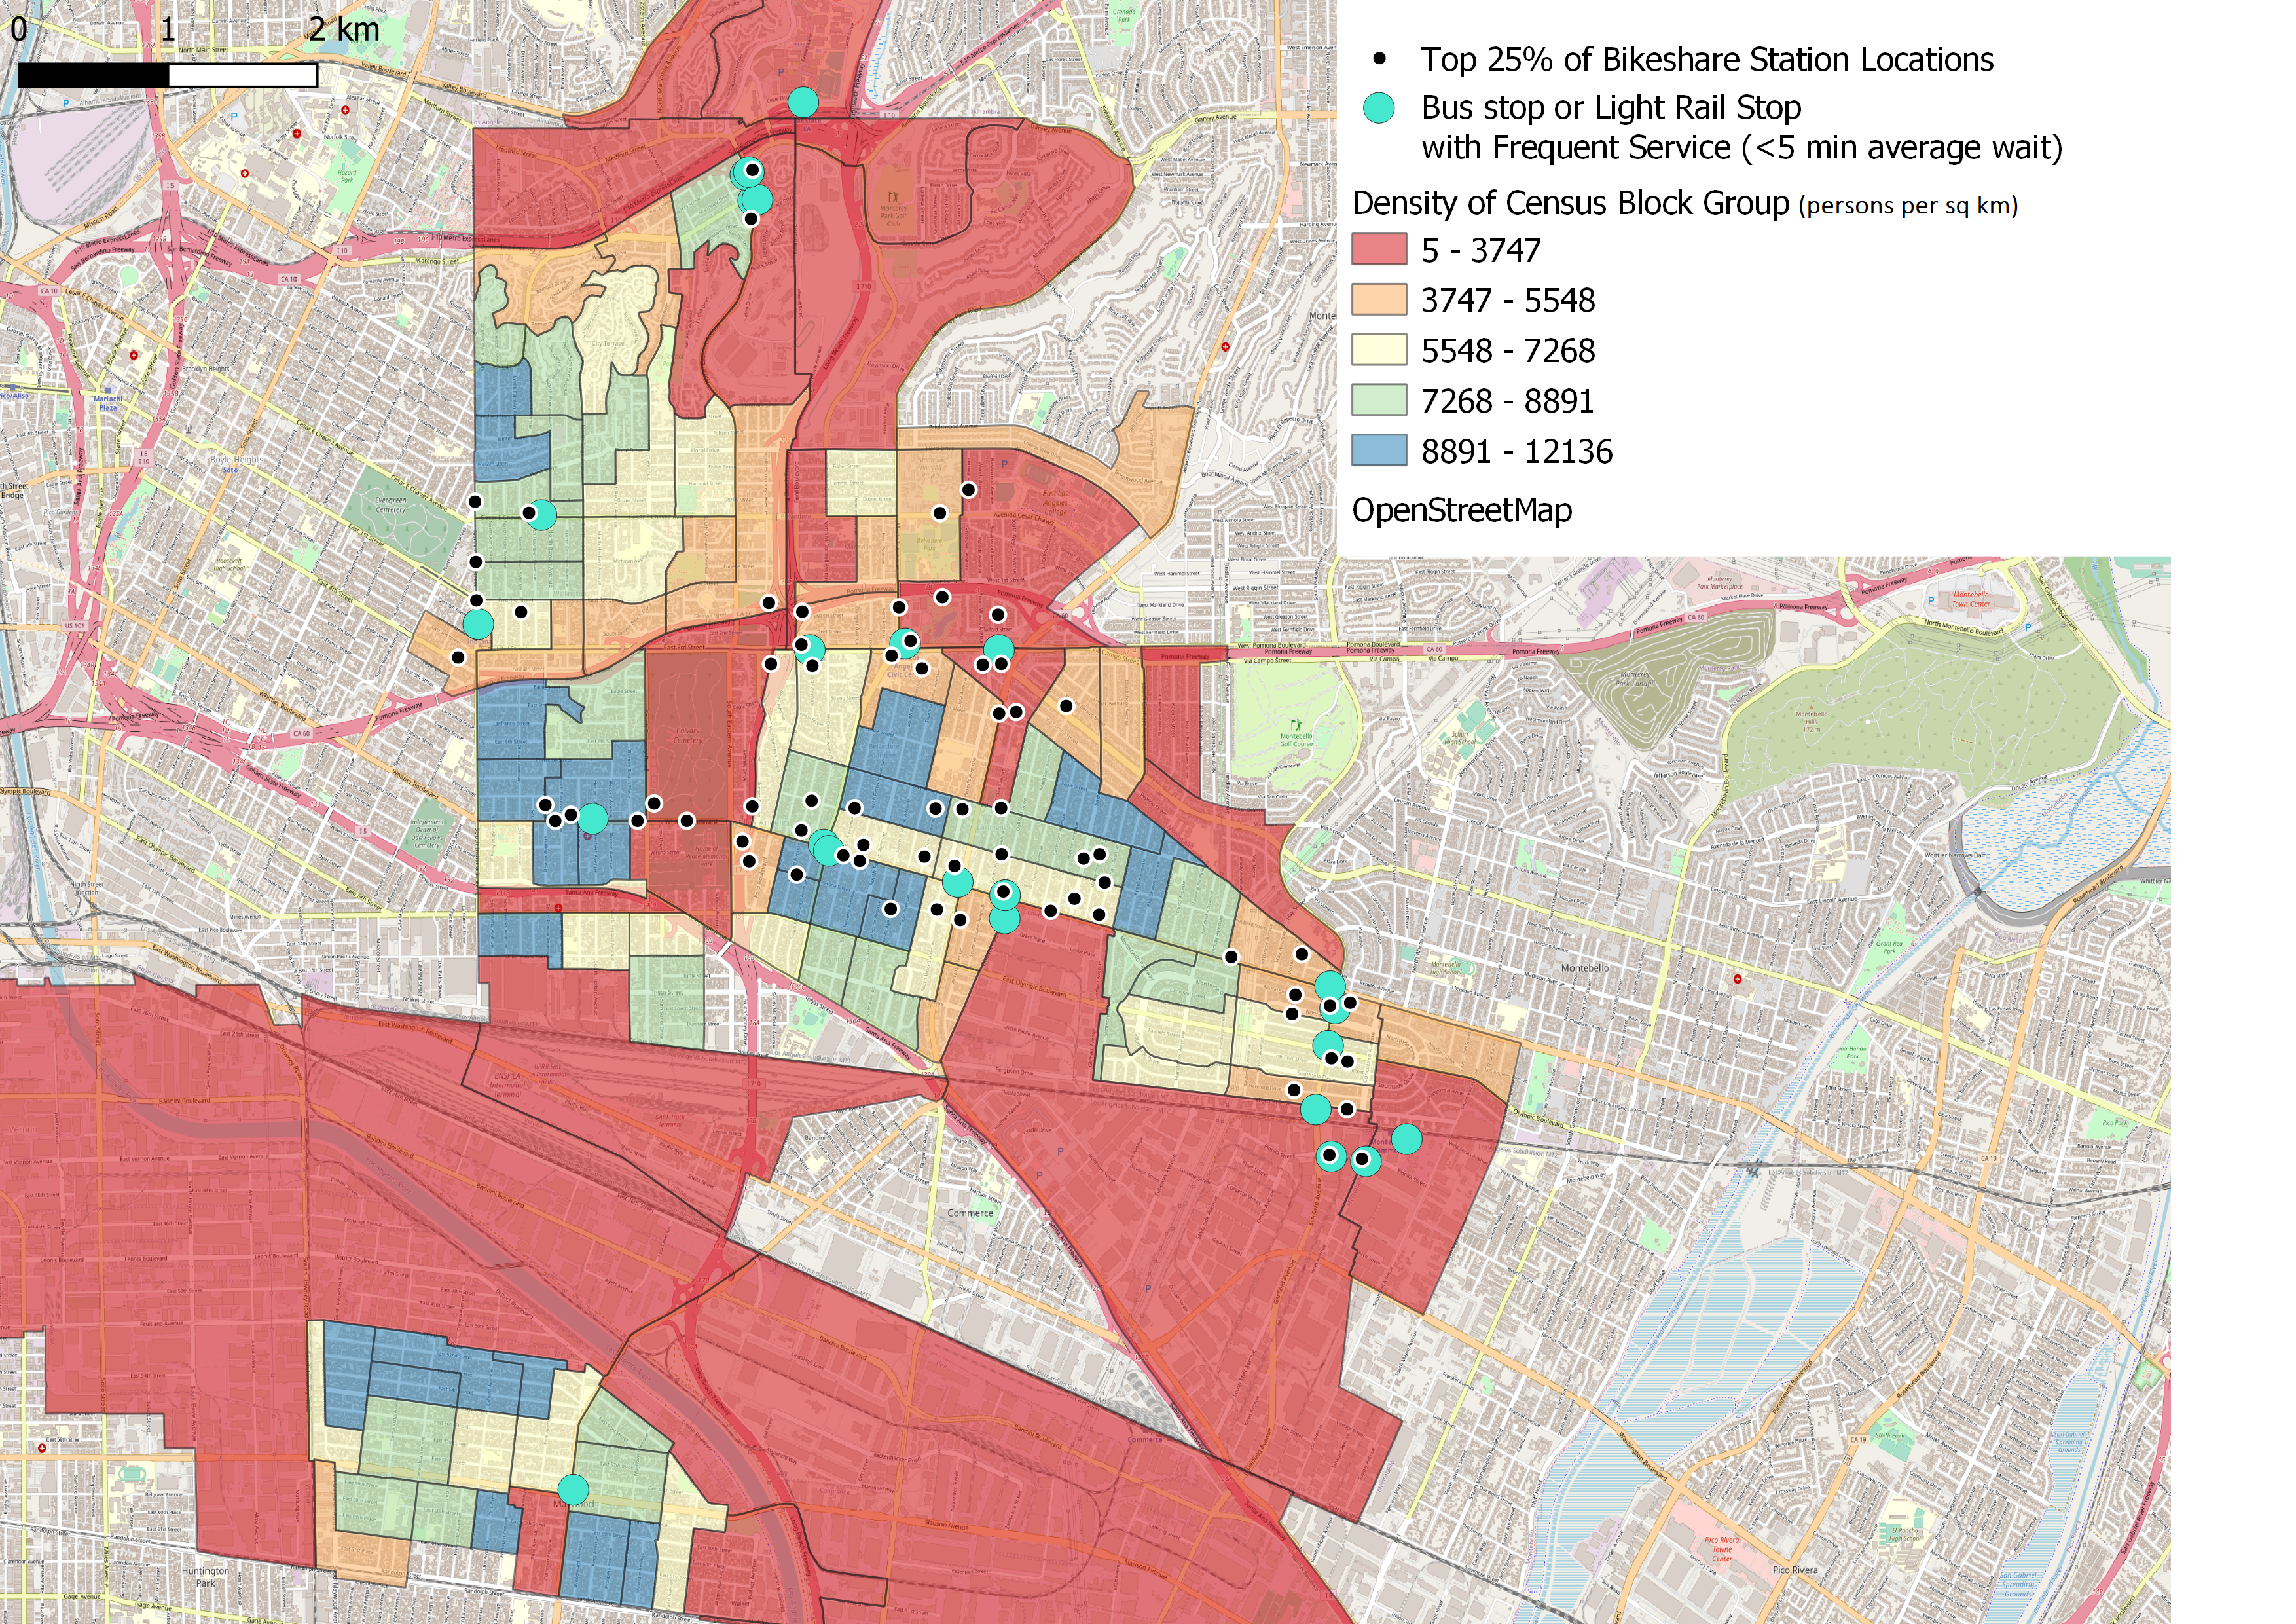
3. Findings
The top 25th percentile bikeshare locations are shown in Figure 2. We measured the effectiveness of bikeshare in bringing residents within 5- and 10-minute travel times of high frequency transit (≤ 10-minute morning peak headway) by comparing the status quo (no bikeshare) with the accessibility provided by the hypothetical bikeshare system (Table 2). We calculate travel times to the nearest high frequency transit station as follows:
Baseline (no bike-share): Walking from the center of each 300x300m grid cell to the nearest high-frequency transit station at a speed of 4.82km/h, routing via the road network.
Scenario 1: From the center of each 300x300m grid cell, routing at walk speed (4.82 km/h) to the nearest docked bikeshare station, from there at bicycle speed (16.09 km/h) to the docked bikeshare closest to the nearest high frequency transit station, and from there at walk speed (4.82 km/h) to the transit station. All routing is over the street network. We add a 30 second time penalty to dock/undock bicycles.
Scenario 2 (robustness test): Routing the same way as in Scenario 1, with bikeshare stations sited according to the regression results from the reduced model in Table 1.

When siting bikeshare stations using the reduced model, 51% of the 296 stations did not move compared with the siting using the full model, and another 30% of stations moved less than 100m.
In Scenario 1, the increase in number of residents within 5-minutes of high frequency transit, over baseline, is 12% and 42% for 74 station and 296 station systems, respectively, and 10-minute accessibility increases 13% and 66% over baseline for the 74 and 296 station systems. Siting bikeshare stations using the reduced model gives very similar results for the 74 bikeshare station system – increases in access over baseline of 15% (both 5- and 10-minute travel time from high frequency transit.) The reduced model results for 10-minutes from transit are not as similar, suggesting that if the focus is on bikeshare siting to increase access within 5- to 10-minute travel times, model details are more important.
Acknowledgements
This research was funded by the California Strategic Growth Council under the grant, Climate Smart Transportation and Communities Consortium (CSTACC). The CSTACC was led by University of California, Davis and includes USC as a sub-contractor. We gratefully acknowledge the participation of the Southeast Los Angeles Collaborative, Pat Brown Institute at California State University, Los Angeles, focus group participants, and project Advisory Committee members. The analysis, results, and interpretations are the authors’ alone.
As a comparison, Oslo, Norway, population approximately 700,000, has a system of 249 docked bikeshare stations, per information at https://oslobysykkel.no/en/how-it-works. Given that the population of our study area is approximately ¼ that of Oslo, a 74 station bikeshare system might be a reasonable implementation in practice.