1. Questions
The COVID-19 pandemic has had significant and unprecedented impacts on travel behaviour. It is difficult to predict what ‘post-COVID’ travel will look like considering the emergence of new strains and new waves of infection. In the short-term, public transport use significantly drops whereas car driving recovers quickly (Jenelius and Cebecauer 2020; Beck and Hensher 2021). Yet few locations in the world have been ‘free from COVID’ for more than a few months, leaving much uncertainty over when (if ever) public transport ridership will return to pre-pandemic levels.
The island state of Tasmania, Australia presents a rare example of ‘post-COVID’ travel behaviour given that at the time of writing its last case of community transmission was in June 2020. Furthermore, at no time during the pandemic were people required to wear a mask on public transport. Therefore, this location provides a rare opportunity to study travel behavior a full year beyond the ‘end’ of COVID-19.
In this paper we aim to explore the impact of the COVID-19 pandemic on travel behaviour in a location with no community cases of COVID-19 and little to no restrictions on travel movements. The guiding research question is: One year after the last COVID-19 transmission, have car use and public transport ridership returned to pre-COVID-19 levels?
2. Methods
Tasmania is an island state off the southern coast of Australia. Its capital and largest city, Hobart, has a population of 222,000 (Australian Bureau of Statistics 2016). Buses are the only public transport mode available and they are focused on providing access to the city centre during peak periods. Greater Hobart is heavily car-reliant; private vehicles account for 74% of commuting trips, followed by active transport (13%) and public transport (12%) (Australian Bureau of Statistics 2016).
Key dates for the pandemic in Tasmania are summarised in Table 1. Tasmania entered lockdown on 31 March 2020. Restrictions were progressively eased from May 11 with no restrictions on travel from June 2020. Tasmania had no active cases of COVID-19 by 12 June 2020. Note that masks were never required on public transport.
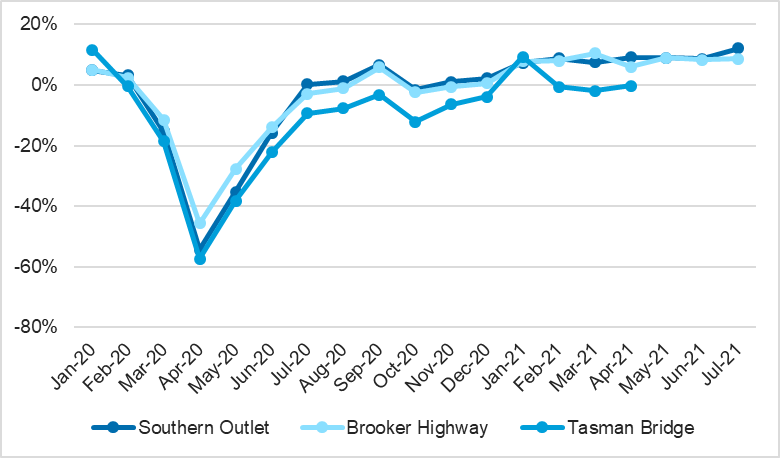
Weekday traffic volume data from permanent traffic counters was obtained from the Department of State Growth geocounts website (Department of State Growth 2021). The review focused on the three major commuter routes to the Hobart central business district: Tasman Bridge, Southern Outlet and Brooker Highway. Note that for the Tasman Bridge, data from May-July 2021 was not available.
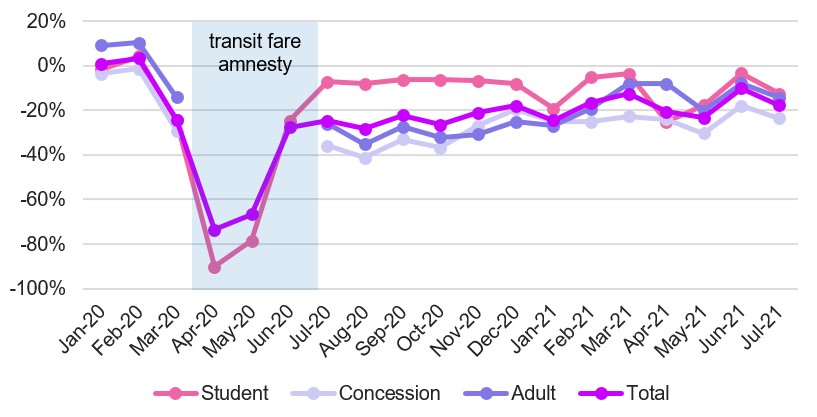
Monthly bus boarding data for Hobart was provided to the authors by Metro Tasmania. Note that a fare amnesty was provided from 26 March to 5 July 2020. During these months boardings were recorded by the driver who pressed buttons to record each person boarding. Drivers were asked to record student, adult and concession boardings separately in this time. Note that in urban areas, most Australian schools do not have fleets of school buses; students use the public bus system. Australian students are easy to visually identify due to the use of school uniforms, so records of student boardings during the fare amnesty are likely to be reasonably accurate. However, concession riders (which includes university students, elderly persons and low-income persons) are difficult to identify visually so the adult vs. concession trends are not shown.
Results will be presented as change relative to a baseline level. For both traffic and bus data the ‘baseline’ is the corresponding month in 2019 (to control for seasonality).
3. Findings
Figure 1 presents the relative change in bus boardings relative to the same month in 2019. Boardings significantly decreased between March and May 2020 to below 60% of the same months in 2019. Student boardings recovered almost immediately and remained around 7% below 2019. Adult and concession boardings recovered more gradually and remain significantly below 2019 levels.

Weekday daily traffic volume data is presented in Figure 2, showing percentage changes from 2019 volumes for the three major commuter routes into the city. Traffic volumes decreased significantly in March 2020, after the first case of COVID-19 was detected on March 2. Traffic volumes began increasing in May, corresponding with the progressive easing of restrictions from May 11. Within a month of restrictions easing, traffic volumes on two of the three roads returned to (and then exceeded) volumes in 2019; traffic on the Tasman bridge was slower to recover.

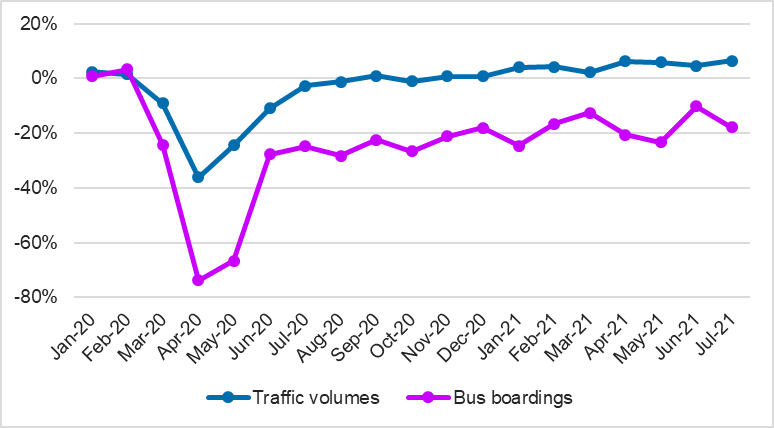
A comparison of bus boarding volumes and traffic volumes is presented in Figure 3. The traffic volume data is the median of the daily volume on the three commuter routes. The pandemic had a greater impact on bus boarding volumes than traffic volumes, with bus boarding volumes reduced by approximately twice as much as daily traffic volumes. In July 2021, bus boarding volumes remained down by 18%, while traffic volumes were above 2019 levels.
The rapid increase in road traffic echoes findings from many jurisdictions. The public transport trends show that even in a city with no COVID-19 cases for over 12 months, and which never had a mask mandate on public transport, bus ridership shows little sign of recovery to ‘pre pandemic’ levels. Even student and concession riders, who are traditionally more ‘captive’ parts of the bus market, have not shown a full recovery. In conclusion, these findings suggest that cities face a long-term challenge in attracting people back onto public transport even a year after the threat of COVID-19 has passed.
Acknowledgements
This study was initially conducted to fulfil the requirements of Monash University unit CIV5308 - Transport and traffic systems project.