Loading [Contrib]/a11y/accessibility-menu.js
Skip to main content
null
Findings
  • Menu
  • Articles
    • Energy Findings
    • Resilience Findings
    • Safety Findings
    • Transport Findings
    • Urban Findings
    • All
  • For Authors
  • Editorial Board
  • About
  • Blog
  • covid-19
  • search

RSS Feed

Enter the URL below into your favorite RSS reader.

http://localhost:52307/feed
Transport Findings
February 01, 2022 AEST

Effect of Residential Street Speed Limit Reduction on Driving Speeds in Portland, Oregon

Jason C Anderson, Christopher Monsere, Sirisha Kothuri,
speed reductiondriver behaviorregressionlogit modelvehicle speeds
Copyright Logoccby-sa-4.0 • https://doi.org/10.32866/001c.31956
Photo by Elena Kuchko on Unsplash
Findings
Anderson, Jason C, Christopher Monsere, and Sirisha Kothuri. 2022. “Effect of Residential Street Speed Limit Reduction on Driving Speeds in Portland, Oregon.” Findings, January. https:/​/​doi.org/​10.32866/​001c.31956.
Save article as...▾
Download all (3)
  • Figure 1. (a) Difference in mean, median, and 85th percentile speed, (b) Difference in speeds of greater than 40.23 km/hr (25 mi/hr), 48.28 km/hr (30 mi/hr), and 56.33 km/hr (35 mi/hr), (c) Number of sites with decrease in mean, median, and 85th percentile speed, and (d) Number of sites with decrease in speeds of greater than 40.23 km/hr (25 mi/hr), 40.28 km/hr (30 mi/hr), and 56.33 km/hr (35 mi/hr)
    Download
  • Figure 2. Change in Mean Speeds (km/hr) by Site
    Download
  • Figure 3. Change in Percent of Vehicles With Speed Greater Than 48.28 km/hr (30 mi/hr) by Site
    Download

Sorry, something went wrong. Please try again.

If this problem reoccurs, please contact Scholastica Support

Error message:

undefined

View more stats

Abstract

This study analyzed the impacts on motor vehicle observed speeds following a residential speed limit reduction from 40.23 km/hr (25 mi/hr) to 32.19 km/hr (20 mi/hr) in Portland, OR that was accompanied by a public awareness and signage campaign. The study used before and after observations of vehicle speeds collected by pneumatic tube traffic counters. Overall, the analysis suggests that the reduction of posted speed limits to 32.19 km/h (20 mi/h) has resulted in lower observed vehicle speeds and fewer vehicles traveling at higher speeds. The reduction in the percentage of vehicles traveling above 48.28 km/h (30 mi/h) (-1.7%) and 56.33 km/h (35 mi/h) (-0.5%) are larger in magnitude than other speed metrics.

Questions

  1. Was there a statistically significant change in mean speed, 85th percentile speed, and proportions of vehicles traveling greater than 40.23 km/hr (25 mi/hr), 48.28 km/hr (30 mi/hr), and 56.33 km/hr (35 mi/hr) after the residential speed limit reduction was implemented and the accompanying public awareness and signage campaign?

  2. What is the estimated effect of the speed limit change on observed vehicle speeds?

Methods

The Portland City Council approved an ordinance reducing the speed limit on all residential streets to 32.19 km/hr (20 mi/hr) in January 2018. A residential street is a street that is in a residence district according to Oregon Law ORS 801.430 and has a statutory speed limit. Collector and arterial classifications are not included. The 32.19 km/hr (20 mi/hr) speed limit went into effect on April 1, 2018. The city installed new speed limit signs and updated existing signs over the period of February 2018 to May 2019. The final 32.19 km/hr (20 mi/hr) sign installation increased the number of residential speed limit signs from fewer than 1,000 signs to more than 2,000. An educational and awareness campaign “20 Is Plenty” was also conducted, as well as media campaigns. As part of the effort, nearly 7,000 yard signs were distributed to residents.

Data was collected by the Portland Bureau of Transportation at 58 locations on residential streets using pneumatic tubes placed perpendicular to the direction of traffic flow. Before data was collected between 2013 and 2018, while all after data was collected between February 2019 and July 2019. Both before and after data were collected during weekdays and a few weekends, with the duration varying between 24-97 hours at each location. Recorded speeds of 0 km/hr or greater than 160.93 km/hr (100 mi/hr) were removed from the data prior to analysis for quality control. The excluded data, as a percentage of total observations, was consistent across the two periods (approximately 8%). After cleaning, 131,452 before and 82,768 after observations were available for analysis. All analyses were conducted using the disaggregate, or raw, speed data.

Available controlling factors included time-of-day, day of the week, vehicle classification, and data extracted from Portland’s GIS database on physical and operational aspects of the roadway (curb-to-curb pavement width, number of lanes, presence of sidewalks, curb height, presence of parking signs, and pavement condition). A summary of available controlling factors is given in Table 1.

Table 1.Summary of Potential Controlling Explanatory Variables
Variable Frequency Mean St. Dev. Minimum Maximum
After Speed Reduction Indicator
1 if after speed reduction, 0 if before 82,768 0.386 0.487 — —
Speed Bins
1 if greater than 40.23 km/hr (25 mi/hr), 0 otherwise 51,262 0.239 0.427 — —
1 if greater than 48.28 km/hr (30 mi/hr), 0 otherwise 12,536 0.059 0.235 — —
1 if greater than 56.33 km/hr (35 mi/hr), 0 otherwise 1,953 0.009 0.095 — —
Time-of-Day Indicators
1 if 6:00 a.m. to 10:00 a.m., 0 otherwise 69,259 0.323 0.468 — —
1 if 10:00 a.m. to 4:00 p.m., 0 otherwise 47,821 0.223 0.416 — —
1 if 4:00 p.m. to 8:00 p.m., 0 otherwise 3,752 0.018 0.131 — —
1 if 8:00 p.m. to 6:00 a.m., 0 otherwise 93,388 0.436 0.496 — —
Day-of-Week Indicators
1 if Monday, 0 otherwise 21,219 0.099 0.299 — —
1 if Tuesday, 0 otherwise 40,592 0.189 0.392 — —
1 if Wednesday, 0 otherwise 49,528 0.231 0.422 — —
1 if Thursday, 0 otherwise 57,468 0.268 0.443 — —
1 if Friday, 0 otherwise 29,524 0.138 0.345 — —
1 if Weekend, 0 otherwise 15,889 0.074 0.262 — —
Vehicle Classification Indicators
1 if motorcycle/bike, 0 otherwise 7,362 0.034 0.182 — —
1 if passenger vehicle, 0 otherwise 166,130 0.776 0.417 — —
1 if 2-axle long, 0 otherwise 29,655 0.138 0.345 — —
1 if bus, 0 otherwise 6,737 0.031 0.175 — —
Roadway Characteristics
Surface width (m) 214,220 9.370 1.205 5.486 12.192
Pavement condition index 214,220 58.189 14.794 13 100
Curb height (cm) 214,220 10.391 4.039 0 17.780
Adjacent Signage
1 if no parking sign, 0 otherwise 44,231 0.206 0.405 — —
1 if stop sign, 0 otherwise 71,523 0.334 0.472 — —
Pavement Type
1 if composite pavement, 0 otherwise 13,867 0.065 0.246 — —
1 if flexible pavement, 0 otherwise 182,398 0.851 0.356 — —
1 if OILMa pavement, 0 otherwise 9,390 0.044 0.205 — —
1 if rigid pavement, 0 otherwise 8,565 0.040 0.196 — —

a OILM defined as Oil-Macadam Pavement Streets

Findings

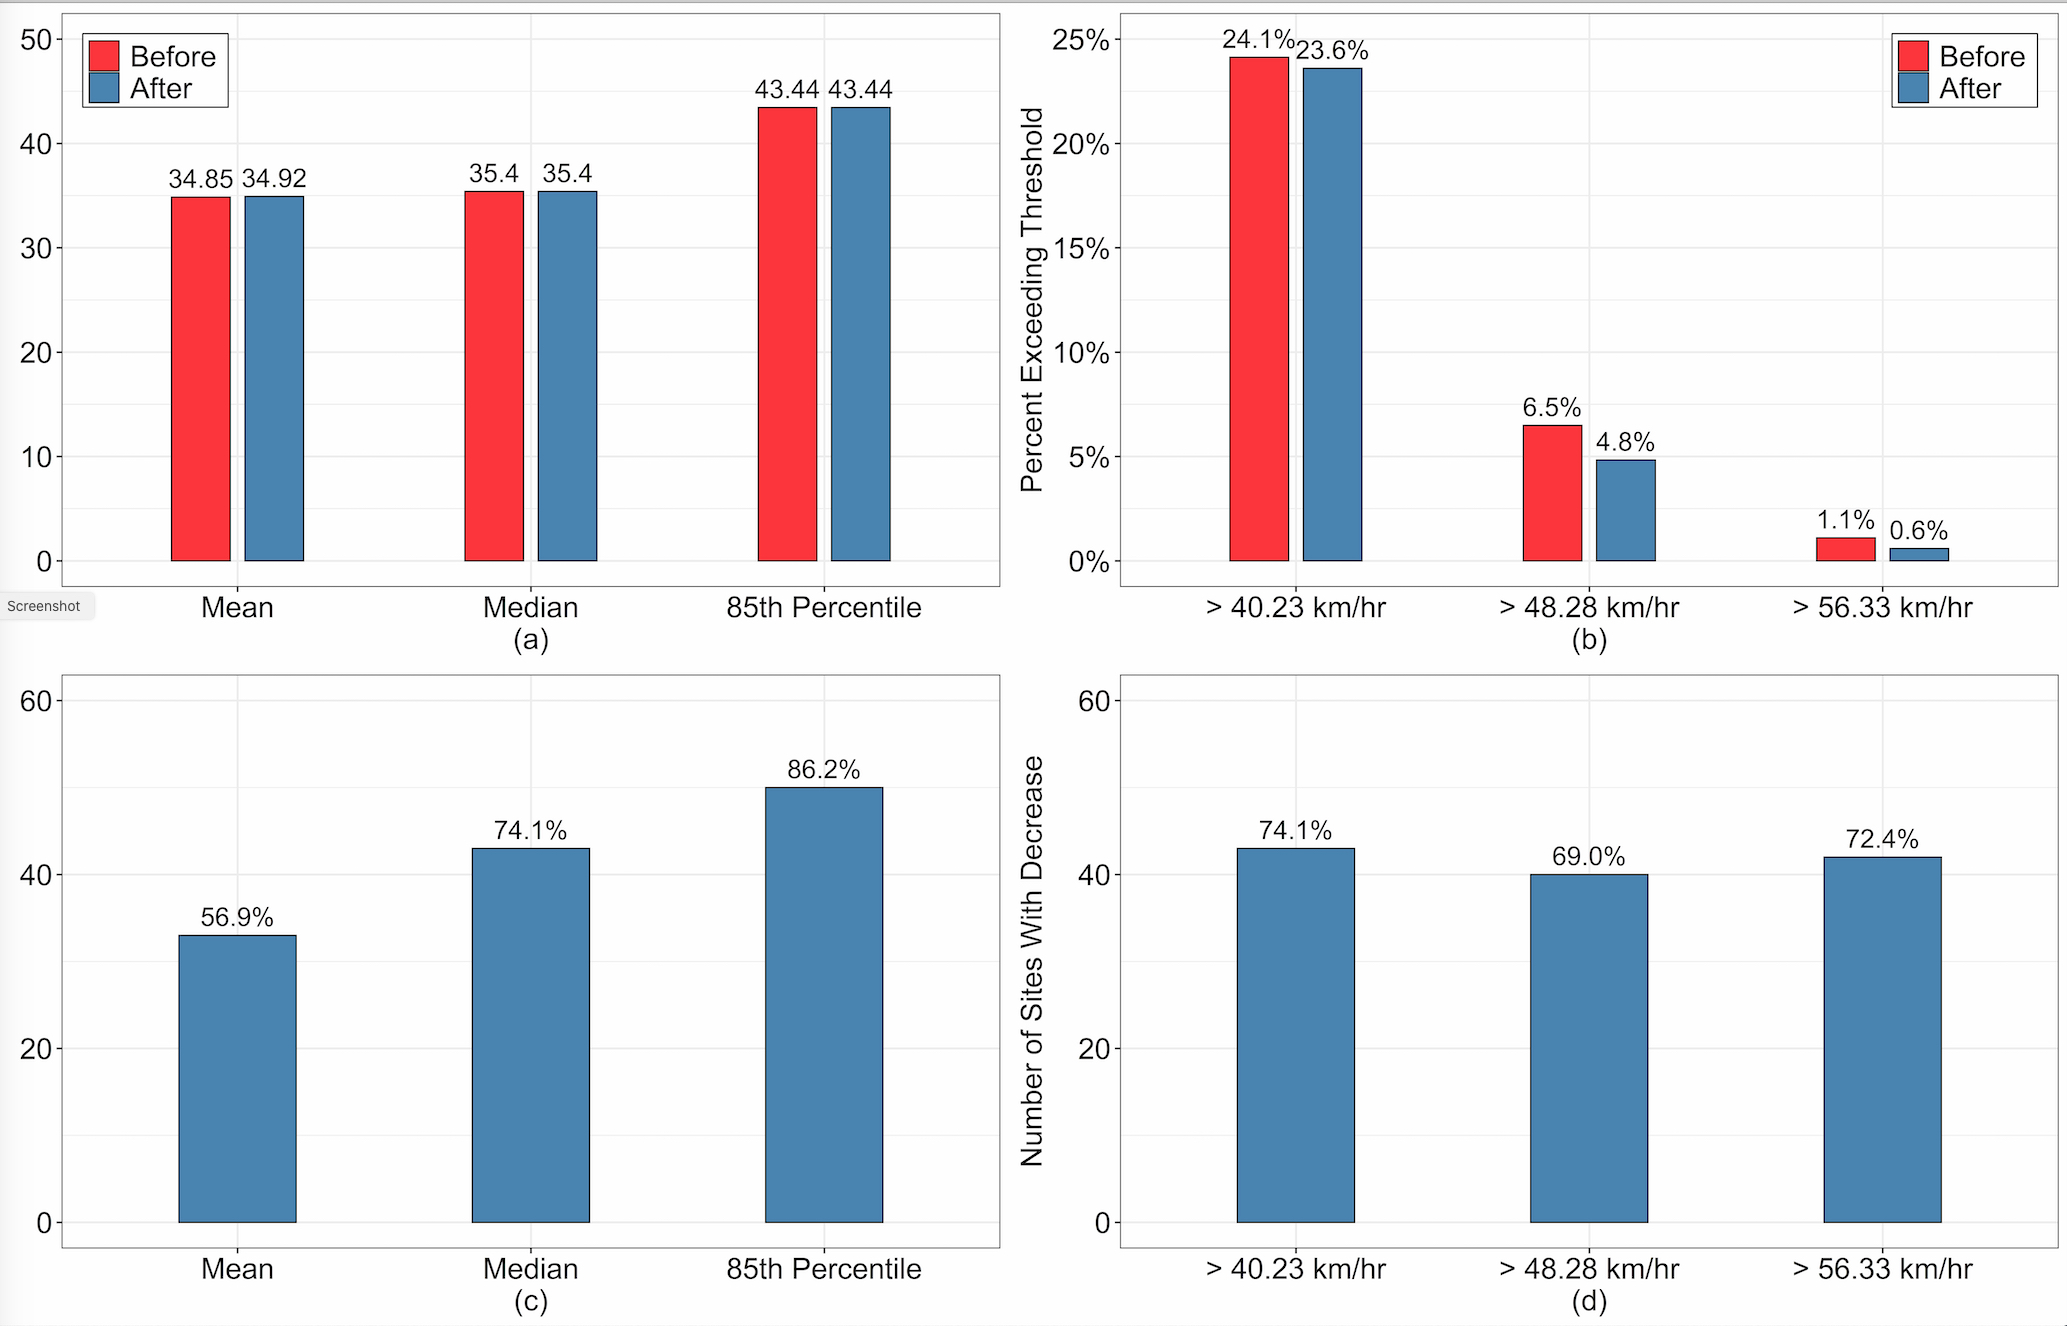
Descriptive statistics for the pooled data (all sites) and each site were computed to assess changes in common speed measures. Mean speed increased from 34.76 km/hr (21.6 mi/hr) to 34.92 km/hr (21.7 mi/hr) (0.37% increase). This change was statistically significant due to the large sample size but is not a practically significant change. Median speed and 85th percentile speed remained the same. The percentage of vehicles traveling with speeds greater than 40.23 km/hr (25 mi/hr), 48.28 km/hr (30 mi/hr), and 56.33 km/hr (35 mi/hr) all decreased. The percentage of vehicles with speeds greater than:

  • 40.23 km/hr (25 mi/hr) decreased by 0.5%

  • 48.28 km/hr (30 mi/hr) decreased by 1.7%

  • 56.33 km/hr (35 mi/hr) decreased by 0.5%

All differences were statistically significant with 95% confidence.

At the 58 individual sites, changes in speed measures vary by location. As shown in Figure 1, at 33 sites (56.9%) there was a decrease in mean speed, at 43 sites (74.1%) a decrease in median speeds, and at 50 sites (86.2%) a decrease in 85th percentile speed. Decreases were also observed for the percentage of vehicles traveling faster than 40.23 km/hr (25 mi/hr) (74.1%), 48.28 km/hr (30 mi/hr) (69.0%), and 56.33 km/hr (35 mi/hr) (72.4%). Spatial patterns were also investigated, but no apparent spatial patterns among speed changes were present.

Figure 1
Figure 1.(a) Difference in mean, median, and 85th percentile speed, (b) Difference in speeds of greater than 40.23 km/hr (25 mi/hr), 48.28 km/hr (30 mi/hr), and 56.33 km/hr (35 mi/hr), (c) Number of sites with decrease in mean, median, and 85th percentile speed, and (d) Number of sites with decrease in speeds of greater than 40.23 km/hr (25 mi/hr), 40.28 km/hr (30 mi/hr), and 56.33 km/hr (35 mi/hr)

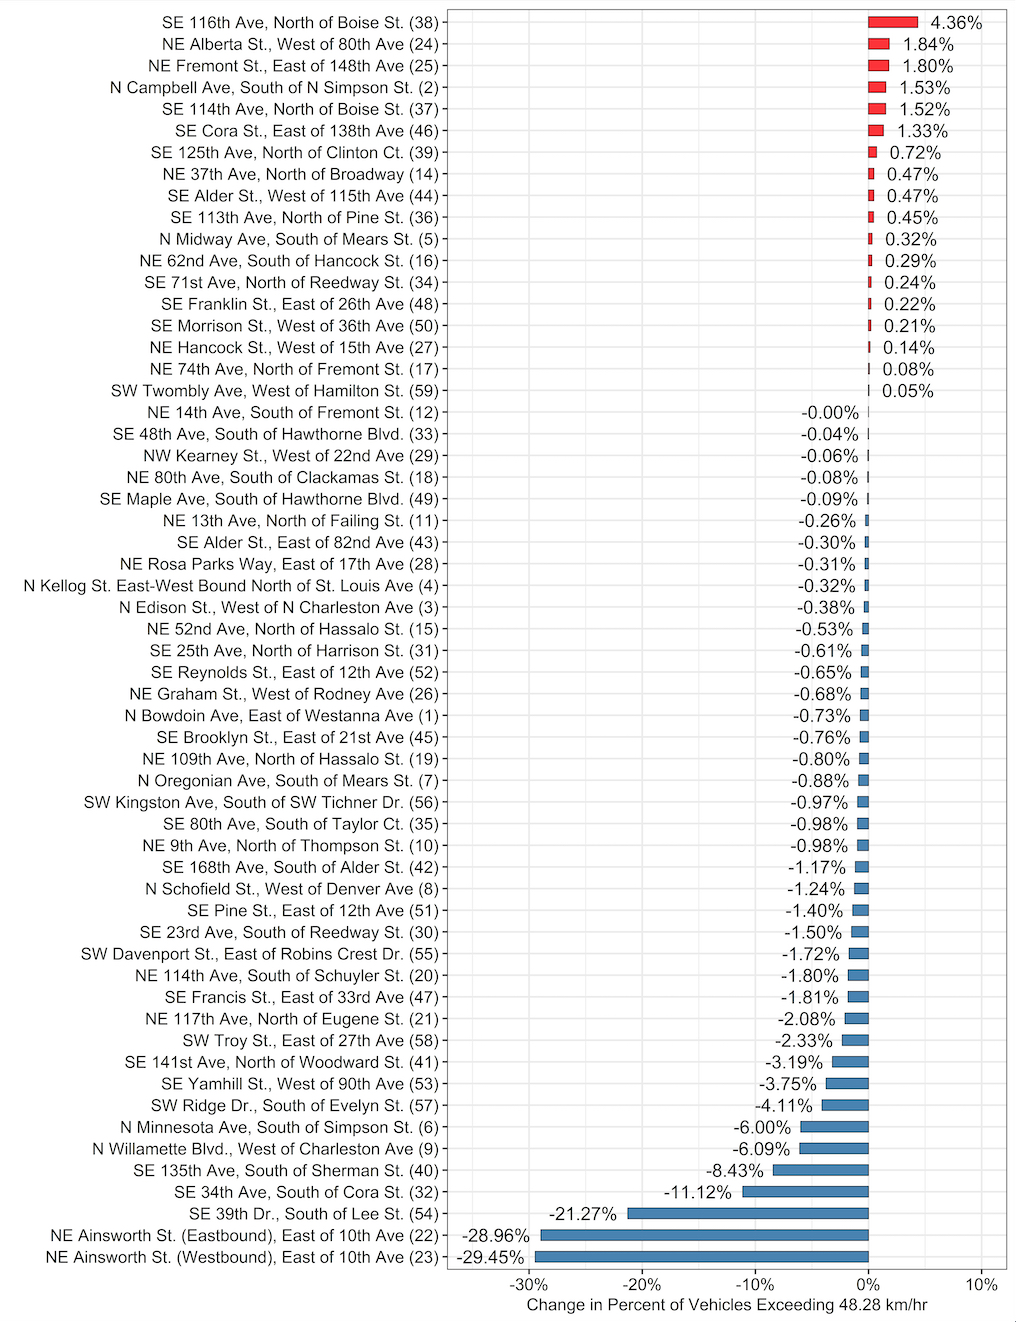
Figure 2 shows mean speed changes using a bar plot, sorted by the magnitude of change. Changes in mean speed range from a decrease of 5.63 km/hr (3.5 mi/hr) to an increase of 3.86 km/hr (2.4 mi/hr). The average decrease was 2.25 km/hr (1.4 mi/hr) and the average increase 1.13 km/hr (0.7 mi/hr). Figure 3 shows the change in percentage of vehicles traveling faster than 48.28 km/hr (30 mi/hr). These changes range from a decrease of 29.5% to an increase of 4.4%. The average decrease was 3.8% and the average increase 0.8%.

Figure 2
Figure 2.Change in Mean Speeds (km/hr) by Site
Figure 3
Figure 3.Change in Percent of Vehicles With Speed Greater Than 48.28 km/hr (30 mi/hr) by Site

A series of statistical models were developed to determine the effects of the speed limit reduction while controlling for other available factors. An indicator variable (1 if after reduction, 0 if before) was created to estimate the effects of the reduction.

Final model specifications for the log-linear regression model are shown in Table 2. The estimate for the after-reduction indicator indicates an expected decrease in observed speed of approximately 1.0%, on average. The parameter is significant with well over 99% confidence. This expected decrease is about 3-times greater than the 0.30% observed by Hu and Cicchino (2020) in a similar study.

Table 2.Log-Linear Regression Model Specifications for Observed Speed
Variable Coefficient Std. Error p-value
Constant 2.341 0.020 <0.0001
Before/After Period
1 if after speed reduction, 0 if before -0.010 0.001 <0.0001
Time-of-Day
1 if 6:00 a.m. to 10:00 a.m., 0 otherwise -0.007 0.001 <0.0001
1 if 4:00 p.m. to 8:00 p.m., 0 otherwise 0.028 0.005 <0.0001
Day-of-Week
1 if Wednesday, 0 otherwise 0.056 0.002 <0.0001
1 if Thursday, 0 otherwise 0.025 0.002 <0.0001
1 if Friday, 0 otherwise 0.016 0.002 <0.0001
1 if Weekend, 0 otherwise -0.081 0.003 <0.0001
Roadway Characteristics
Natural logarithm of surface width 0.088 0.005 <0.0001
Natural logarithm of pavement condition index 0.107 0.002 <0.0001
Curb height -0.011 0.000 <0.0001

Model results align with expectations regarding vehicle speeds. Street width is associated with higher speed (Fitzpatrick et al. 2001). Curb height is likely associated with on-street parking and contributes to narrow available travel way (decrease in speed). Pavement quality and ride are likely to be related to vehicle speed, but the literature is sparse. Previous studies have also found that speeds were less on weekends (Bornioli et al. 2018; Giles 2004).

Binary logit model specifications for the three speed thresholds are shown in Table 3. Parameter estimates, in absolute value, increase as the speed thresholds increase. For the after reduction indicator, the change in odds increases in magnitude as the speed threshold increases. The parameter estimate for after the speed limit reduction suggests a 15.9% reduction in odds of observing speeds greater than 40.23 km/hr (25 mi/hr), a 33.6% reduction in odds of observing speeds greater than 48.28 km/hr (30 mi/hr), and a 49.6% reduction in odds of observing speeds greater than 56.33 km/hr (35 mi/hr). These results confirm the inference from the descriptive analysis; specifically, the percentage of vehicles traveling in the higher speed bins decreased after the reduction.

Table 3.Binary Logit Model Specifications of Speeds Greater Than 40.23 km/hr, 48.28 km/hr, and 56.33 km/hr
Variable Greater Than 40.23 km/hr Greater Than 48.28 km/hr Greater Than 56.33 km/hr
Coefficient Std.
Error
p-value ORa Coefficient Std.
Error
p-value ORa Coefficient Std.
Error
p-value ORa
Constant -5.256 0.167 <0.0001 -9.728 0.329 <0.0001 -12.289 0.829 <0.0001
Before/After Period
1 if after speed reduction, 0 before -0.173 0.011 <0.0001 0.841 -0.409 0.020 <0.0001 0.664 -0.686 0.054 <0.0001 0.504
Time-of-Day
1 if 6:00 a.m. to 10:00 a.m., 0 otherwise -0.090 0.011 <0.0001 0.914 -0.204 0.021 <0.0001 0.816 -0.373 0.056 <0.0001 0.688
1 if 4:00 p.m. to 8:00 p.m., 0 otherwise 0.181 0.037 <0.0001 1.199 0.318 0.059 <0.0001 1.374 0.796 0.110 <0.0001 2.217
Day-of-Week
1 if Wednesday, 0 otherwise 0.543 0.014 <0.0001 1.721 0.810 0.030 <0.0001 2.247 0.784 0.082 <0.0001 2.191
1 if Thursday, 0 otherwise 0.433 0.014 <0.0001 1.542 0.938 0.028 <0.0001 2.555 1.094 0.075 <0.0001 2.985
1 if Friday, 0 otherwise 0.373 0.017 <0.0001 1.452 1.182 0.031 <0.0001 3.261 1.419 0.077 <0.0001 4.132
1 if Weekend, 0 otherwise -0.757 0.028 <0.0001 0.469 -0.985 0.070 <0.0001 0.374 -1.177 0.197 <0.0001 0.308
Roadway Characteristics
Natural logarithm of surface width 0.348 0.041 <0.0001 1.417 0.408 0.077 <0.0001 1.504 0.162 0.189 0.390 1.176
Natural logarithm of PCIb 0.734 0.018 <0.0001 2.084 1.268 0.040 <0.0001 3.554 1.568 0.108 <0.0001 4.797
Curb height -0.057 0.003 <0.0001 0.945 -0.015 0.006 0.011 0.985 0.040 0.015 0.009 1.040

a estimated odds ratio
b pavement condition index
* 40.23 km/hr = 25 mi/hr; 48.28 km/hr = 30 mi/hr; 56.33 km/hr = 35 mi/hr


Acknowledgments

The authors want to acknowledge the Portland Bureau of Transportation (PBOT) for funding this work and providing the necessary data. The authors also want to thank Matthew Kelly of PBOT for his support duirng the project.

Submitted: December 04, 2021 AEST

Accepted: January 19, 2022 AEST

References

Bornioli, Anna, Isabelle Bray, Paul Pilkington, and Emma L. Bird. 2018. “The Effectiveness of a 20 mph Speed Limit Intervention on Vehicle Speeds in Bristol, UK: A Non-Randomised Stepped Wedge Design.” Journal of Transport and Health 11 (December):47–55. https:/​/​doi.org/​10.1016/​j.jth.2018.09.009.
Google Scholar
Fitzpatrick, Kay, Paul Carlson, Marcus Brewer, and Mark Wooldridge. 2001. “Design Factors That Affect Driver Speed on Suburban Streets.” Transportation Research Record: Journal of the Transportation Research Board 1751 (1): 18–25. https:/​/​doi.org/​10.3141/​1751-03.
Google Scholar
Giles, Margaret J. 2004. “Driver Speed Compliance in Western Australia: A Multivariate Analysis.” Transport Policy 11 (3): 227–35. https:/​/​doi.org/​10.1016/​j.tranpol.2003.11.002.
Google Scholar
Hu, Wen, and Jessica B Cicchino. 2020. “Lowering the Speed Limit from 30mph to 25mph in Boston: Effects on Vehicle Speeds.” Injury Prevention 26 (2): 99–102. https:/​/​doi.org/​10.1136/​injuryprev-2018-043025.
Google Scholar

This website uses cookies

We use cookies to enhance your experience and support COUNTER Metrics for transparent reporting of readership statistics. Cookie data is not sold to third parties or used for marketing purposes.

Powered by Scholastica, the modern academic journal management system