
1. Questions
Advanced urban planning activities are shifting towards a focus on sustainable mobility, among which is the development of strategies and design elements enhancing the accessibility, comfort and safety of the urban setting for walking (Buhrmann, Wefering, and Rupprecht 2019). This has become even more crucial considering the unprecedented effects of the Covid-19 pandemic on urban mobility, and the need to ensure accessibility to essential and diverse services within a comfortable walking distance at a neighborhood scale (i.e., 15-minute city) (Moreno et al. 2021).
Although traditional approaches related to walkability tend to focus on the spatial dimension (Speck 2013; Wang and Yang 2019), individual characteristics of city users have a significant impact on the perceived level of pedestrian friendliness of streets and public spaces (e.g., demographics and socioeconomics characteristics, travel purposes, mobility preferences, etc.). In particular, the measures currently in place do not sufficiently consider vulnerable population groups (i.e., SDG 11.2-Sustainable Transport for All) (United Nations 2016), including people with impaired mobility, elderly, children, and women.
In this framework, this study focuses on the needs and expectations of women while walking (Pollard and Wagnild 2017). As highlighted by Golan et al. (2019), Andersdotter Fabre et al. (2021), and Sethi and Velez-Duque (2021), women experience the city differently than men, since they are more concerned with security issues related to aggression and harassment. These constraints take the form of precautionary or avoidance behaviors due to fear of violence, perception of risk, and sense of vulnerability (e.g., suppressed, re-routed or delayed walking trips, etc.), as a major inhibitor of mobility for women in public spaces especially at nighttime (Koskela 1999; Loukaitou-Sideris 2014; Vera-Grey 2018).
In recognition of these challenges, this study aims to assess the level of walkability for women focusing on a case study in New York City (NYC, US). This research started from the definition of the relevant criteria to be included in the study of walkability for women (Speck 2013; Gorrini and Bertini 2018). First, a thematic literature review was conducted on some of the most recent and relevant scientific contributions about this topic, considering both their conceptual and methodological approach (see Table 1). This led to identification of the following four criteria: (i) accessibility to essential services within a comfortable walking distance or usefulness; (ii) comfort of the road infrastructure in terms of sidewalks, public space, and green areas; (iii) perceived level of safety and security while walking; (iii) vitality of the social context or attractiveness.

Then, using Geographic Information Systems (GIS), as well as a series of open data specifically focused on the needs of female pedestrians, the current study proposed an enriched Walkability for Women Index, aiming at identifying the census block groups and neighborhoods of NYC characterized by the lowest level of walkability in relation to the needs of women.
2. Methods
The results of the literature review were exploited to select a series of relevant geolocated datasets, which were retrieved, sorted, and filtered from open-data repositories, geoportals and census databases (see Table 2). The select indicators were analyzed through Geographic Information Systems (GIS) to design a multi-layer map of NYC, focusing on each walkability criterion. This was based on isochrone analyses showing lines of travel time by walking to reach each service or facility, and on the calculation of the spatial distribution of punctual and areal vectors on census block groups (cbg). Regarding security issues, the considered dataset includes all violation crimes reported to the New York City Police Department in relation to harassment, obscenity performance rape, sexual crimes and abuses (considering offenses occurring at intersections).
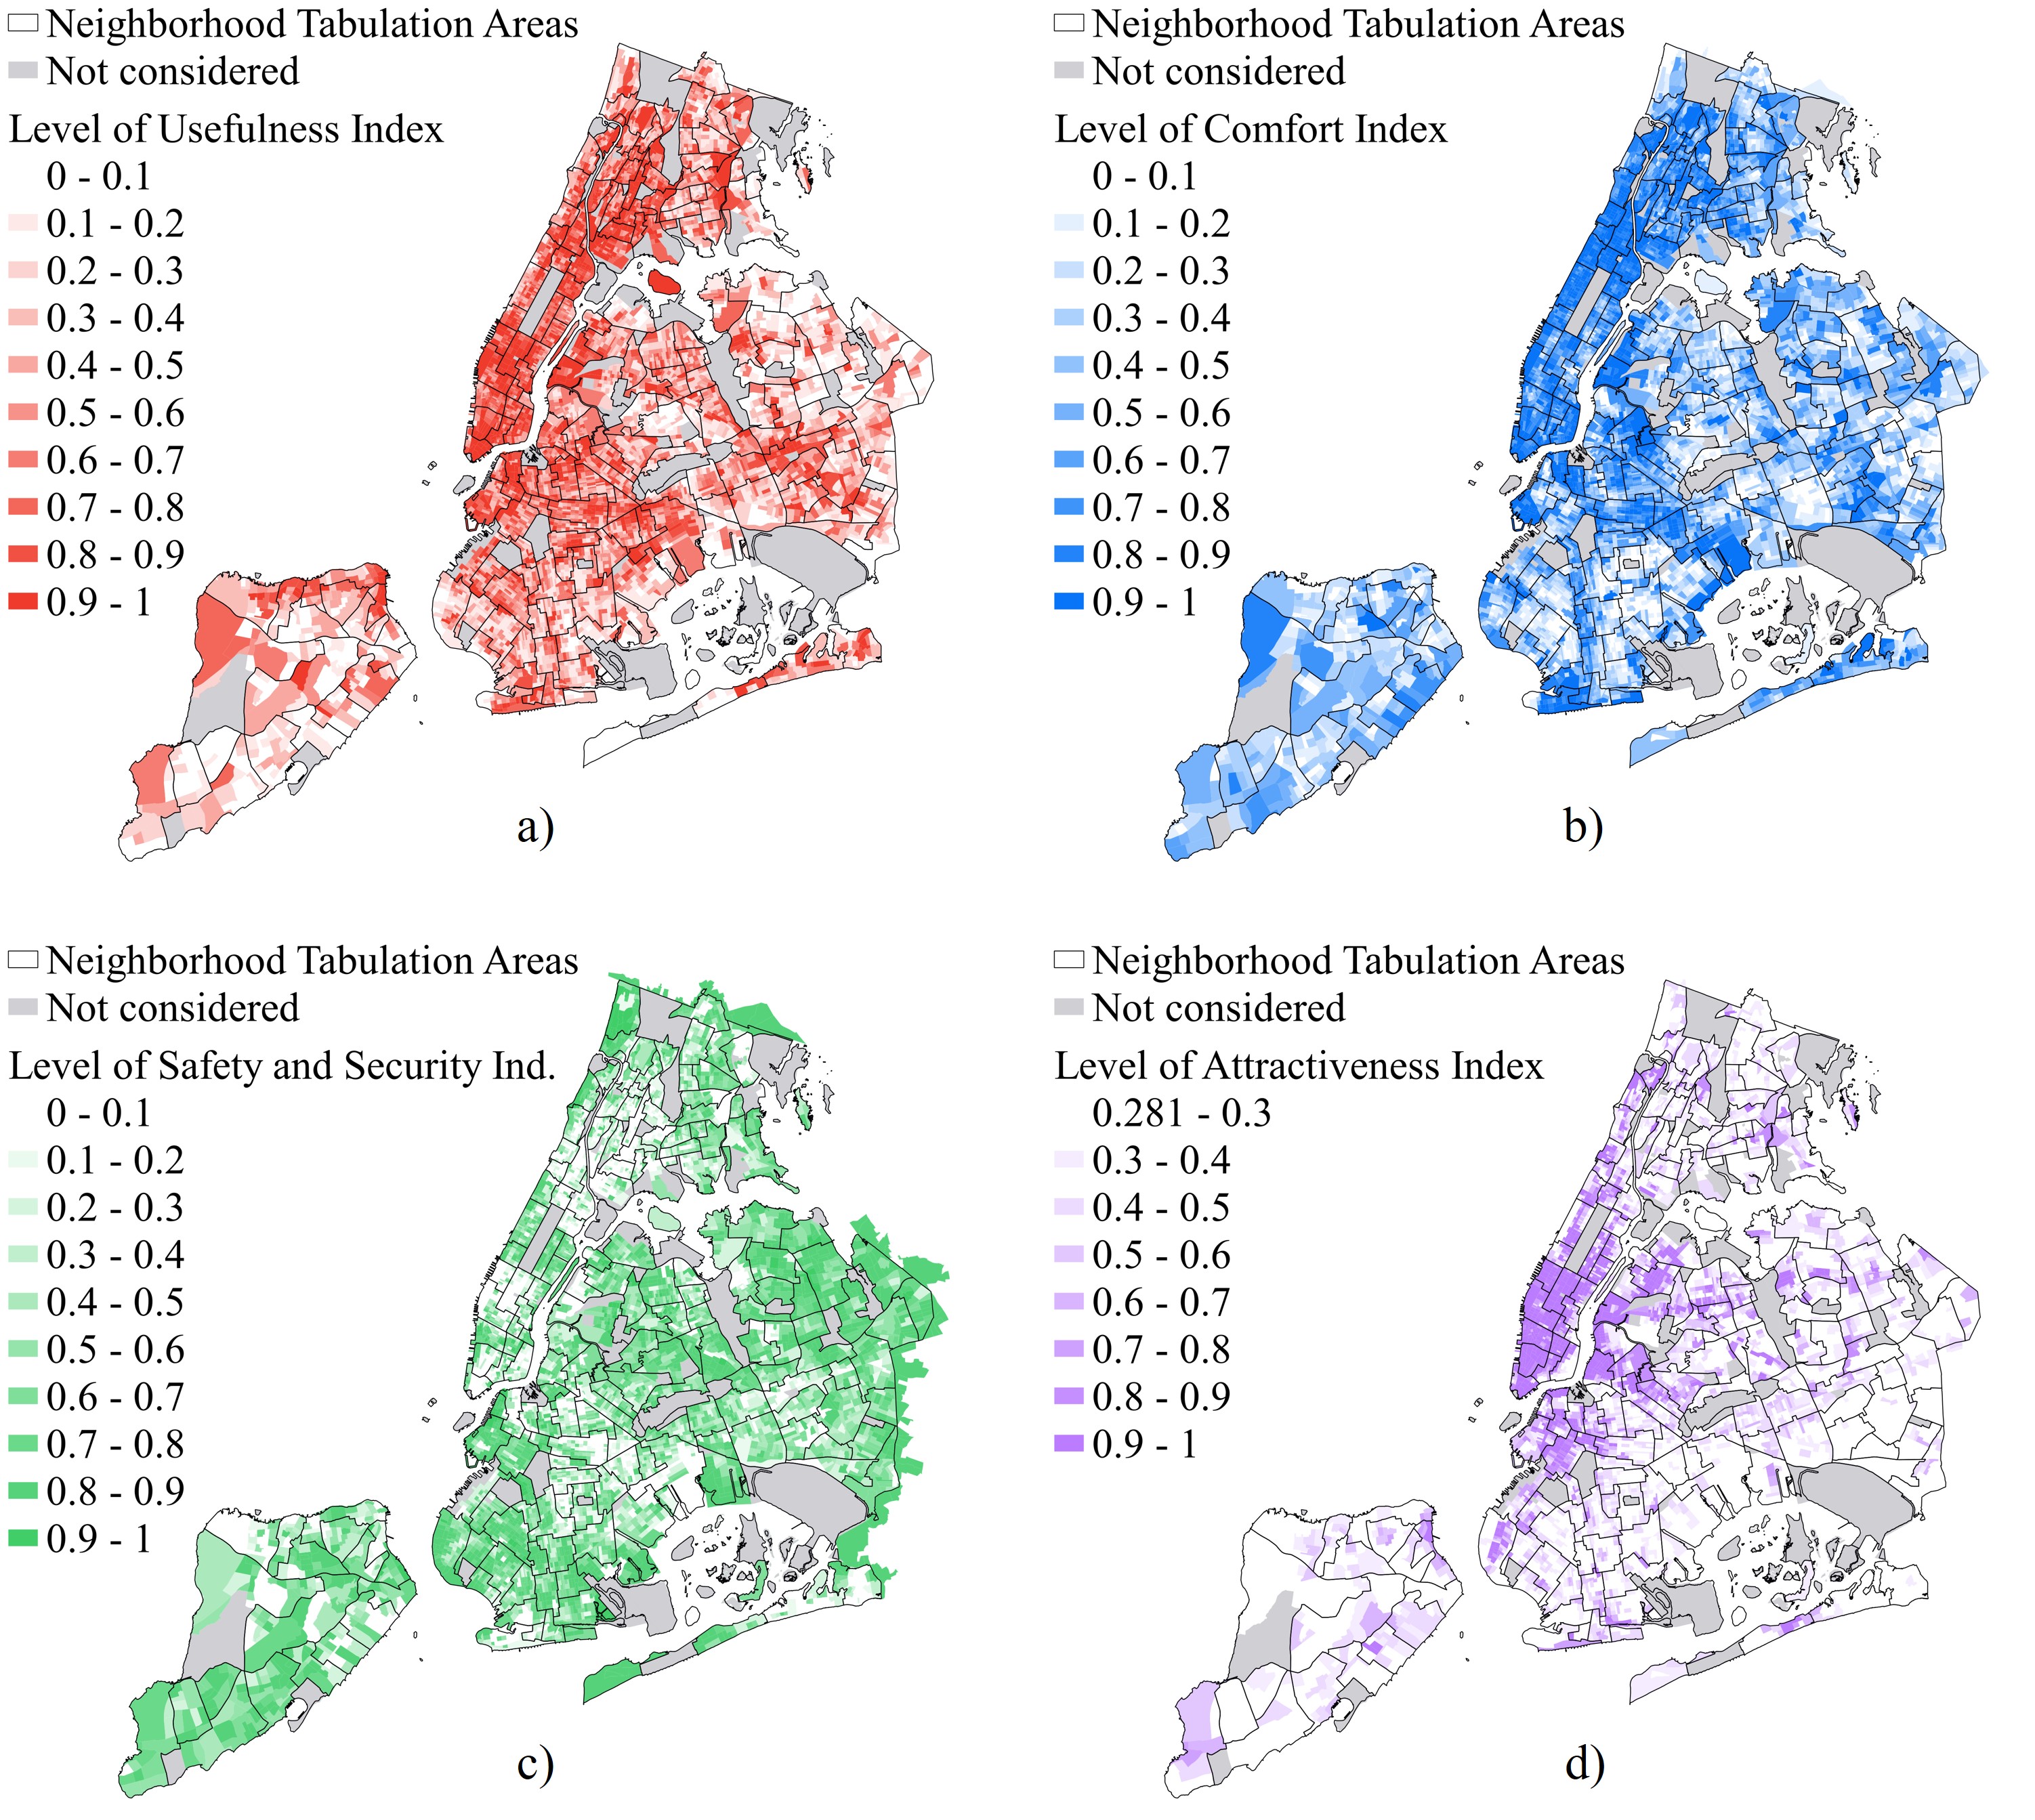
For comparing the various indicators among them, each one has been normalized on a 0-1 scale creating Z-scores that follow the normal distribution of the values. The indicators were then included in the calculation of the Level of Usefulness Index (LUI), Level Comfort Index (LCI), Level Safety and Security Index (LSSI), and Level of Attractiveness Index (LAI). This was essentially based on weighted summations of the Z-scores of the variables proposed in this study (see Table 1).
The weights definition was based on: (i) assigning a reference magnitude based on the results of the proposed literature review to strengthen the impact of the indicators and criteria which were defined by previous research works as more relevant considering the needs of women while walking; and (ii) a preliminary sensitivity analysis for calibrating values to balance and optimize the calculation of the proposed multidimensional data analysis.
The calculation of the Walkability for Women Index (WWI – Equation 1) represents a synthesis of four proposed indexes. According to the proposed methodology, the constant parameters KLUI (corresponding to 0.2), KLCI (corresponding to 0.2), KLSSI (corresponding to 0.4), and KAI (corresponding to 0.2) were weighted to accentuate the impact of the level of safety and security on WWI (∑ constant parameters = 1).
1∑k=0WWI=KLUIZ_LUIcbg+KLCIZ_LCIcbg+KLSSIZ_LSSIcbg+KLAIZ_LAIcbg
Finally, results were further filtered taking into account additional information related to census and land use data. In particular, the Neighborhood Tabulation Areas (NTA) characterized by the absence of female population, and those characterized by the presences of parks and cemeteries, were not considered for presenting the results of the analysis.
3. Findings
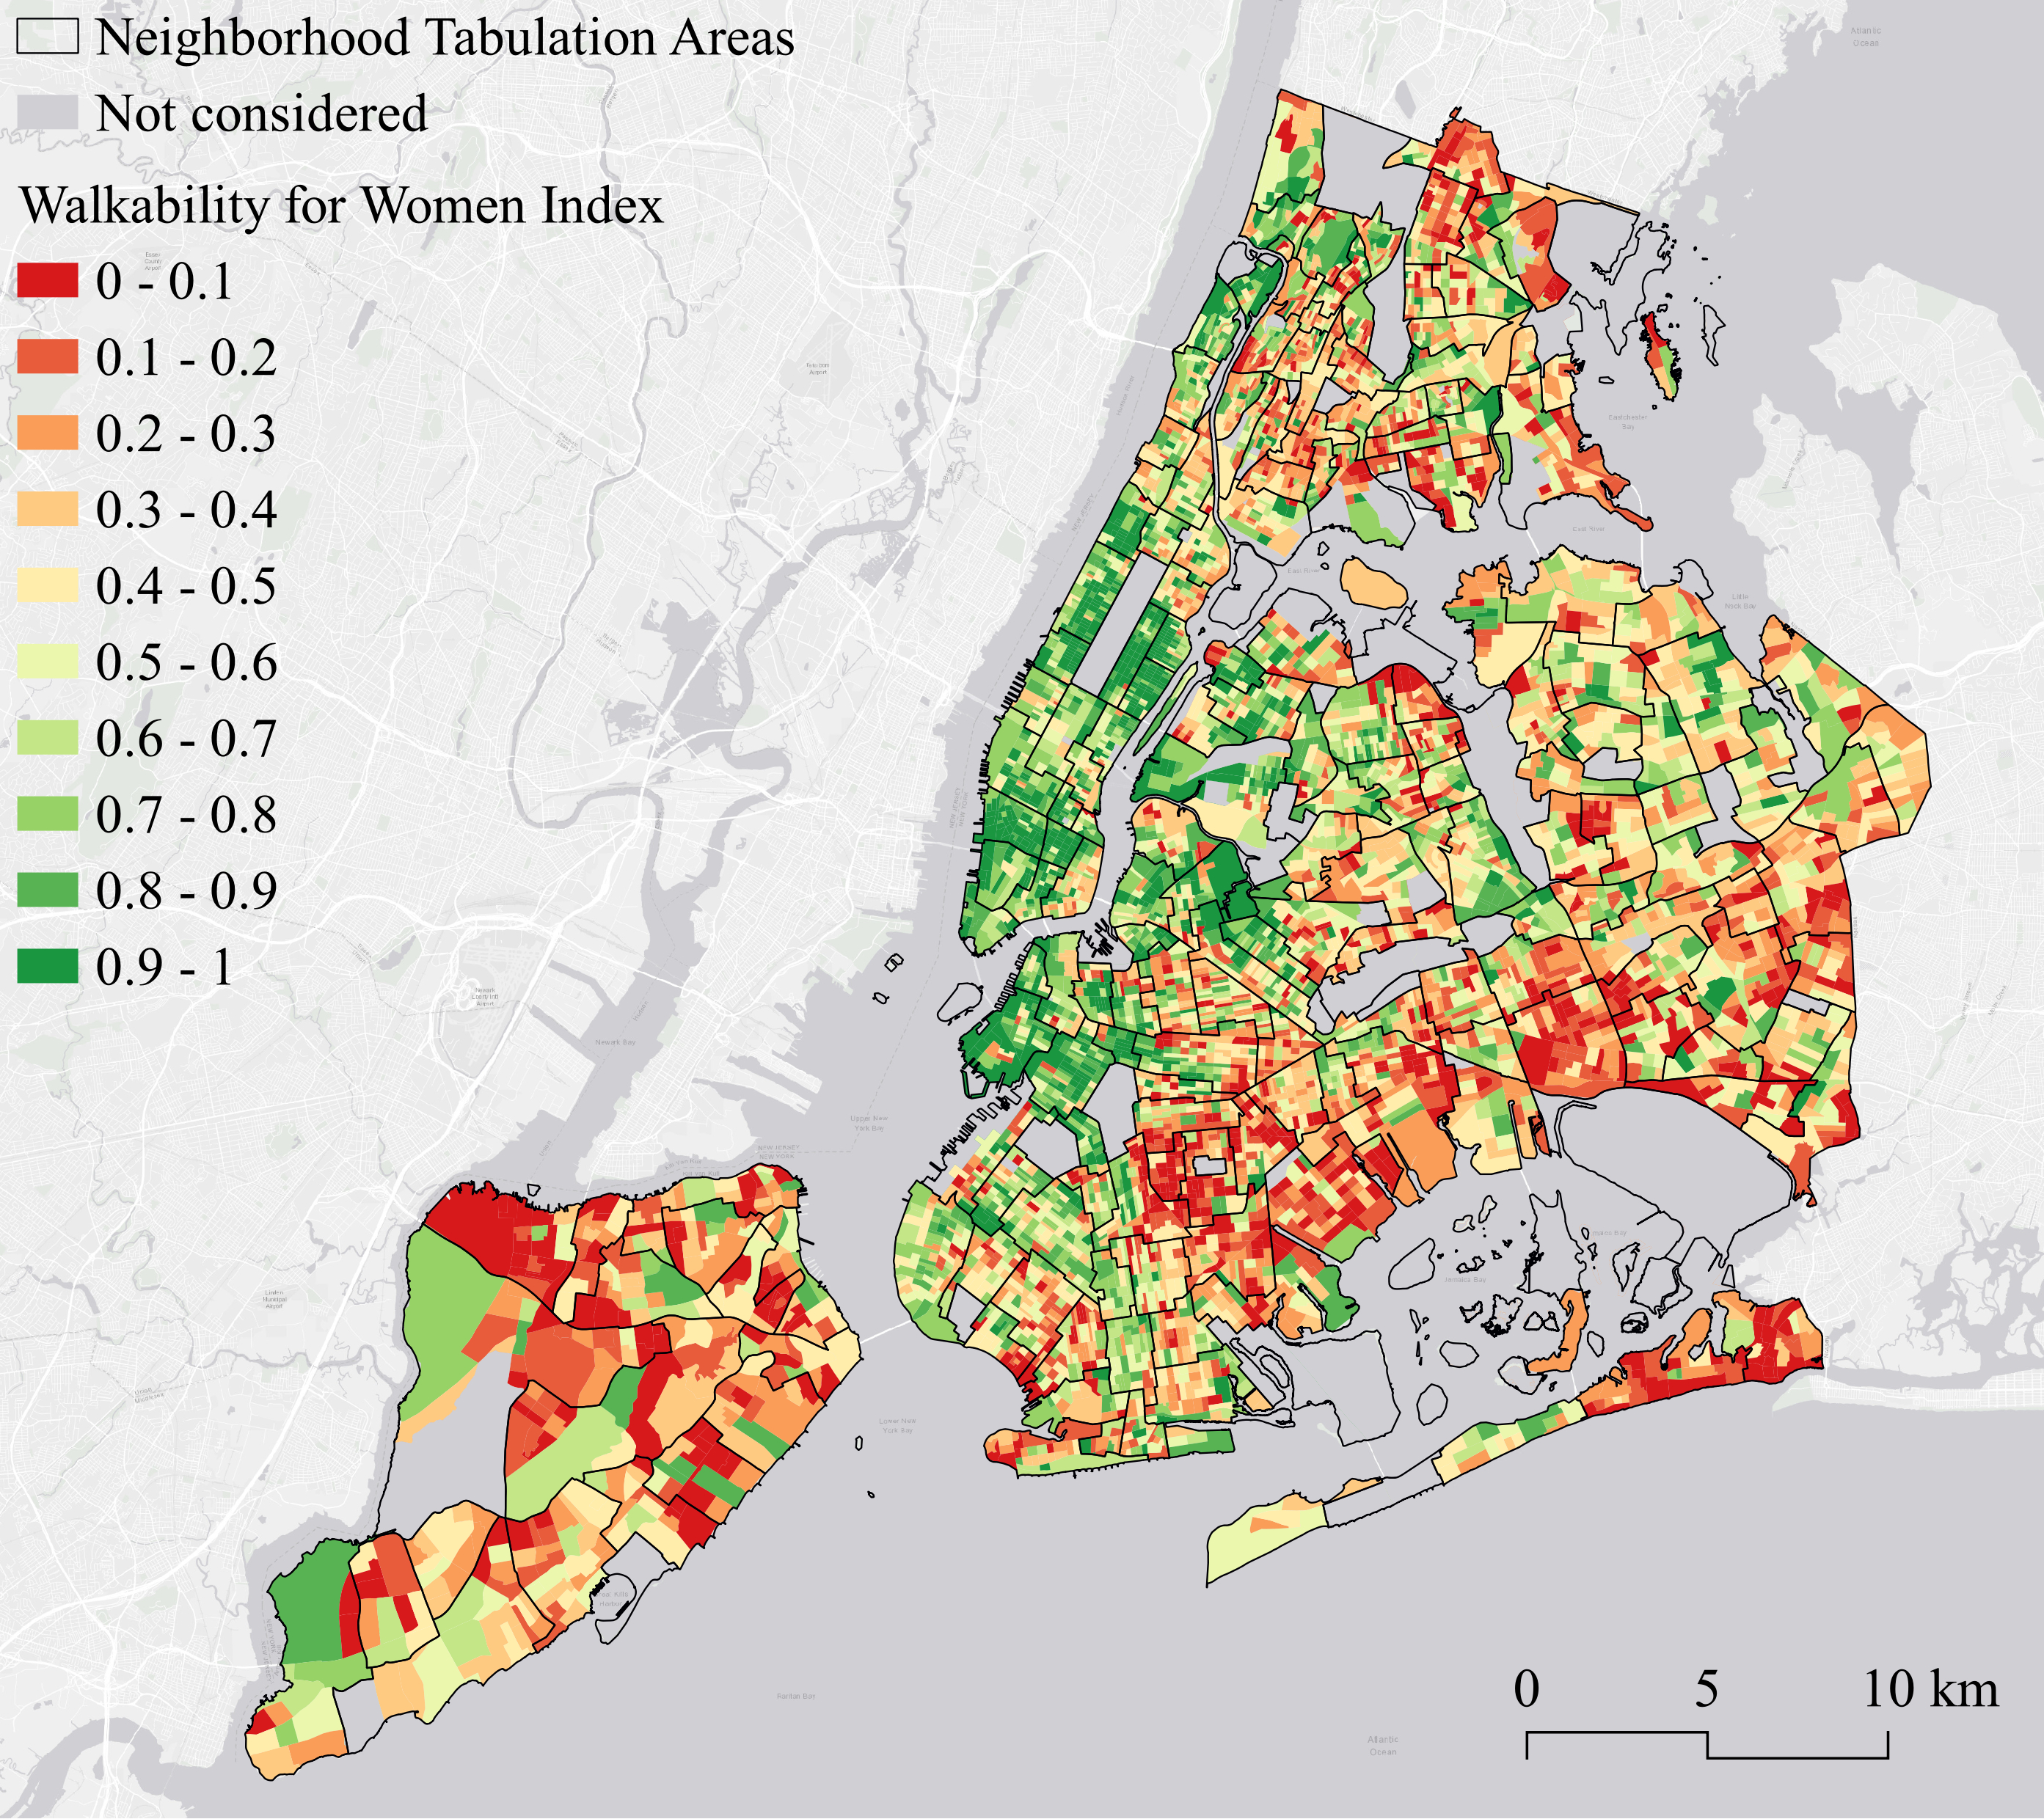
Percentile frequency distribution of results made possible the identification of the census block groups (cbg) and the Neighborhood Tabulation Areas (NTA) (see Figure 1, Figure 2, and Table 3), as characterized by the lowest level of Walkability of Women Index (WWI ≤ 0.291 – 10th percentile). Results helped to identify and characterize a short list of suitable neighborhoods where to prioritize interventions to enhance the level of walkability for women by focusing, for example, on guaranteeing the presence of relevant public services within a walkable distance of 15 minutes from place of residence, and on the installation of surveillance and lighting systems to convey a sense of security. Interventions could be focused on differentiated urban planning strategies specifically tailored to women’s needs, aimed at guaranteeing the presence of relevant public services within a walkable distance, and on the installation of surveillance and lighting systems to convey a sense of security to the city users.
__lci-level_of_comfort_index_(b)__lssi-level_.jpg)
_of_the_census_block_groups_and.jpg)
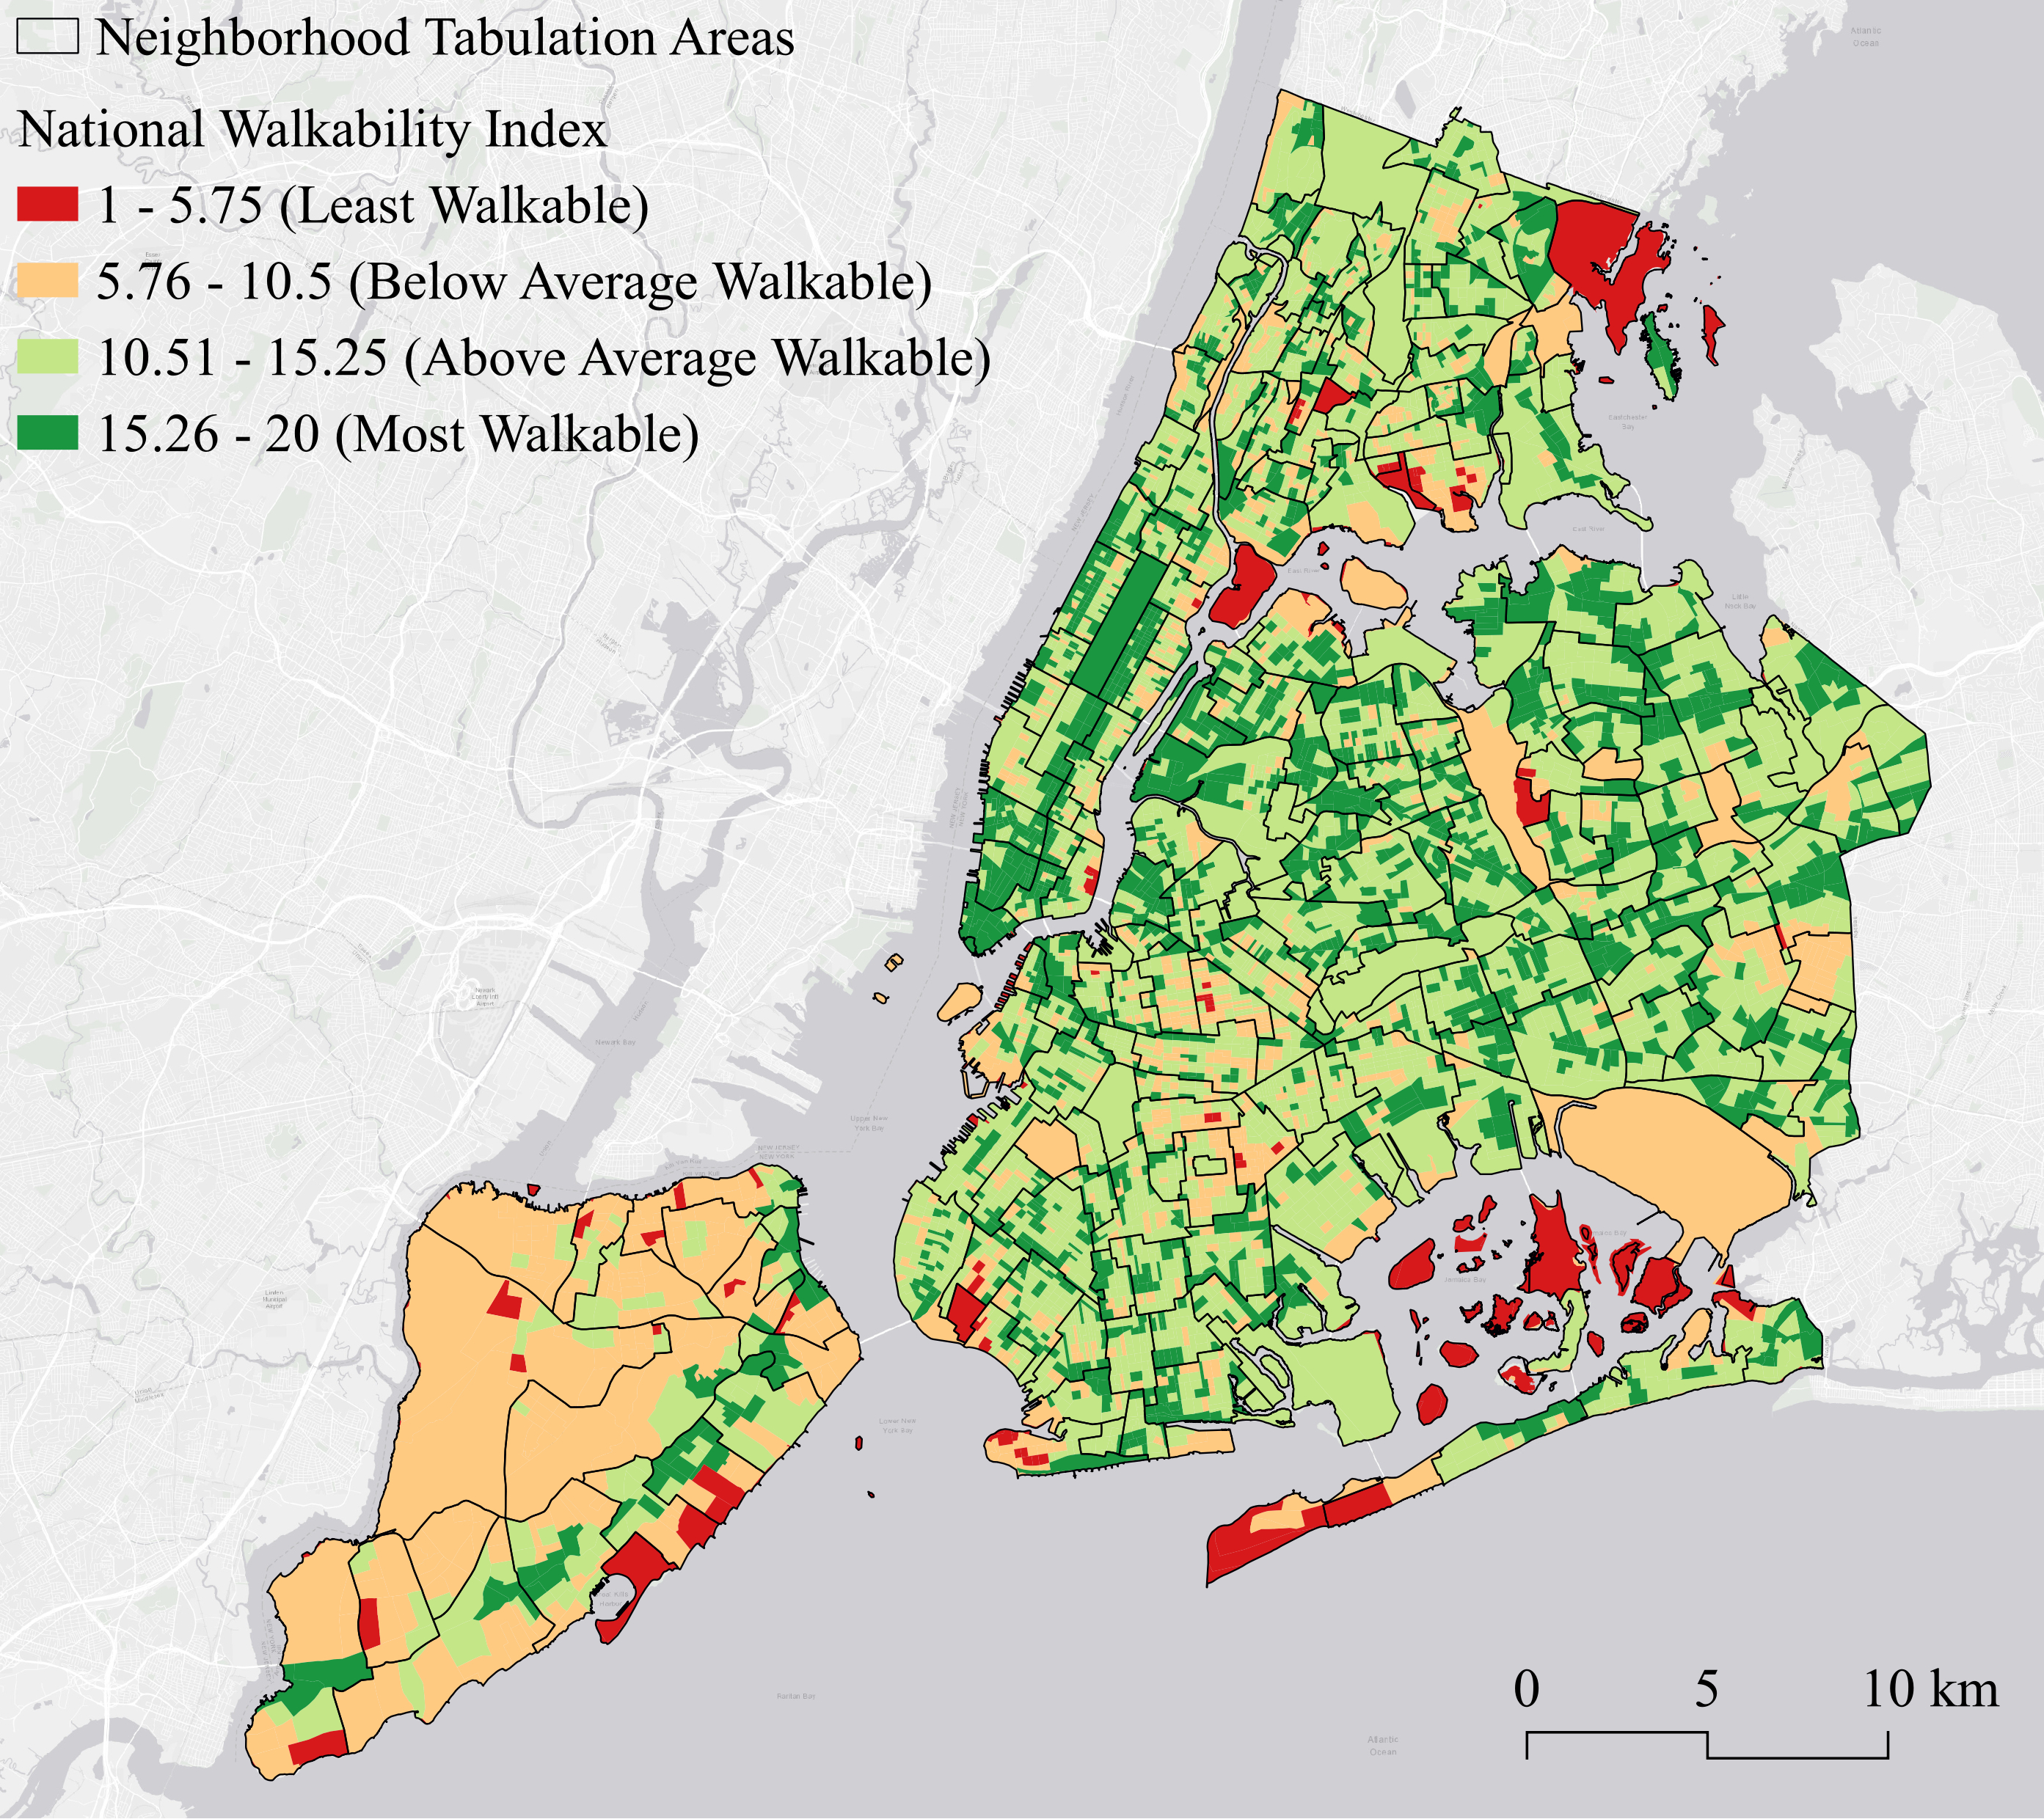
The results of the analysis achieved through the proposed Walkability for Women Index can be compared to available standard walkability measures of walkability in New York City, with particular reference to the National Walkability Index (Agampatian 2014; Thomas and Rourk Reyes 2021). This is an open source nationwide methodology adopted by the United States Environmental Protection Agency to rank all block groups according to their relative walkability (see Figure 3).
_of_the_census_block_groups_and_neighborh.jpg)
A quantitative comparison between the proposed Walkability for Women Index and the National Walkability Index is limited due to the different input data, considering that the NWI is based on selected variables focused on: (i) mix of employment types and occupied housing; (ii) mix of employment types in a block group; (iii) street intersection density (pedestrian-oriented intersections); and (iv) predicted commute mode split. .
However, the current study proposes a qualitative comparison between these two measures, in order to highlight the impact of individual characteristics of pedestrians, namely their gender, on the perceived level of walkability (see Figure 2 and Figure 3). As an example, the NTAs Far Rockaway-Bayswater and Hammels-Arverne-Edgemere (Queens) and Morrisania-Melroseshowed (Bronx) showed worse walkability scores in the WWI than in the NWI due to harassment, obscenity performance rape, sexual crimes and abuses registered in the areas (i.e. security). Moreover, the NTAs of Todt Hill-Emerson Hill and Old Town-Dongan Hills (Staten Island) showed lower values in the WWI than in the NWI, due to the lack of relevant proximity services (i.e. usefulness).
Thus, the Neighborhood Tabulation Areas identified through the proposed WWI could be further investigated through the observations of pedestrian dynamics supported by GPS data, video cameras, and Wi-Fi sensors to collect quantitative information about activity patterns in the city (Gorrini et al. 2021), but also through qualitative data collection methods (e.g., focus groups, audit tools, survey questionnaires, collaborative mapping platforms, co-design laboratories, etc.) focused on the subjective evaluations of women about the level of walkability of a specific area. Moreover, the collected disaggregated data will be used to support the definition of guidelines and policies for the inclusion of women needs in the design of future transport services.
ACKNOWLEDGMENTS
The analyzed data were treated according to the GDPR-General Data Protection Regulation (EU, 2016/679). This research received no specific grant from any funding agency in the public, commercial, or not-for-profit sectors.