Loading [Contrib]/a11y/accessibility-menu.js
Skip to main content
null
Findings
  • Menu
  • Articles
    • Energy Findings
    • Resilience Findings
    • Safety Findings
    • Transport Findings
    • Urban Findings
    • All
  • For Authors
  • Editorial Board
  • About
  • Blog
  • covid-19
  • search

RSS Feed

Enter the URL below into your favorite RSS reader.

http://localhost:54963/feed
Transport Findings
January 06, 2022 AEST

Evaluation of E-Scooter Media Coverage

Or Caspi, Michael J Smart,
E-scooterspublic mediamicromobility
Copyright Logoccby-sa-4.0 • https://doi.org/10.32866/001c.30193
Photo by Kelly Sikkema on Unsplash
Findings
Caspi, Or, and Michael J Smart. 2022. “Evaluation of E-Scooter Media Coverage.” Findings, January. https:/​/​doi.org/​10.32866/​001c.30193.
Save article as...▾
Download all (2)
  • Figure 1. Monthly article attitudes by geographic region, aggregated by month.
    Download
  • Figure 2. Quarterly share of the three main issues discussed in e-scooter media by region.
    Download

Sorry, something went wrong. Please try again.

If this problem reoccurs, please contact Scholastica Support

Error message:

undefined

View more stats

Abstract

This study examines the attitudes and common themes of 840 e-scooter news articles from across the US, published between 2017 to 2020. Sentiment analysis suggests that media coverage does not appear to be predominantly in favor or against shared e-scooters. A word count analysis shows that the most discussed themes were conflicts with other road users, safety concerns, and regulation efforts. The findings reveal differences between regions but also common patterns, such as the decline in negative coverage with time.

1. Questions

The introduction of shared e-scooters across the USA has been accompanied by public criticism, ire, and vandalism. National and local newspapers raised concerns regarding e-scooter safety (Oravetz 2019; Portillo 2018; Tanner 2020a; Zumer 2019) and did not spare their criticism (Brinklow 2018; Edes and Shapiro 2018; LA Times Editorial Board 2019; Marks 2019). Reports of enraged individuals throwing e-scooters into water bodies, burning, and damaging e-scooters arrived from cities such as Los Angeles (Armstrong 2018; Newberry 2018), Portland (Herron 2018), Austin (Bell 2019; Betts 2019; Jones 2018; Sarabia 2018), and others (Barber 2018).

On the other hand, some articles showed optimism regarding e-scooters (Frazer 2018; Gössling 2020b; Levy 2018; Matthew 2018; Reed 2019) while the popularity of shared e-scooters has grown (Schneider 2020; Tanner 2020b), and more cities and communities have allowed these services to operate (NACTO 2019, 2020).

Media coverage research is not a common practice in micromobility research. However, some studies have used content analysis methods to investigate this field from a unique angle. For e-scooters, Yang et al. (Yang et al. 2020) examined reports of e-scooter crashes and found that severe crashes are more likely during nighttime; children and seniors are more severely injured; and women are less involved in deadly crashes, but more in falling-off crashes. In a study of news articles from ten cities worldwide, Gössling (2020a) found that the media overstate the conflicts e-scooter raise about space and safety. Aman, Smith-Colin, and Zhang (2021) examined app-store reviews and found that rider satisfaction varies across topics and gender. Feng et al. (2021) analyzed millions of tweets and examined their patterns.

In this study, we examine the following questions:

  1. What is the sentiment of media coverage about shared e-scooters?

  2. What are the issues discussed in the media coverage of e-scooters?

  3. How did e-scooter media coverage change over time?

  4. Do trends in e-scooter media coverage differ between regions?

2. Methods

This study uses quantitative content analysis methods to examine online local and national news articles discussing shared e-scooters. We collected 840 e-scooter-related online articles from ten US metropolitan areas and separately at the national level (Table 1). We employ sentiment analysis to flag each article’s attitude, and we use word count to identify the most common issues discussed by the media.

Table 1.Newspaper articles used in this study by region and publication.
Region Articles Publications
National 229 The Verge (32), Washington Post (21), Forbes (15), CNN (14), NPR (12), Bloomberg (11), NY Times (10), CNBC (9), Business Insider (8), Curbed (7), Wall Street Journal (7), LA Times (6), Reuters (6), US News (6), USA Today (6), Wired (6), Mashable (5), The Guardian USA (5), Vox (5), Cnet (4), AP (2), CBS News (2), City Lab (Bloomberg) (2), Fox Business (2), Fox News (2), NBC News (2), Observer (2), Time (2), Vice (2), other (14).
Austin, Texas 63 KVUE (ABC) (12), CBS Austin (8), Statesman (USA Today) (8), KUT (NPR) (7), Kxan (NBC) (7), Curbed Austin (6), Austin Chronicle (5), Austin Business Journal (2), Austin Monitor (2), Fox 7 (2), other (4).
Baltimore, Maryland 50 Baltimore Sun (12), CBS Baltimore (12), Baltimore Business Journal (8), Baltimore Fishbowl (7), Fox 45 (5), WBALTV (NBC) (5), SOuthBmOre (1).
Charlotte, North Carolina 51 Charlotte Observer (16), WFAE (NPR) (13), Charlotte Agenda (10), WCNC (NBC) (6), Spectrum News NC (3), WBTV (CBS) (2), WSOCTV (ABC) (1).
Denver, Colorado 53 Denver Post (24), 5280 (6), 9 News (NBC) (6), CBS Denver (4), BusinessDen (2), Denver Business Journal (2), Denver 7 (ABC) (2), Denverite (NPR) (2), other (5).
Los Angeles, California 89 LA Times (22), Curbed LA (11), Santa Monica Daily Press (8), LA Magazine (6), Daily Pilot (LA Times) (4), NBC LA (4), Press-Telegram (4), CBS 2 (3), LAist (3), Long Beach Post (3), Pasadena Star-News (3), ABC 7 (2), LA Daily News (2), other (14).
Portland, Oregon 51 Willamette Week (20), Oregon Live (18), Katu (ABC) (4), KGW (NBC) (4), other (5).
San Diego, California 53 San Diego Union-Tribune (LA Times) (16), NBC San Diego (13), Sdnews.com (8), Kpbs (7), ABC 10 (3), Times of San Diego (2), Voice of San Diego (2), other (2).
San Francisco Bay Area, California 73 SF Chronicle (26), Mercury News (9), Curbed SF (8), SFGate (SF Chronicle) (6), ABC 7 News (5), NBC Bay Area (5), SFist (4), CBS SF Bay Area (2), other (6).
Tampa Bay Area, Florida 50 Tampa Bay Times (17), Tampa Bay Business Journal (11), WFTS (ABC) (6), WTSP (CBS) (6), Florida Politics (3), WFLA (NBC) (2), other (5).
Washington, DC 78 Washington Post (21), Wtop News (CBS) (19), Curbed DC (9), DCist (6), WAMU (NPR) (6), Greater Greater Washington (3), Washingtonian (3), Alexandria Living (2), ARLnow (2) NBC Washington (2), WUSA (CBS) (2), other (3).
Total 840 Affiliations: NBC (64), CBS (62), LA Times (51), Curbed (42), NPR (42), Washington Post (42), Vox (37), MediaNews (36), ABC (35), SF Chronicle (32), The Business Journal (24), Fox (16), USA Today (14), Bloomberg (13), Gothamist (13), Tribune Publishing (12), Bay Area News Group (10), The Agenda (10), San Diego Community Newspaper Group (8), PBS (7), Association of Alternative Newsmedia (6), Hour Media Group (6), Spectrum News (5), other (9), nonaffiliated (243).

In the statistical software R, we used the Tidy Text package (Silge and Robinson 2016), which breaks down the articles into words, removes connecting words (conjunctions, prepositions, and others), and stemming the words (e.g., “injury” and “injuries” become “injuri”).

Using the “Google News Search” engine, we searched for articles from September 2017 to August 2020 – a period of three years since the first introduction of shared e-scooters, with the keywords “scooters” and “scooters city name.” We only selected news articles from known local and national newspapers and media networks and well-known blogs.

We used a dictionary-based approach to sentiment analysis. The affiliation of sentiments is based on pre-prepared unigram dictionaries (Hardeniya and Borikar 2016) – Bing (Jindal and Liu 2008), Afinn (Nielsen 2011), and NRC (Mohammad and Turney 2013). In the classification process, the algorithm counts the appearance of affiliated words in each document, and the output includes the number of appearances of each sentiment (Priyavrat and Sharma 2018; Silge and Robinson 2016). Next, we summed the number of negative and positive sentiment words in each article and summed the negative/positive word balance for each dictionary. We assigned ‘-1’ for negative balance, ‘0’ for equal balance, and ‘1’ for positive balance. The sign of the average for each article provided the final sentiment.

Finally, we counted the words in each examined region and calculated the percent of each word in the corpus. We chose the twenty most common words that can provide insights into the issues discussed in the news articles and grouped them into themes. These themes represent the main issues addressed in the articles.

3. Findings

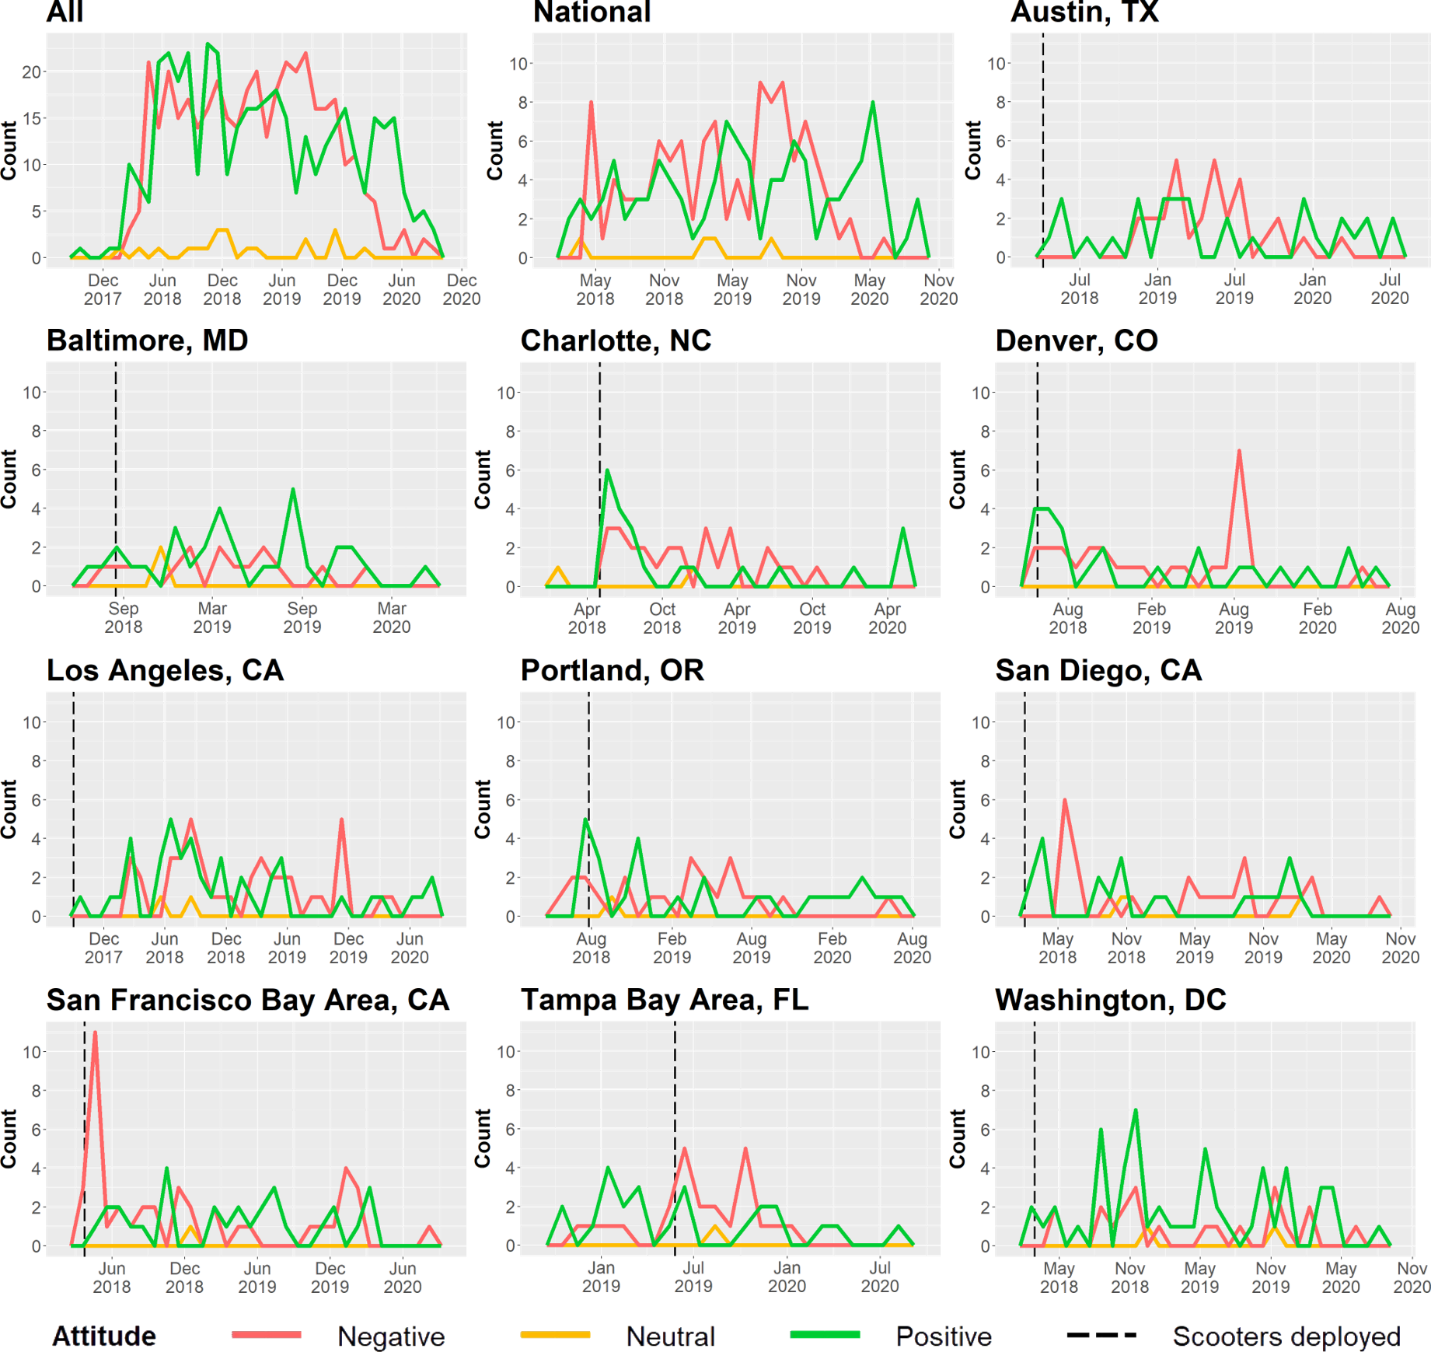
Figure 1 presents the total number of negative, neutral, and positive articles by month across the regions. Overall, the results do not show a clear dominance of one attitude over the other; hence mass media does not appear to be predominantly in favor or against shared e-scooters. Only the national coverage shows dominance of negative coverage most of the time. Washington and Baltimore were dominated by positive coverage, while other regions experienced more balanced e-scooter coverage.

Figure 1
Figure 1.Monthly article attitudes by geographic region, aggregated by month.

* The Y-axis range varies in the different charts.

The introduction of e-scooters in a region was mostly accompanied by positive coverage. In some regions, negative coverage followed, possibly as a reaction to e-scooter’s externalities. Notwithstanding, San Francisco’s and Tampa’s reporters showed an immediate negative response. Interestingly, the number of negative e-scooter articles across the US and in most cities sharply diminished in 2020. That may be linked to the eruption of the COVID-19 pandemic. This trend may suggest the acceptance and the normalization of shared e-scooters by the media.

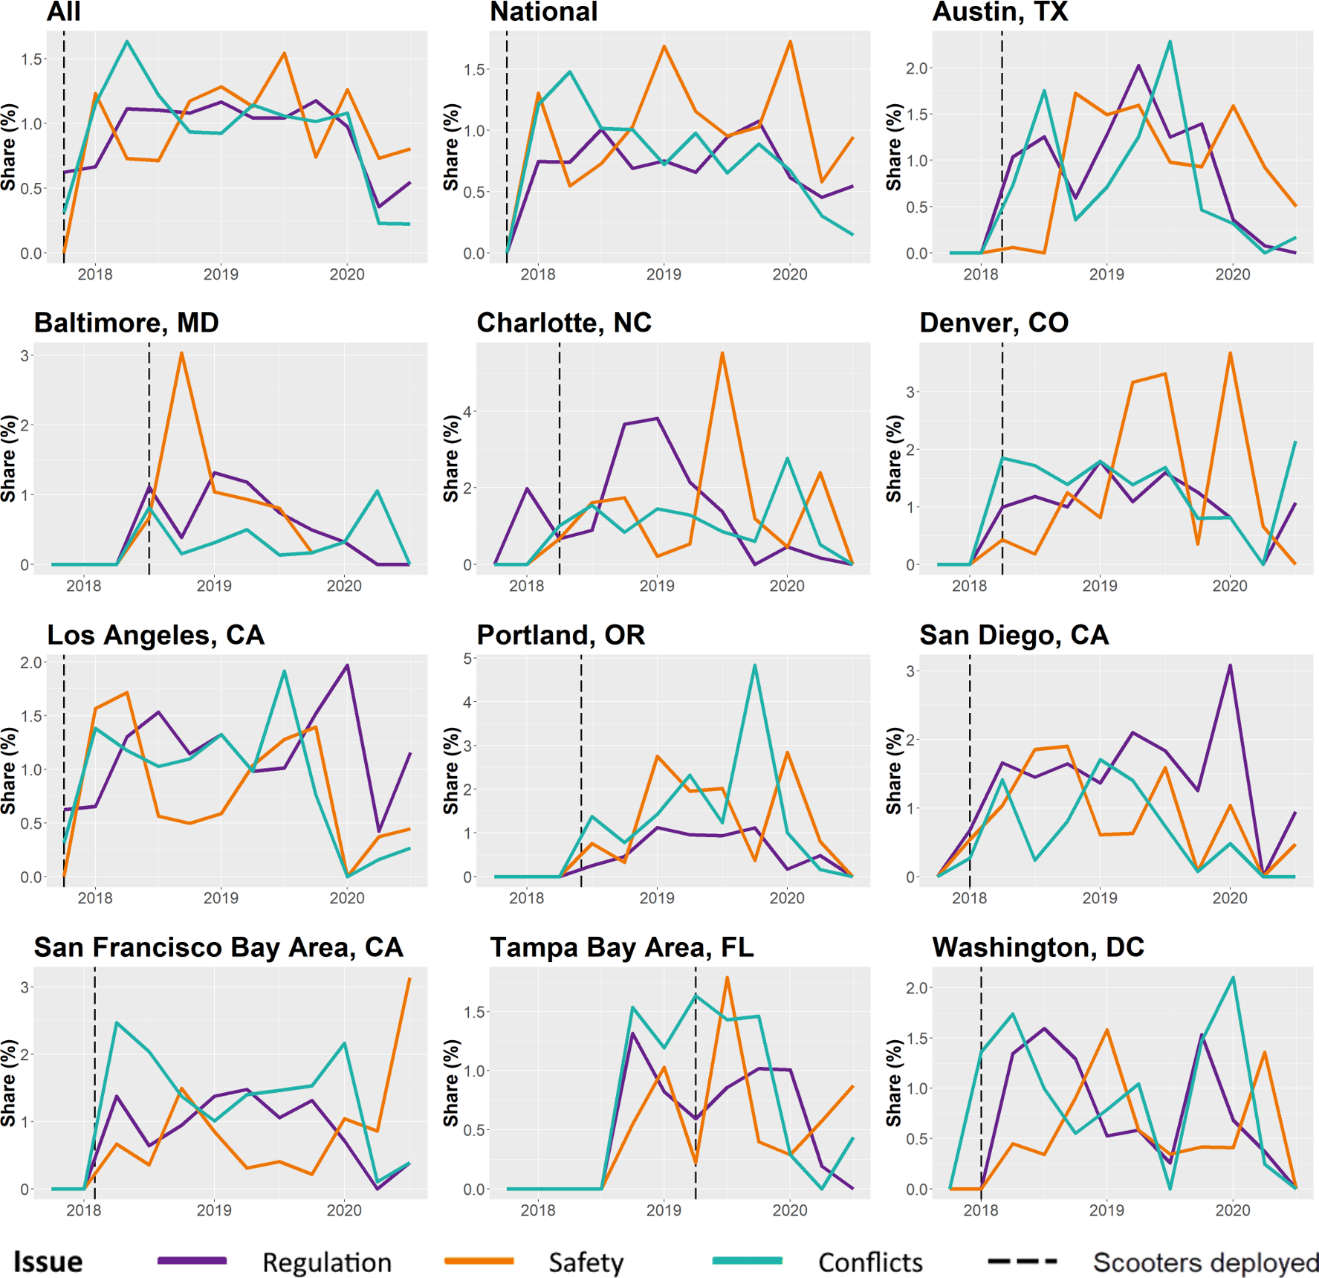
For the word counts, we categorized the twenty most common words into three themes (Table 2): Conflicts – conflicts between e-scooter users and operators to others, primarily pedestrians. Regulation – efforts to organize and regulate e-scooter usage and operation in cities. Safety – safety concerns and health hazards associated with e-scooter users and their surroundings.

The share of these themes in the corpus changed between regions over time (Figure 2). However, safety was the most discussed issue across the entire sample, followed by regulation and conflicts between pedestrians and e-scooters. In most of the regions, conflicts were highly prevalent in media accounts following the introduction of e-scooter services. The national perspective shows a slight move from discussing conflicts to discussing safety, which may present an evolution from concerns to actual incidents.

Table 2.Share of the 20 most frequent words resembling e-scooter issues across the sampled articles. The letters (C), (R), and (S), represent the themes.
Words All National Austin Baltimore San Francisco Charlotte Washington Denver Los Angeles Portland San Diego Tampa
sidewalk (C) .64% .47% .49% .29% 1.17% .90% .61% 1.04% .66% .87% .42% .71%
regul (R) .34% .28% .38% .32% .31% .43% .47% .33% .38% .16% .58% .21%
rule (R) .30% .16% .42% .38% .23% .79% .43% .39% .32% .26% .36% .23%
injuri (S) .27% .33% .39% .31% .17% .32% .11% .45% .12% .31% .26% .18%
helmet (S) .26% .21% .15% .34% .22% .52% .13% .27% .39% .49% .21% .22%
pedestrian (C) .20% .21% .24% .06% .24% .25% .19% .29% .17% .16% .21% .17%
ban (R) .20% .16% .15% .06% .28% .22% .12% .23% .25% .07% .62% .18%
speed .19% .15% .25% .20% .13% .34% .27% .24% .12% .03% .42% .14%
law (R) .19% .18% .12% .22% .22% .20% .06% .26% .24% .12% .26% .22%
concern .14% .10% .12% .19% .08% .10% .16% .19% .16% .24% .27% .18%
safe (S) .13% .09% .08% .15% .17% .19% .14% .13% .12% .15% .22% .16%
access .11% .09% .10% .20% .07% .15% .14% .07% .13% .16% .06% .07%
block (C) .10% .10% .10% .02% .20% .07% .09% .14% .09% .04% .10% .18%
complaint (C) .10% .08% .02% .01% .20% .01% .14% .01% .11% .28% .11% .19%
hit (S) .10% .11% .16% .14% .09% .13% .06% .11% .06% .13% .06% .15%
popular .10% .10% .04% .15% .04% .21% .14% .12% .09% .04% .11% .11%
accid (S) .10% .13% .13% .10% .05% .13% .04% .05% .04% .01% .19% .07%
crash (S) .09% .06% .13% .06% .03% .26% .07% .23% .07% .09% .11% .10%
health (S) .07% .07% .17% .01% .04% .08% .04% .11% .05% .13% .05% .01%
fatal (S) .03% .04% .02% .00% .03% .07% .06% .07% .02% .04% .01% .00%
Conflicts (C) 1.05% .85% .85% .38% 1.81% 1.23% 1.04% 1.49% 1.04% 1.35% .83% 1.24%
Safety (S) 1.04% 1.03% 1.23% 1.10% .80% 1.72% .65% 1.43% .87% 1.35% 1.09% .88%
Regulation (R) 1.03% .78% 1.06% .98% 1.03% 1.65% 1.08% 1.21% 1.19% .61% 1.82% .83%
Figure 2
Figure 2.Quarterly share of the three main issues discussed in e-scooter media by region.

* The Y-axis range varies in the different charts.

Generally, the three subjects were highly discussed throughout the three years. In some cities, one of the issues is less concerned than other issues, such as conflicts in Baltimore and regulation in Portland. That tells about the local experience of each of these regions with the adoption of e-scooters. Sharp peaks in the coverage of one issue in different regions mostly correspond with a sharp increase in negative coverage in that region, sometimes because of a new regulation. For example, eight articles covering the ban of e-scooters from sidewalks in August 2019, five articles covering Uber’s e-scooters suspension in Los Angeles in November 2019, and five articles covering San Diego’s e-scooter boardwalk ban in May 2018.

In addition to the continuous expansion of e-scooter services, our findings suggest that shared e-scooters could become a part of cities’ landscape, finding their niche in urban mobility and being normalized by the public and the media.

Submitted: November 24, 2021 AEST

Accepted: December 07, 2021 AEST

References

Aman, Javad J. C., Janille Smith-Colin, and Wenwen Zhang. 2021. “Listen to E-Scooter Riders: Mining Rider Satisfaction Factors from App Store Reviews.” Transportation Research Part D: Transport and Environment 95 (June):102856. https:/​/​doi.org/​10.1016/​j.trd.2021.102856.
Google Scholar
Armstrong, Mia. 2018. “Now We Have to Worry About Electric Scooters Catching Fire, Too?” Slate Magazine, October 31, 2018. https:/​/​slate.com/​technology/​2018/​10/​lime-electric-scooters-battery-fire-risk.html.
Barber, Megan. 2018. “The Weirdest Places We Found Scooters in 2018.” Curbed. December 21, 2018. https:/​/​www.curbed.com/​2018/​12/​21/​18152121/​electric-scooter-bird-lime-cities-scooters-behaving-badly.
Bell, Jeff. 2019. “Truck full of scooters catches fire in downtown Austin.” kvue.com. June 1, 2019. https:/​/​www.kvue.com/​article/​news/​local/​truck-full-of-scooters-catches-fire-in-downtown-austin/​269-a17ee2cc-ecf9-4c59-b167-783f05f01d5a.
Betts, Kris. 2019. “Dockless scooters are ending up in Austin’s creeks and lakes, causing environmental concerns.” kvue.com. January 4, 2019. https:/​/​www.kvue.com/​article/​news/​local/​dockless-scooters-are-ending-up-in-austins-creeks-and-lakes-causing-environmental-concerns/​269-626246628.
Brinklow, Adam. 2018. “‘Scooters Behaving Badly’ All over San Francisco.” Curbed SF. April 13, 2018. https:/​/​sf.curbed.com/​2018/​4/​13/​17236094/​scooters-motorized-electric-bay-photos-fallen-sf-sidewalks.
Edes, Alyssa, and Ari Shapiro. 2018. “#ScootersBehavingBadly: U.S. Cities Race To Keep Up With Small Vehicle Shares.” All Things Considered. NPR. https:/​/​www.npr.org/​2018/​04/​23/​603140766/​-scootersbehavingbadly-u-s-cities-race-to-keep-up-with-small-vehicle-shares.
Feng, Yunhe, Dong Zhong, Peng Sun, Weijian Zheng, Qinglei Cao, Xi Luo, and Zheng Lu. 2021. “Micromobility in Smart Cities: A Closer Look at Shared Dockless E-Scooters via Big Social Data.” In ICC 2021 - IEEE International Conference on Communications, 1–6. https:/​/​doi.org/​10.1109/​ICC42927.2021.9500821.
Google Scholar
Frazer, John. 2018. “4 Major Reasons Shared Electric Scooters Will Transform Our Cities.” Forbes. December 17, 2018. https:/​/​www.forbes.com/​sites/​johnfrazer1/​2018/​12/​17/​4-major-reasons-shared-electric-scooters-will-transform-our-cities/​.
Gössling, Stefan. 2020a. “Integrating E-Scooters in Urban Transportation: Problems, Policies, and the Prospect of System Change.” Transportation Research Part D: Transport and Environment 79:102230. https:/​/​doi.org/​10.1016/​j.trd.2020.102230.
Google Scholar
———. 2020b. “Zoom By! Why More Big Cities Should Love E-Scooters.” [Text]. The National Interest. The Center for the National Interest. February 6, 2020. https:/​/​nationalinterest.org/​blog/​buzz/​zoom-why-more-big-cities-should-love-e-scooters-120706.
Hardeniya, Tanvi, and Dilipkumar A Borikar. 2016. “Dictionary Based Approach to Sentiment Analysis - A Review.” International Journal of Advanced Engineering, Management and Science 2 (5): 317.
Google Scholar
Herron, Elise. 2018. “There’s an Instagram Account Dedicated to Videos of People Destroying Portland Scooters.” Willamette Week. September 15, 2018. https:/​/​www.wweek.com/​news/​2018/​09/​15/​theres-an-instagram-account-dedicated-to-videos-of-people-destroying-portland-scooters/​.
Jindal, Nitin, and Bing Liu. 2008. “Opinion Spam and Analysis.” In Proceedings of the 2008 International Conference on Web Search and Data Mining, 219–30. https:/​/​doi.org/​10.1145/​1341531.1341560.
Google Scholar
Jones, Kimberley. 2018. “‘Best of’ Scooter Outrage.” November 7, 2018. https:/​/​www.austinchronicle.com/​daily/​chronolog/​2018-11-07/​best-of-scooter-outrage/​.
LA Times Editorial Board. 2019. “Editorial: How Much Responsibility Do Scooter Companies Have for the Bad Behavior of Their Users? A Lot.” Los Angeles Times, July 31, 2019. https:/​/​www.latimes.com/​opinion/​story/​2019-07-30/​scooters-bird-penalties-los-angeles.
Levy, Alon. 2018. “It’s the Cars, Stupid: Scooter Controversy Conceals City’s Inertia on Car Culture - Pedestrian Observations.” Thebaycitybeacon.Com. June 3, 2018. https:/​/​www.thebaycitybeacon.com/​politics/​its-the-cars-stupid-scooter-controversy-conceals-citys-inertia-on-car-culture---pedestrian/​article_5fb0d3e8-6755-11e8-bf3f-4733cb5c7e73.html.
Marks, Howard. 2019. “Opinion | The Nightmare of D.C.’s Sidewalks,” December 20, 2019. https:/​/​www.washingtonpost.com/​.
Matthew, Zoie. 2018. “Could These Little Scooters Be the Future of People Moving? Los Angeles Magazine.” https:/​/​www.lamag.com/​citythinkblog/​urb-e-scooter-pasadena/​.
Mohammad, Saif M., and Peter D. Turney. 2013. “Crowdsourcing a Word-Emotion Association Lexicon.” Computational Intelligence 29 (3): 436–65.
Google Scholar
NACTO. 2019. “Shared Micromobility in the U.S.: 2019.” National Organization of City Transportation Officials. https:/​/​nacto.org/​bike-share-statistics-2017/​.
———. 2020. “Shared Micromobility in the U.S.: 2019.” New York, NY: National Organization of City Transportation Officials. https:/​/​nacto.org/​bike-share-statistics-2017/​.
Newberry, Laura. 2018. “Must Reads: Fed-up Locals Are Setting Electric Scooters on Fire and Burying Them at Sea.” Los Angeles Times, August 10, 2018. https:/​/​www.latimes.com/​local/​lanow/​la-me-ln-bird-scooter-vandalism-20180809-story.html.
Nielsen, Finn Årup. 2011. “A New ANEW: Evaluation of a Word List for Sentiment Analysis in Microblogs” 1103.2903 [cs]. http:/​/​arxiv.org/​abs/​1103.2903.
Google Scholar
Oravetz, Janet. 2019. “More than 60% of Survey Respondents Have Been Involved in a Crash or Near-Miss with an Electric Scooter.” KUSA.Com. March 25, 2019. https:/​/​www.9news.com/​article/​news/​local/​more-than-60-of-survey-respondents-have-been-involved-in-a-crash-or-near-miss-with-an-electric-scooter/​73-8def0d9b-b20c-45d0-8bdd-f99848c382b0.
Portillo, Ely. 2018. “Charlotte Leaders Worry about E-Scooter Safety. Here’s Why They Won’t Regulate Them.” Charlotteobserver. October 22, 2018. https:/​/​www.charlotteobserver.com/​news/​politics-government/​article220438930.html.
Priyavrat, and Nonita Sharma. 2018. “Sentiment Analysis Using Tidytext Package in R.” In 2018 First International Conference on Secure Cyber Computing and Communication (ICSCCC), 577–80. https:/​/​doi.org/​10.1109/​ICSCCC.2018.8703296.
Google Scholar
Reed, Philip. 2019. “Could Electric Scooters like Bird, Lime Help Ease Traffic Congestion, Save Riders Money?” USA TODAY, February 21, 2019. https:/​/​www.usatoday.com/​story/​money/​business/​2019/​02/​21/​electric-scooters-could-bird-lime-rentals-ease-traffic-congestion/​2926267002/​.
Sarabia, Steven. 2018. “Lime Scooters Found Hanging in Several Trees.” [Text Article]. FOX 7 Austin. October 4, 2018. https:/​/​www.fox7austin.com/​news/​lime-scooters-found-hanging-in-several-trees.
Schneider, Benjamin. 2020. “U.S. Scooter Ridership Surged in 2019. Now What?” Bloomberg.Com, August 27, 2020. https:/​/​www.bloomberg.com/​news/​articles/​2020-08-27/​how-big-was-2019-s-scooter-boom-and-what-s-next.
Silge, Julia, and David Robinson. 2016. “tidytext: Text Mining and Analysis Using Tidy Data Principles in R.” Journal of Open Source Software 1 (3): 37. https:/​/​doi.org/​10.21105/​joss.00037.
Google Scholar
Tanner, Lindsey. 2020a. “Electric Scooter Injuries in the U.S. Climb to Nearly 40,000 in Four Years.” USA TODAY, January 9, 2020. https:/​/​www.usatoday.com/​story/​tech/​2020/​01/​09/​electric-scooter-injuries-sent-nearly-40-000-u-s-er/​4421041002/​.
———. 2020b. “Electric Scooter Injuries Surge along with Their Popularity.” San Diego Union-Tribune. January 8, 2020. https:/​/​www.sandiegouniontribune.com/​business/​nation/​story/​2020-01-08/​electric-scooter-injuries-surge-along-with-their-popularity.
Yang, Hong, Qingyu Ma, Zhenyu Wang, Qing Cai, Kun Xie, and Di Yang. 2020. “Safety of Micro-Mobility: Analysis of E-Scooter Crashes by Mining News Reports.” Accident Analysis & Prevention 143 (August):105608. https:/​/​doi.org/​10.1016/​j.aap.2020.105608.
Google Scholar
Zumer, Bryna. 2019. “Serious Scooter Injuries Happen Often, Says Consumer Reports.” WBFF, June 6, 2019. https:/​/​foxbaltimore.com/​news/​local/​serious-scooter-injuries-happen-often-says-consumer-reports.

This website uses cookies

We use cookies to enhance your experience and support COUNTER Metrics for transparent reporting of readership statistics. Cookie data is not sold to third parties or used for marketing purposes.

Powered by Scholastica, the modern academic journal management system