

1. Questions
Over the last year, many studies (da Silva et al. 2021; Hu and Chen 2021; Jiao and Azimian 2021; Liu, Miller, and Scheff 2020; Schneider and Schinkowsky 2021; Tokey 2021) have investigated the change in travel patterns for different transportation modes because of the COVID-19 outbreak. Nevertheless, most of them have not focused on rail transit systems, and they have failed to develop short- and long-term predictions of daily transit ridership during the pandemic, which is critical for transit authorities to manage and optimize their services. Consequently, the aim of this paper is two-fold. First, we performed a data-driven analysis of the impacts of the environmental, transportation, and COVID-19-related factors on the “L” train system (Metro) in the Chicago downtown area. Second, we attempted to use a random forest model to predict the “L” train’s daily ridership during the pandemic based on the aforementioned predictors. Our findings contribute to filling the knowledge gap regarding the pandemic’s impact on daily rail transportation demand patterns in large cities, specific to each transport mode, and propose short- and long-term predictors of future public transport demand.
2. Methods
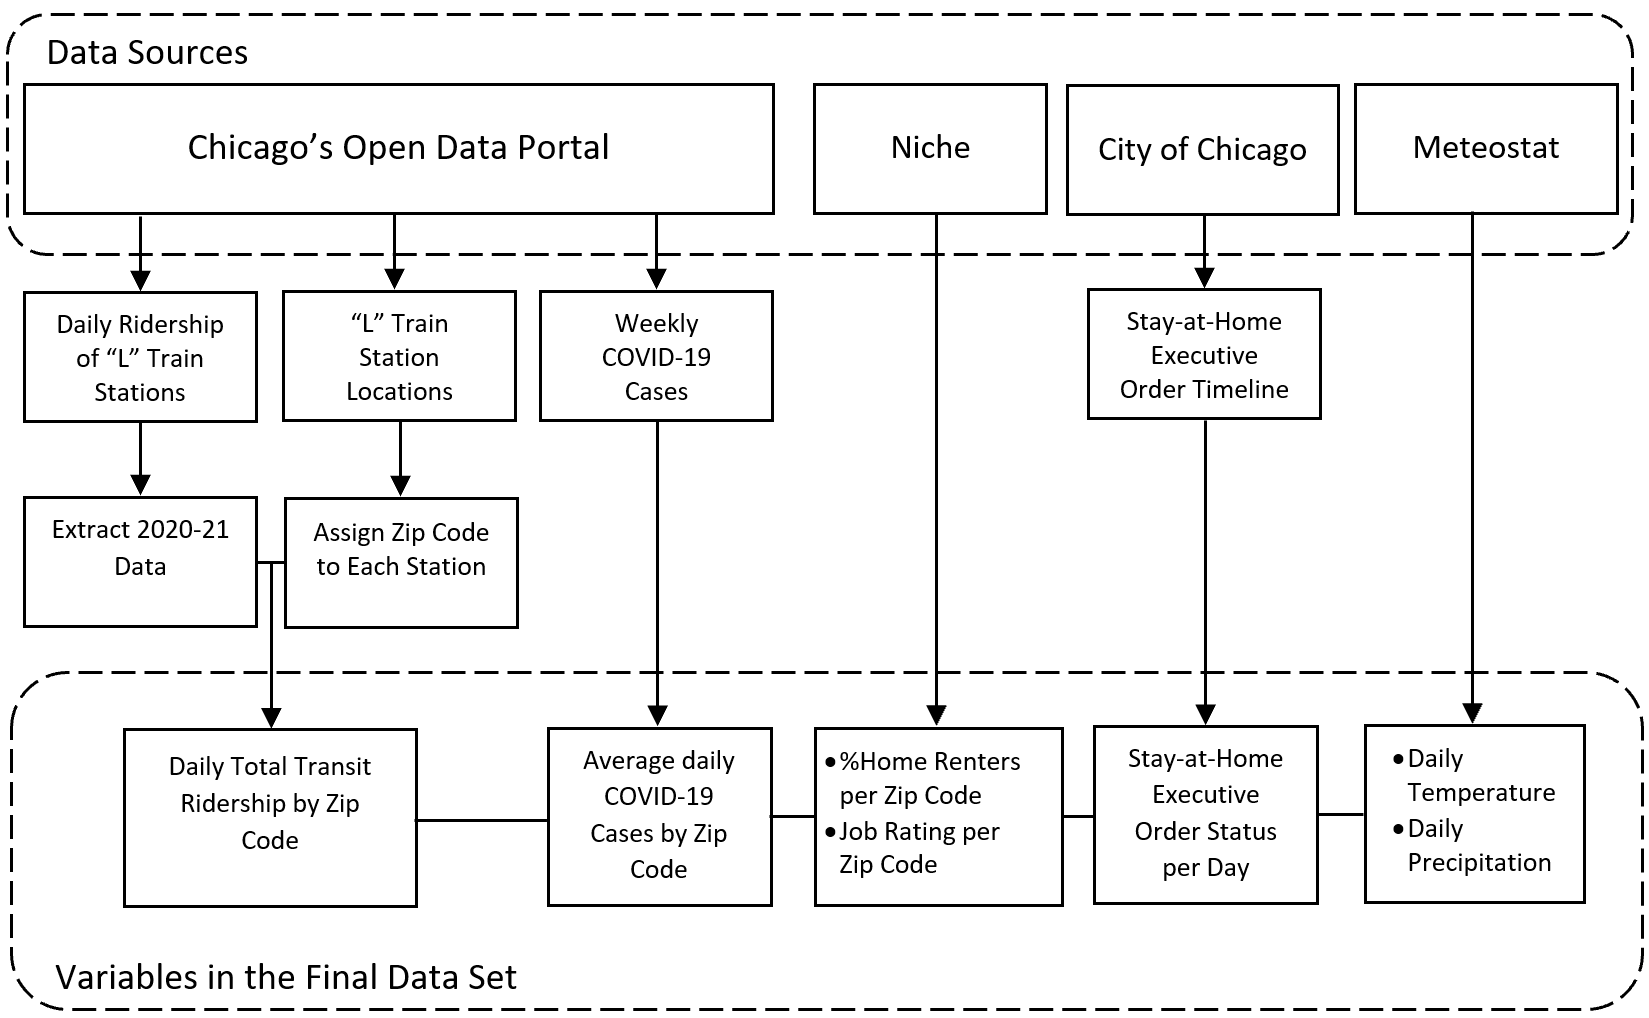
To perform the analysis, we collected various data from different sources, COVID-19 cases, and “L” train total ridership for all stations (entries at all turnstiles) in the Chicago downtown area, including zip codes 60601 through 60605, and 60607, obtained from the Chicago’s open data portal (CTA 2021). Timeline for COVID-19 stay-at-home was derived from the city of Chicago’s official website (https://www.chicago.gov) Percentage of people renting a home/an apartment, and job rating (job availability score) were collected from Niche’s website (https://www.niche.com/), and weather-related data were derived from the Meteostat portal (https://meteostat.net). Figure 1 shows the data collection procedure and the variables used in the model. Additionally, Table 1 represents the summary statistics of the variables used in our model.

As for methodology, we proposed a random forest model to predict the log transform of daily ridership. The random forest approach was first proposed by Ho (1995). Breiman (1996) developed an extension of the approach, which is a machine learning algorithm that combines Breiman’s “bagging” idea and the random selection of features, introduced first by Ho (1995). This method has a reputation for its simplicity and diversity, as it can be used for both classification and regression tasks. In the random forest model, first, the data set is split into training and validation data sets. As for the training data set, we utilized all data in zip codes 60601 through 60605, and 60607, for March 1, 2020, to December 31, 2020, whereas we used data for zip code 60601 for January 1, 2021, to May 31, 2021, for validation. In the next step, many decision trees are randomly created with “boot-strap samples” from the data set. The branching of each tree is determined by randomly selected predictors at node points. The random forest final estimate is the average of all results from each tree. Therefore, each individual tree affects its estimation at certain weights (Yeşilkanat 2020). The random forest algorithm is superior to other machine learning algorithms, as it can randomly receive training data from subsets and form trees with a random algorithm (Panov and Džeroski 2007).
3. Findings
We fitted a random forest to the training dataset (1,836 observations) and generated forecasts of the log transform of transit ridership five months in advance based on test data (151 observations). To assess the model’s performance, we utilized the mean squared error (MSE) and mean absolute error (MAE) as study measures. As shown in Table 2, the estimated MAE and MSE values for the test dataset were slightly higher than those in the training dataset, suggesting that the model’s performance was slightly degraded in the test data. From Figure 2, the model accurately predicted transit ridership in January 2021. Furthermore, the forecast accuracy performed moderately well from early February 2021 until the end of April 2021. However, the predicted values tended to diverge from the actual values in May 2021 and beyond.

To explore the impact of explanatory variables on metro ridership, the relative contributions of those variables were calculated using the permutation method. Relative variable importance values range from 0% to 100%. The most important variable always has a relative importance of 100% and is the basis for measuring less important variables’ relative importance.
As shown in Figure 3, the average temperature contributed the most to predicting ridership, with a relative importance of 100%. This finding is consistent with the findings of Guo, Wilson, and Rahbee (2007), who reported that temperature significantly affects daily transit ridership in the Chicago area. The stay-at-home order, which was 72% as important as the average temperature, ranked second. As discussed in previous works (Jiao and Azimian 2021; Roy 2021), stay-at-home orders mandated all residents to avoid outings except to travel to an essential job. Moreover, many employers switched to remote work, which significantly affected transit ridership.
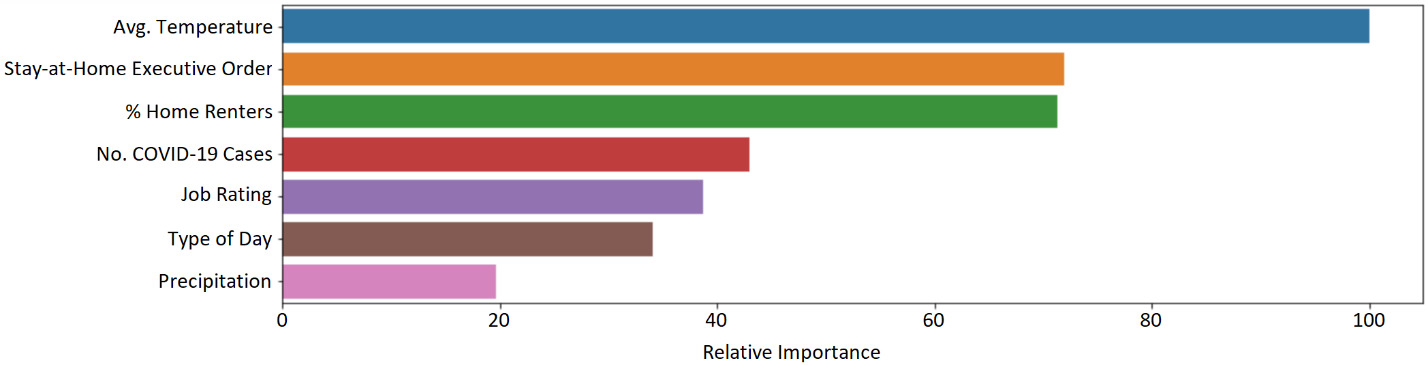
Percentage of home renters, average daily number of COVID-19 cases, and job rating accounted for 71%, 43%, and 38% of relative contributions, respectively. Regarding the percentage of home renters, its high relative importance implied that home renters were more likely to use transit than cars, which is in line with the findings of Pongprasert and Kubota (2017). In terms of the average daily number of COVID-19 cases, we can interpret our findings from two different perspectives. First, the number of COVID-19 cases could be a proxy for risk perception (Liu, Miller, and Scheff 2020). That is, the higher the number of COVID-19 cases, the lower the transit ridership. Second, an increase in transit ridership would pose a risk of COVID-19 transmission to riders and increase the number of COVID-19 cases (Hu and Chen 2021). As for the relative importance of job rating, it is reasonable to believe that areas with higher job rating/opportunities (i.e., downtown) likely attracted a surge of commuters from surrounding areas (Dave et al. 2020), and many favored public transportation because of downtown traffic congestion and high parking fees (Florida 2019). Type of day (weekends/holidays versus weekdays) had a relative importance of 34%, suggesting that ridership would change based on weekdays and weekends (Palaio et al. 2021).This finding is consistent with the fact that passengers mostly commute to workplaces and school during weekdays rather than weekends. Last, precipitation had a relative importance of 19%, and rain and snowfall were likely to have a different influence level on ridership as it varied over a year (Kashfi, Lee, and Bunker 2013).
Regarding research implications, the model developed in this research can be used by transit agencies to accurately predict demand for the “L” train system one month in advance or more, while accounting for the three most important factors (temperature, stay-at-home orders, and percent of home renters). Such a model would assist planners in adjusting their level of service (e.g., frequency) to avoid overcrowding and maintain social distancing during the pandemic. These strategies are even more critical during severe weather when more customers are likely to use rail systems, which increases boarding time and causes trains to fall behind schedule. Last, people with financial uncertainty (e.g., home renters) require more attention as they highly contribute to transit ridership. For example, important changes may include implementing alternate schedules when serious service disruptions do not allow for regularly scheduled service and providing reduced transit fare based on monthly income and rent.
As for future work, this study can be extended by developing a comprehensive model to predict transit ridership in rural or low-density urban areas. In addition, the inclusion of a new temporal variable/measure that accounts for the severity of the various governmental COVID-19 restrictions (e.g., executive orders, advisories, etc.) that periodically limit public space access is needed.