Loading [Contrib]/a11y/accessibility-menu.js
Findings
  • Menu
  • Articles
    • Resilience Findings
    • Transport Findings
    • Urban Findings
    • All
  • For Authors
  • Editorial Board
  • About
  • Blog
  • search

    Sorry, something went wrong. Please try your search again.
    ×

    • Articles
    • Blog posts

RSS Feed

Enter the URL below into your favorite RSS reader.

https://findingspress.org/feed
×
Transport Findings
December 11, 2021 AEST

Urban Road Safety and Crash Severity during the 2020 COVID-19 Pandemic: The Case of Seattle, WA

Haifeng (Felix) Liao, Michael Lowry,
traffic safety collision severity crashes quasi-difference-in-differences analysis spatial-temporal analysis covid-19
Copyright Logoccby-sa-4.0 • https://doi.org/10.32866/001c.30007
Photo by Thom Milkovic on Unsplash
Findings
Liao, Haifeng (Felix), and Michael Lowry. 2021. “Urban Road Safety and Crash Severity during the 2020 COVID-19 Pandemic: The Case of Seattle, WA.” Findings, December. https://doi.org/10.32866/001c.30007.
Save article as...▾
  • PDF
  • XML
  • Citation (BibTeX)
Data Sets/Files (5)
Download all (5)
  • Figure 1. Weekly crash counts(left) and average daily traffic volume(right) in the city of Seattle in 2019 and 2020
    Download
  • Table 1. Descriptive statistics of crashes in the city of Seattle during 2019-2020
    Download
  • Figure 2. Change of weekly counts of crashes in Seattle grouped by different hours of a day: March-May or the lockdown period (left) and June-December or the post-lockdown period (right)
    Download
  • Figure 3. Kernel densities of crash locations in the city of Seattle during 2019-2020
    Download
  • Table 2. DID-based multinomial logistic regression results, crash severity, 2019-2020
    Download

Sorry, something went wrong. Please try again.

If this problem reoccurs, please contact Scholastica Support

Error message:

undefined
×

View more stats

Abstract

Teleworking and lockdown measures implemented during the COVID-19 pandemic have resulted in reduced traffic flows and fewer cars at risk of collision on roads. The present study presents an analysis of the pandemic’s impact on traffic safety and crash severity in the city of Seattle, WA. We found increased shares of speeding-related, angle-, and head-on collisions and relatively more collisions occurring during off-peak hours. Results of quasi-difference-in-differences modeling further suggest that collisions occurring during the post-lockdown period have had a higher probability of being fatal or resulting in severe injuries, compared to what would be expected in the absence of the pandemic.

1. QUESTIONS

The year 2020 witnessed reduced traffic flows in American cities due to public health responses (e.g., lockdowns) and teleworking during the COVID-19 pandemic. The decrease in traffic volumes, however, does not necessarily result in relatively fewer traffic-related fatalities or severe injuries. Drawing upon the case of Seattle, a U.S. city impacted early by the COVID-19 outbreak and throughout the pandemic, the present study aims to examine changes in crash patterns and the level of severity during the pandemic. We sought to answer the following questions:

  • How did the time of the day, the spatial distribution, and the types of vehicle crashes in the city of Seattle change during the 2020 COVID-19 pandemic?

  • How did the pandemic affect crash severity in the year 2020 compared with that in the previous year? And would these impacts vary during different phases of the pandemic?

2. METHODS AND DATA

We collected a motor vehicle collision dataset from the City of Seattle Open Data program. The dataset contains information regarding crashes that occurred between January 1, 2019, and December 31, 2020, as submitted by law enforcement. During the study period, there were a total of 14,122 crashes in the city of Seattle. The crash data include the number of motorists, passengers, pedestrians, and cyclists involved, major contributing factors (e.g., speeding), crash types (e.g., head-on, rear-end, left-turn, sideswipe, etc.); severity (i.e., property damage only or no injury, injury, fatal or severe injury); and others (e.g., location, date, and time of the day).

Besides a descriptive analysis of crash characteristics before and after the pandemic, the study employed a multinomial logistic regression model (Stiles et al. 2021), in conjunction with a difference-in-differences or DID approach, to quantify the impact of the pandemic on crash severity. The empirical model assumes that in the absence of the pandemic, temporal changes in crash severity before and after the onset of the COVID-19 outbreak would be essentially the same in 2020. Therefore, the year 2020 is considered as the “treatment group,” and the periods after the disruption in both 2019 and 2020 are considered as the “aftertreatment periods” (Zhang and Tang 2021; Vandoros 2021). A similar quasi-DID model with previous years as a control group has been utilized in previous studies when a control group is not available during a global pandemic (Vandoros 2020, 2021; Zhang and Tang 2021). Two “aftertreatment periods,” specifically March-May and June-December, were used based on the timeline of the two phases of the pandemic (Jiao and Azimian 2021). Daily average temperature and monthly dummies were also included to control for seasonal conditions (Doucette et al. 2021; Li et al. 2021).

3. FINDINGS

Figure 1 shows weekly trends of traffic volumes and motor vehicle collisions’ counts in the city of Seattle in 2019 and 2020. There appeared to be steep declines in total crashes and traffic volumes during the period when the stay-at-home order was in effect (i.e., from March 3 to May 31st). However, the rebound of vehicle volumes may have started as soon as early April, nevertheless, they remained 20-30% lower compared to 2019 throughout the pandemic.

Figure 1
Figure 1.Weekly crash counts(left) and average daily traffic volume(right) in the city of Seattle in 2019 and 2020

Notes: Traffic flow data in Seattle were retrieved from loop detectors at major highway entrances of Interstates I-5 and I-90, which measure commuter traffic to or from the city of Seattle (Bian et al. 2021).

As illustrated in Table 1, speeding-related crashes accounted for 9.6% of total collisions during the lockdown period of March-May, compared with 2.8% in the previous year; meanwhile, the percentage of head-on collisions doubled during the lockdown period and angles-type collisions’ shares also increased. In contrast, the shares of collisions involving pedestrians or cyclists declined from ~9-10% in the previous year to 7-8%, as did the percentage of crashes where vehicles were rear-ended or sideswiped (Table 1). Specifically, the severity level of these collisions or the share of severe-injury or fatal crashes increased, with 3.3% and 3.2% in March-May and June-December in 2020 respectively, compared with 2.5% and 2.0% during the same periods in 2019.

Table 1.Descriptive statistics of crashes in the city of Seattle during 2019-2020
2019 2020
January-February March-May June-Dec. January-February March-May June-Dec.
Total crashes 1,264 2,187 5,333 1,363 1,061 2,914
Mean crashes per day 24.06 23.77 24.92 23.10 11.53 13.62
Daily traffic volumes 879,497 998,570 986,570 946,707 599,932 768,175
No injury or property damage only crashes (%) 66.06 64.52 64.32 68.97 62.11 62.83
Injury crashes (%) 32.04 33.01 33.68 29.42 34.59 33.97
Fatal or severe-injury crashes (%) 1.90 2.47 2.01 1.61 3.30 3.19
Peak hours (6 am -9 am or 4 pm - 7 pm, %) 41.77 43.94 43.62 45.56 37.04 39.84
Weekend (%) 20.02 23.64 23.53 22.74 23.75 23.20
Speeding (%) 4.75 2.79 4.22 4.84 9.61 5.94
Angles (%) 19.62 20.48 20.27 21.94 22.05 22.72
Head On (%) 1.74 0.87 1.03 2.05 1.70 1.58
Cycles (%) 2.85 5.17 4.37 2.35 3.58 3.81
Pedestrian (%) 6.65 5.07 6.08 6.60 3.68 4.32
Rear Ended (%) 16.69 17.06 16.89 17.98 15.65 16.71
Parked Car (%) 21.04 21.12 19.05 17.90 20.83 17.02
Sideswipe (%) 10.36 11.43 12.15 11.74 8.77 9.81
Left Turn (%) 7.52 7.45 7.84 6.53 6.31 7.55
Right Turn (%) 1.50 1.55 1.28 1.69 1.70 1.61
Other (%) 12.03 9.69 11.04 11.23 15.83 14.86

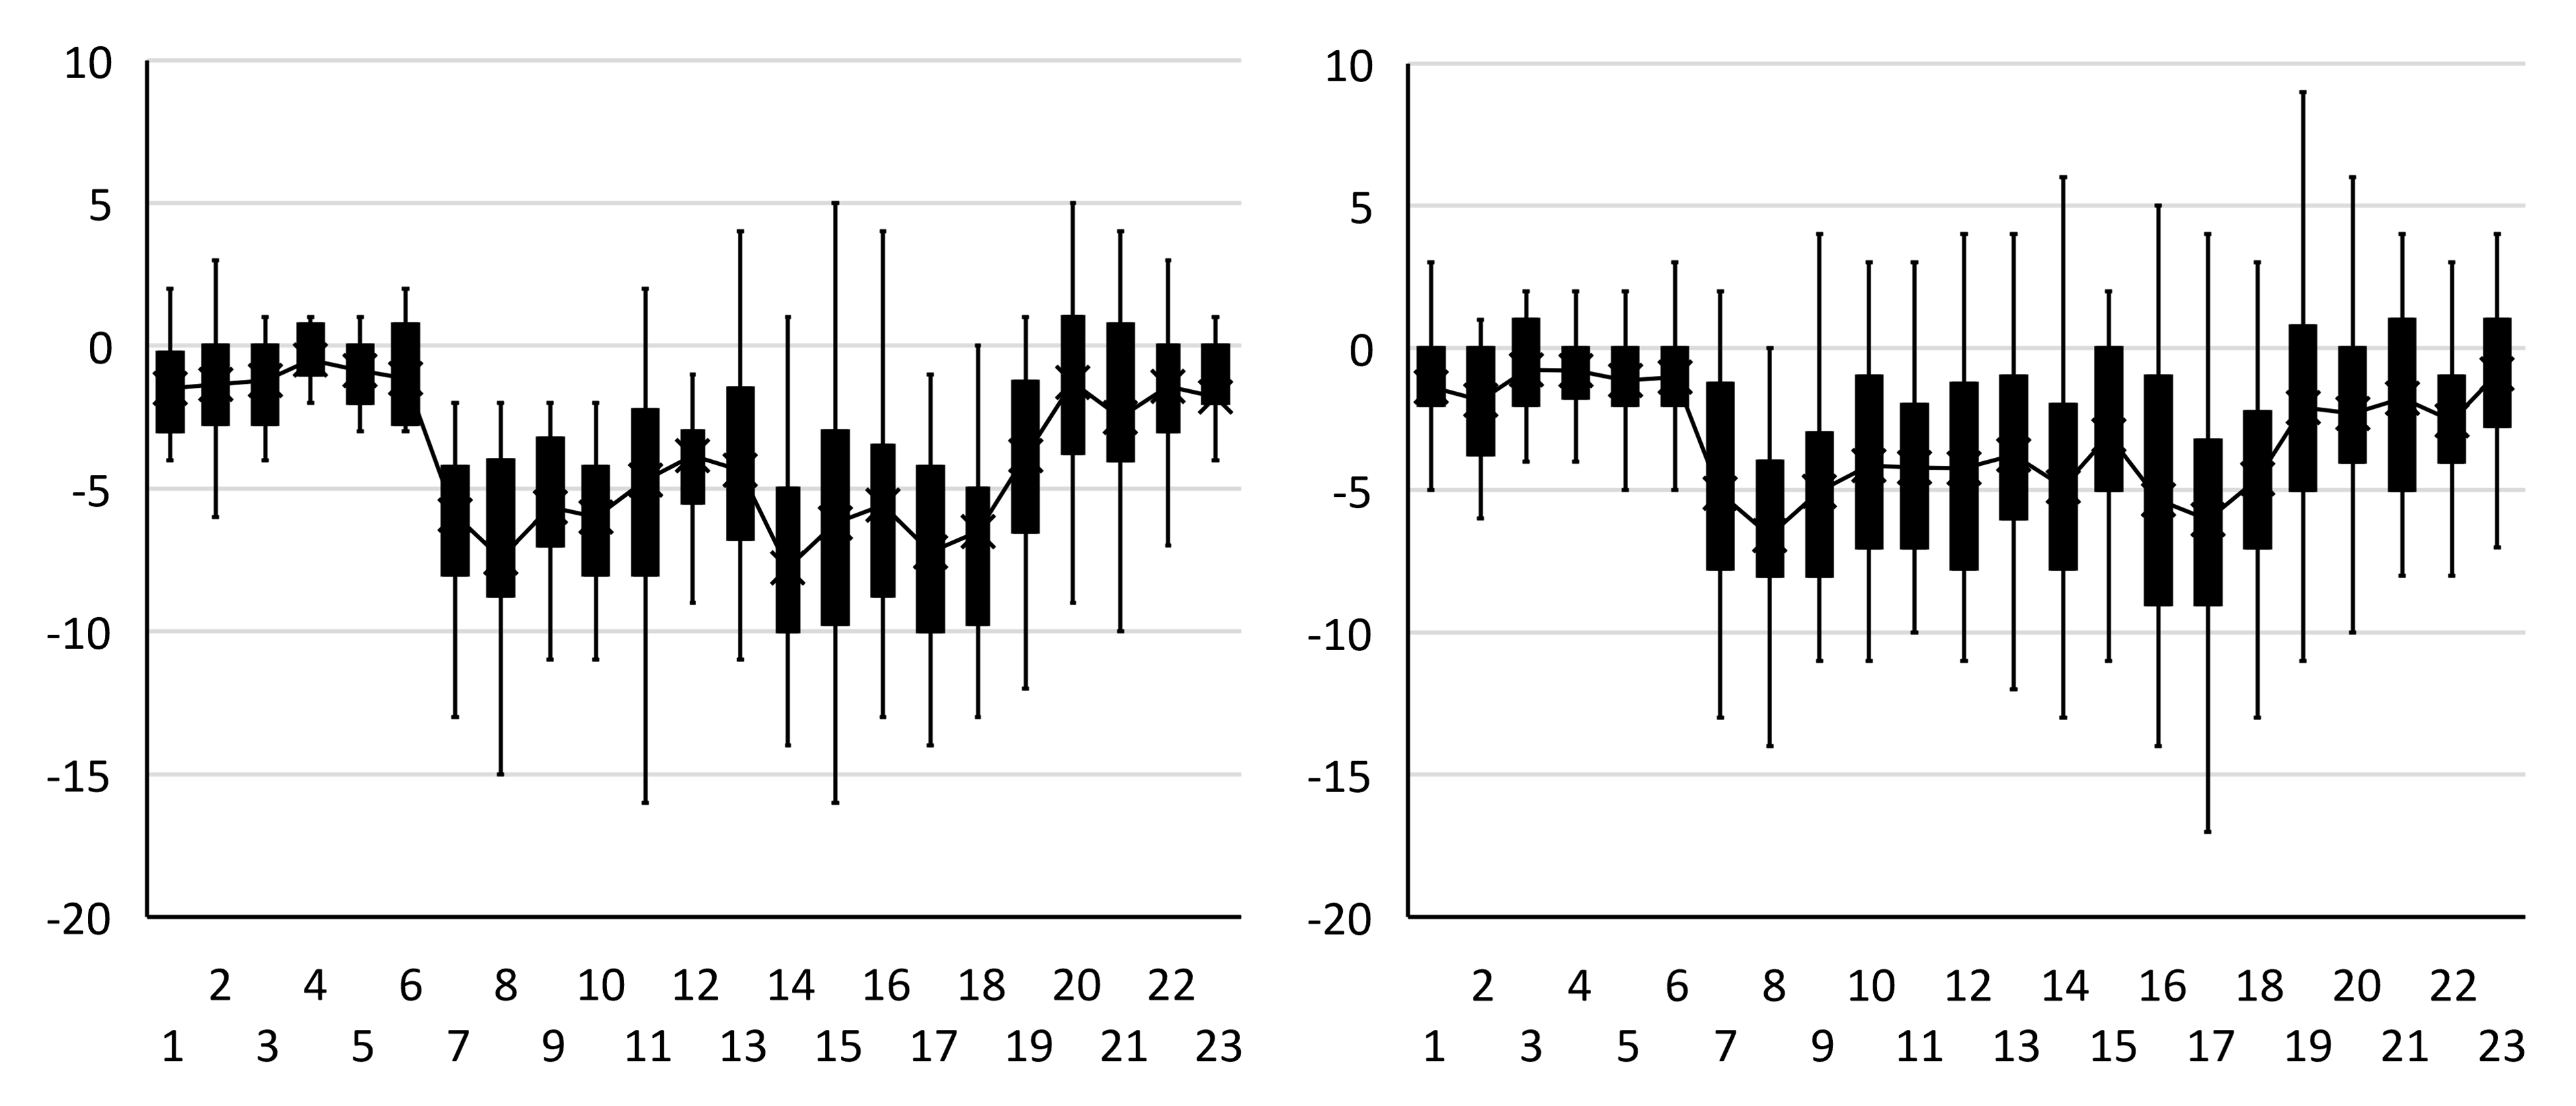
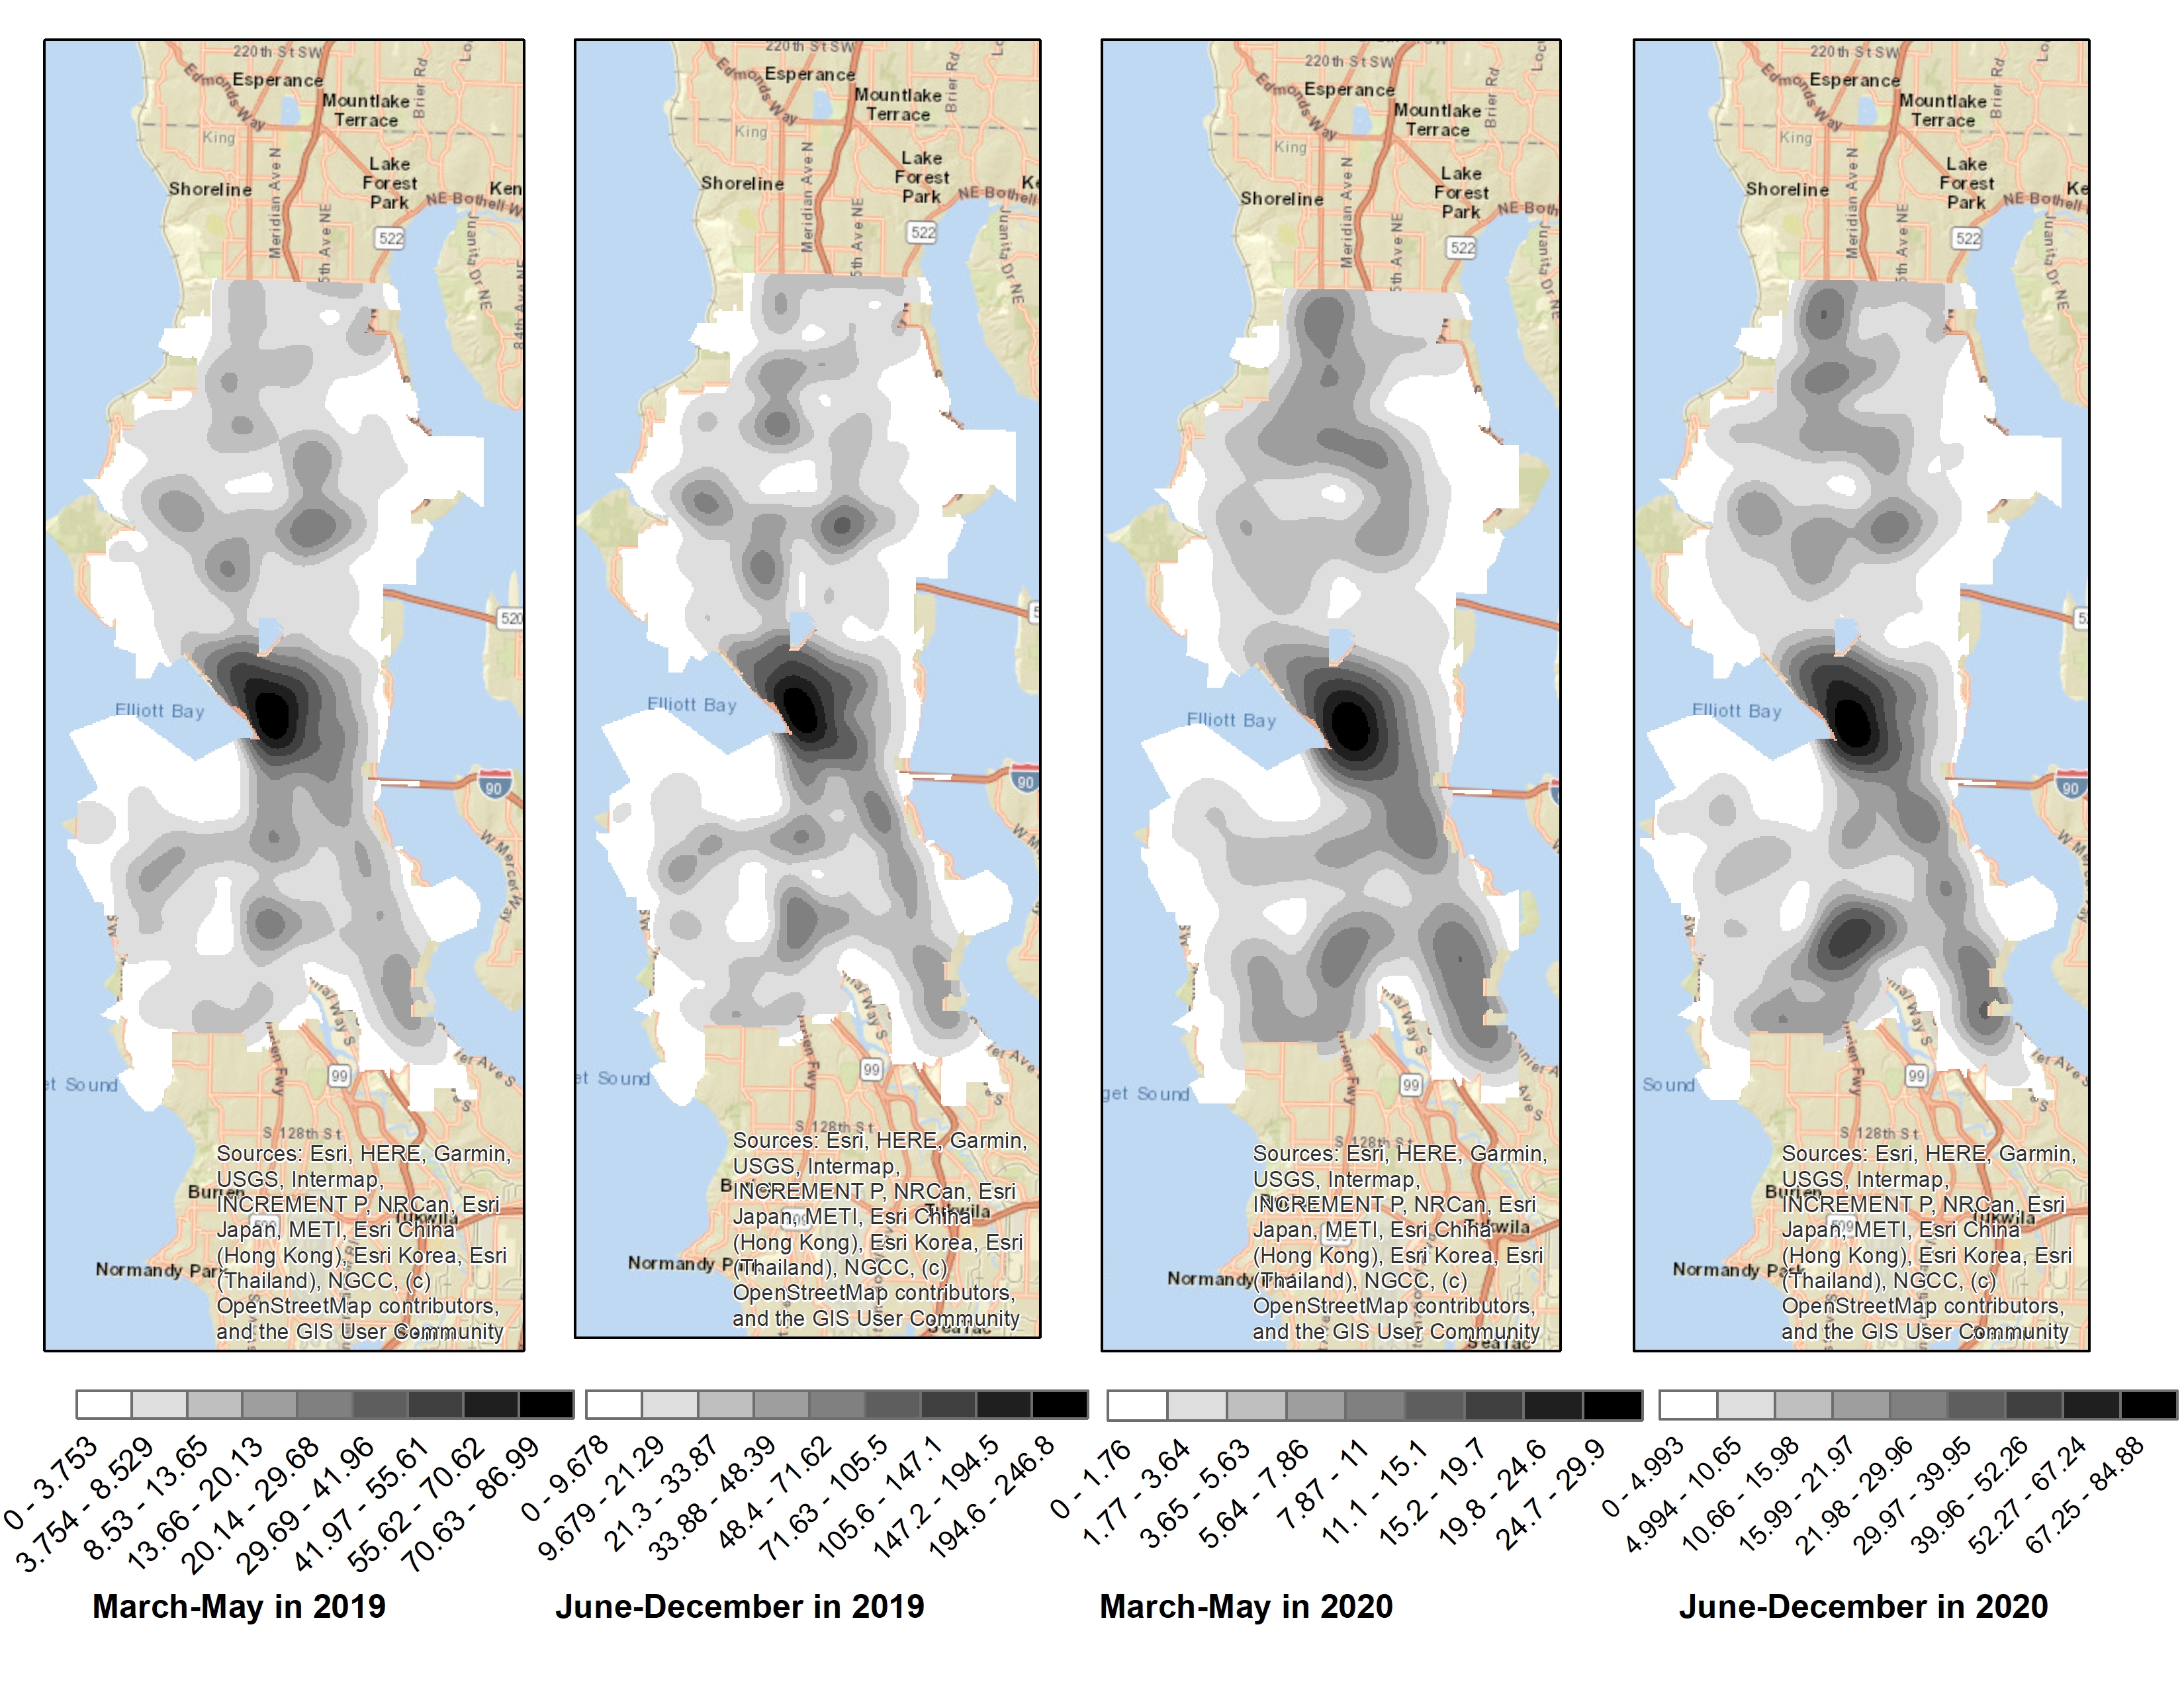
As shown in Figure 2, crashes were also more likely to occur before or after the peak travel times throughout the pandemic in 2020. Moreover, we performed a kernel density estimation on crash locations during the two phases of the pandemic (Figure 3). Despite decreases of kernel densities in 2020, the spatial distribution of crashes appeared similar to the patterns before the pandemic. However, there was a new hotspot in southwestern areas of the city, and crash locations appeared to be spatially more dispersed.

Figure 2
Figure 2.Change of weekly counts of crashes in Seattle grouped by different hours of a day: March-May or the lockdown period (left) and June-December or the post-lockdown period (right)
Figure 3
Figure 3.Kernel densities of crash locations in the city of Seattle during 2019-2020

The results of DID- or difference-in-differences- based multinomial logistic regression on crash severity (i.e., no injury, injury, severe injury or fatal) are summarized in Table 2. First, we found that compared to what would be expected in the absence of the pandemic, collisions occurring during the lockdown period of March-May had a significantly higher probability of being associated with injuries (RRR: 1.504, 95% CI: 1.16-1.95). More importantly, when controlling for other collision attributes, after the easing of the lockdown order in June, the likelihood of a crash being fatal or resulting in severe injuries significantly increased by 2.48 times (95% CI: 1.25-4.93). Second, the severity level of crashes remained significantly associated with a wide array of other factors such as speeding, weekday vs. weekend driving, pedestrian-, or cyclist involvement, or being a head-on collision (Table 2).

Table 2.DID-based multinomial logistic regression results, crash severity, 2019-2020
Probability of a crash associated with injury Probability of a crash associated with serious injury or fatality
Coef. Sig. RRR Coef. Sig. RRR
Reference group: no injury or property damage only
DID interaction term 1 (lockdown or March-May) 0.408 *** 1.504 0.598 1.818
DID interaction term 2 (post-lockdown or June-Dec.) 0.287 *** 1.332 0.908 ** 2.479
Treatment period dummy (March-May) -0.067 0.935 0.491 1.635
Treatment period dummy (June-May) -0.121 0.886 -0.164 0.849
Treatment group dummy (2020) -0.219 ** 0.804 -0.283 0.754
Peak hours -0.038 0.962 -0.004 0.996
Weekends 0.119 ** 1.126 0.354 *** 1.424
Speeding 0.371 *** 1.449 1.725 *** 5.610
Cycles 2.430 *** 11.358 3.482 *** 32.536
Pedestrian 2.310 1.030 4.219 *** 67.985
Head On 0.030 *** 10.079 1.430 *** 4.180
Rear Ended 0.014 1.014 -1.295 *** 0.274
Parked Car -1.936 *** 0.144 -1.972 *** 0.139
Sideswipe -1.252 *** 0.286 -1.651 *** 0.192
Left Turn 0.106 1.112 0.734 *** 2.083
Right Turn -0.777 *** 0.460 -0.631 0.532
Other -0.762 *** 0.467 0.048 1.049
Daily average temperature 0.017 ** 1.017 -0.006 0.994
Pseudo R square .170

Notes: Robust SEs were used for a more conservative estimate of the RRR or relative risk ratios; DID=difference-in-differences. Climate data were retrieved from the National Climate Data Center’s climate data online database, and from weather stations in Seattle. Coef.=coefficient; Sig.=Significance.

In conclusion, our case study of Seattle suggests that during the 2020 COVID-19 pandemic, despite a substantial decline in the total number of crashes, the remaining crashes had a higher probability of being fatal or resulting in severe injuries compared with what would have been otherwise expected. This finding could be attributed to riskier driving behaviors such as speeding amid the pandemic, as found in other studies (Lee, Porr, and Miller 2020). The study provides additional evidence that during the pandemic, there were also relatively fewer collisions involving pedestrians or bicyclists, whereas more collisions were found to be angle- or head-on crashes, and crashes that occur during the post-lockdown period were more likely to be correlated with adverse outcomes (e.g., fatalities). Future studies on the pandemic’s impact on road safety should pay more attention to changes in vehicle types involved in these collisions, or the ways in which possible higher speed due to lower traffic volumes during the pandemic would affect crash severity if additional datasets or information (e.g., vehicle speed, speed limits or the distribution of traffic signals) are available.


Acknowledgments

This study was funded by a grant from Pacific Northwest Transportation Consortium (Pac Trans), USDOT Transportation Center for Federal Region 10 under the award #69A3551747110.

Data and codes

The data and codes used in this research can be downloaded from the following GitHub repository https://github.com/felixgeo/NYC_SEA_Crashes_COVID19.git

Submitted: August 11, 2021 AEST

Accepted: November 19, 2021 AEST

References

Bian, Zilin, Fan Zuo, Jingqin Gao, Yanyan Chen, Sai Sarath Chandra Pavuluri Venkata, Suzana Duran Bernardes, Kaan Ozbay, Xuegang (Jeff) Ban, and Jingxing Wang. 2021. “Time Lag Effects of COVID-19 Policies on Transportation Systems: A Comparative Study of New York City and Seattle.” Transportation Research Part A: Policy and Practice 145 (March): 269–83. https://doi.org/10.1016/j.tra.2021.01.019.
Google Scholar
Doucette, Mitchell L, Andrew Tucker, Marisa E Auguste, Amy Watkins, Christa Green, Flavia E Pereira, Kevin T Borrup, David Shapiro, and Garry Lapidus. 2021. “Initial Impact of COVID-19’s Stay-at-Home Order on Motor Vehicle Traffic and Crash Patterns in Connecticut: An Interrupted Time Series Analysis.” Injury Prevention 27 (1): 3–9. https://doi.org/10.1136/injuryprev-2020-043945.
Google Scholar
Jiao, Junfeng, and Amin Azimian. 2021. “Exploring the Factors Affecting Travel Behaviors during the Second Phase of the COVID-19 Pandemic in the United States.” Transportation Letters 0 (0): 1–13. https://doi.org/10.1080/19427867.2021.1904736.
Google Scholar
Lee, Jinhyung, Adam Porr, and Harvey Miller. 2020. “Evidence of Increased Vehicle Speeding in Ohio’s Major Cities during the COVID-19 Pandemic.” Findings, June, 12988. https://doi.org/10.32866/001c.12988.
Google Scholar
Li, Li, Lucas M. Neuroth, Edward Valachovic, David C. Schwebel, and Motao Zhu. 2021. “Association Between Changes in Social Distancing Policies in Ohio and Traffic Volume and Injuries, January Through July 2020.” JAMA 325 (10): 1003. https://doi.org/10.1001/jama.2020.25770.
Google Scholar
Stiles, Jonathan, Armita Kar, Jinhyung Lee, and Harvey J. Miller. 2021. “Lower Volumes, Higher Speeds: Changes to Crash Type, Timing, and Severity on Urban Roads from COVID-19 Stay-at-Home Policies.” Transportation Research Record, September, 03611981211044454. https://doi.org/10.1177/03611981211044454.
Google Scholar
Vandoros, Sotiris. 2020. “Excess Mortality during the Covid-19 Pandemic: Early Evidence from England and Wales.” Social Science & Medicine 258 (August): 113101. https://doi.org/10.1016/j.socscimed.2020.113101.
Google Scholar
———. 2021. “COVID-19, Lockdowns and Motor Vehicle Collisions: Empirical Evidence from Greece.” Injury Prevention, May. https://doi.org/10.1136/injuryprev-2020-044139.
Google Scholar
Zhang, Tuo, and Maogang Tang. 2021. “The Impact of the COVID-19 Pandemic on Ambient Air Quality in China: A Quasi-Difference-in-Difference Approach.” International Journal of Environmental Research and Public Health 18 (7): 3404. https://doi.org/10.3390/ijerph18073404.
Google Scholar

Powered by Scholastica, the modern academic journal management system