

1. Questions
Support for policy proposals can be profoundly shaped by how the proposals are framed (Chong and Druckman 2007). Framing effects have been observed across many policy domains including multifamily zoning (Demsas 2021), fuel economy (Long et al. 2021) and public safety (Pickett, Ivanov, and Wozniak 2020).
In this paper we ask three questions: 1) are Americans susceptible to framing effects with respect to transportation policy; 2) does the magnitude of the framing effect vary for different groups; and 3) is the framing effect substantively meaningful?
We hypothesize that loss aversion—the idea that losses are felt more strongly than gains—applies to transportation policy preferences (Kahneman and Tversky 2012). We suspect that there will be less support for reducing driving (a loss) than for shifting trips to other modes (a gain). We hypothesize that the framing effect is large and thus important to those drafting referendums or developing advocacy campaigns.
2. Methods
Data for this study come from a survey of U.S. adults conducted in October 2020. We recruited 600 participants using the firm Prolific (www.prolific.co), a respected source (Palan and Schitter 2018). Participants earned $2.50 for completing the ten-minute survey. We used quotas to recruit a sample that reflects the U.S. population based on age, sex, and race, and then weighted the sample by political orientation, educational achievement, and ethnicity. Weighting was done using an iterative proportional fitting process (Kalton and Flores-Cervantes 2003) with data from the 2019 5-Year American Community Survey (US Census Bureau 2019) and the General Social Survey (General Social Survey 2018). Table 1 shows the unweighted and weighted sample, along with reference data from the U.S. Census.
For this study, we compare responses to two questions from a larger survey (Klein et al. 2021). These questions were formatted as binary responses where respondents had to select between two conflicting statements. This question format offers the same information as more familiar Likert scales (i.e., the direction of opinions), is simpler and quicker to administer (Dolnicar, Grün, and Leisch 2011), and highlights the trade-offs in transportation decision making.
We focus on two survey questions (below) that ask about the broad aims of transportation policy and planning. Both questions include an option to make driving easier or more convenient, but Q1 frames the alternative as a gain (“try to shift more trips toward public transit, walking, and bicycling.”), while Q2 frames it as a loss (“to reduce driving.”).
Q1. Transportation policy should…
a. make it easier for most people to drive for most trips.
b. try to shift more trips toward public transit, walking, and bicycling.
Q2. A central goal of transportation planning should be…
a. to make driving convenient and to eliminate traffic congestion.
b. to reduce driving.
In developing these questions, we had to trade off precision with the risk of detection; ideally the questions would be identical (except for the alternatives), but this would increase the risk that respondents would recognize the similarity and alter their responses for consistency. To minimize this risk, we altered the question wording and asked these questions along with 15 similarly-structured questions (Full survey available here: https://osf.io/yx7aj/). To minimize ordering effects, we randomized question and answer order.
We classify respondents into mutually distinct categories: those who consistently support reform, those who consistently oppose reform, and those who are susceptible to framing effects (i.e., shifted their answer). We assessed whether the framing effect varies for sub-groups using a chi-squared test with Rao & Scott adjustment. Finally, to determine whether the framing effect is substantively meaningful, we compared support for “shifting trips” and “reducing driving” for the entire sample and eight sub-groups (gender, age, race/ethnicity, education, political orientation, share of workers who commute by automobile (US Census Bureau 2019), number of cars per adult in the household, and traveler type (see Ralph 2016). In calculating population estimates, we use weighted data, calculate Wald-type intervals for population-level proportions, and graph the associated error bars.
3. Findings
A third of respondents (34%) were subject to framing effects. That is, they preferred to shift trips, but not reduce driving (Table 2). Most of the remaining respondents consistently supported or opposed transportation reform regardless of how the question was framed (29 and 34% respectively). A very small number (n = 15 or 3% of respondents) were inconsistent; they preferred to reduce driving but not shift trips.
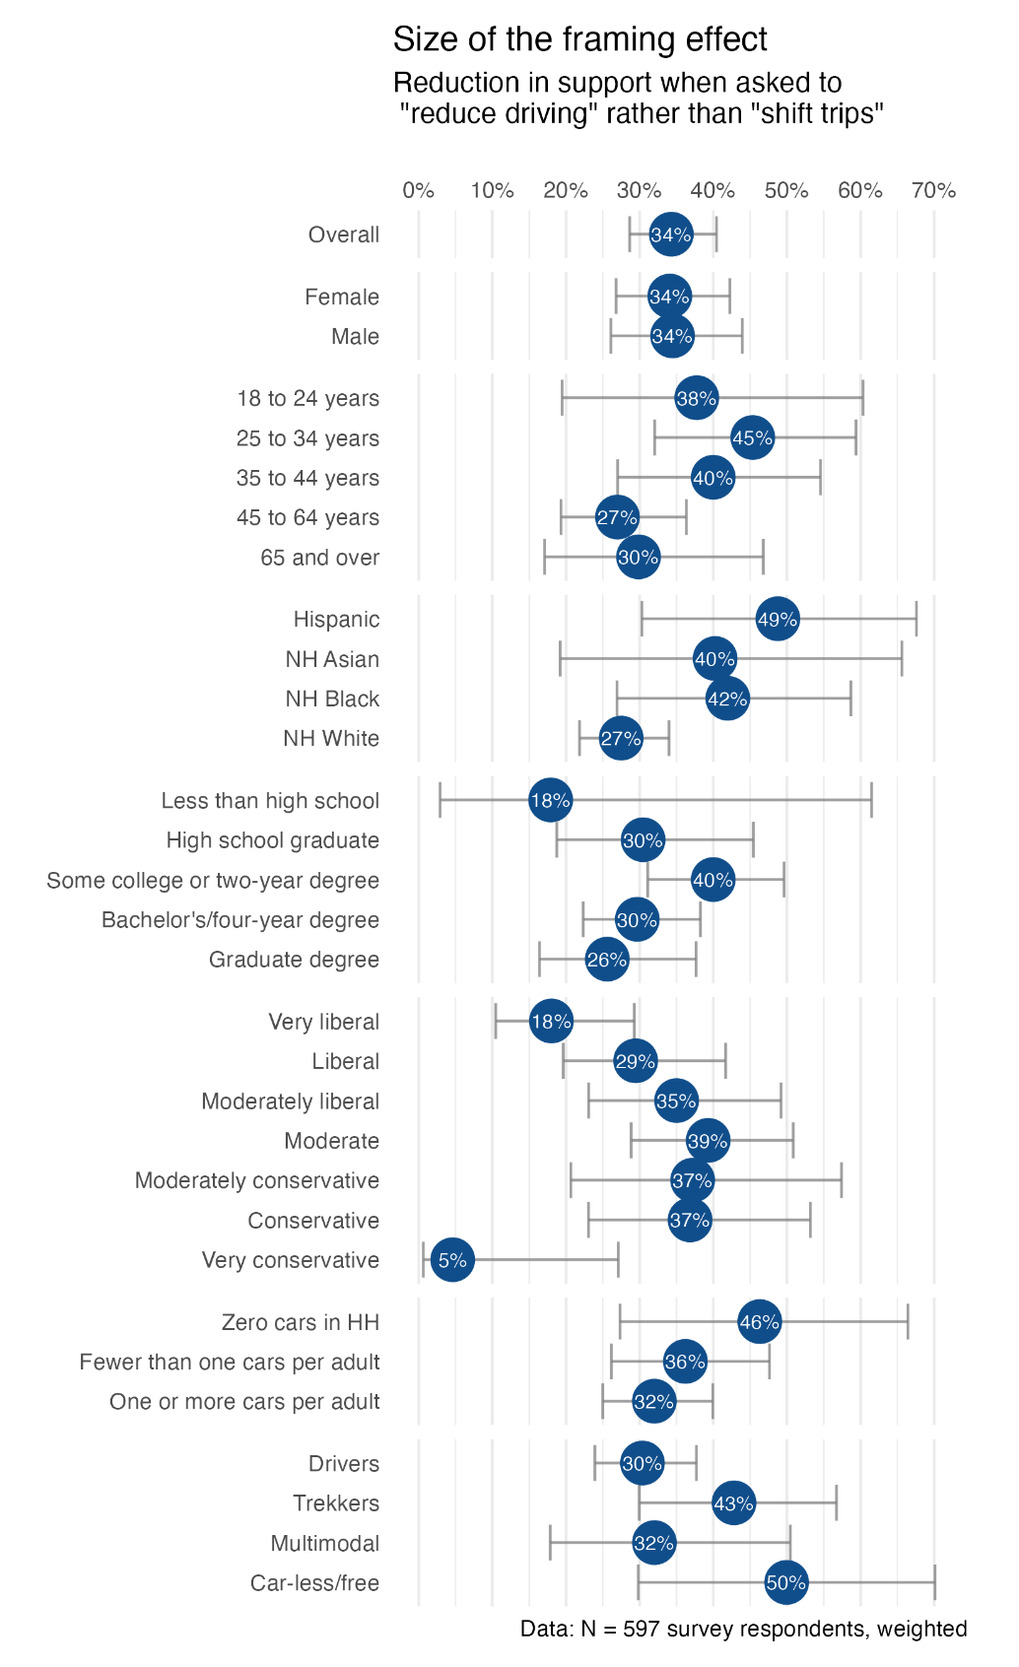
Figure 1 shows the magnitude of the framing effect for eight sub-groups. Because the sample sizes are relatively small for some groups, the error bars for the population estimate are rather wide. Only one group had a framing effect that differed significantly from the overall sample value of 34%; Very Conservative respondents were less susceptible to framing effects than their peers.
Finally, the framing effect is large and substantively meaningful; in a public referendum it would make the difference between electoral victory and defeat. Figure 2 illustrates how overall support for each frame varies by personal characteristics. “Shift trips” polled at 63% and enjoyed majority support among nearly every sub-group. The only exceptions were political Conservatives and those with less than a high school degree. In fact, shifting trips achieved supermajority support (>66%) for many sub-groups including Moderates and Liberals, people ages 25 to 44, people of color, those who lack a car, and those who frequently walk, bike, or ride transit (Multimodal and Car-less/free).
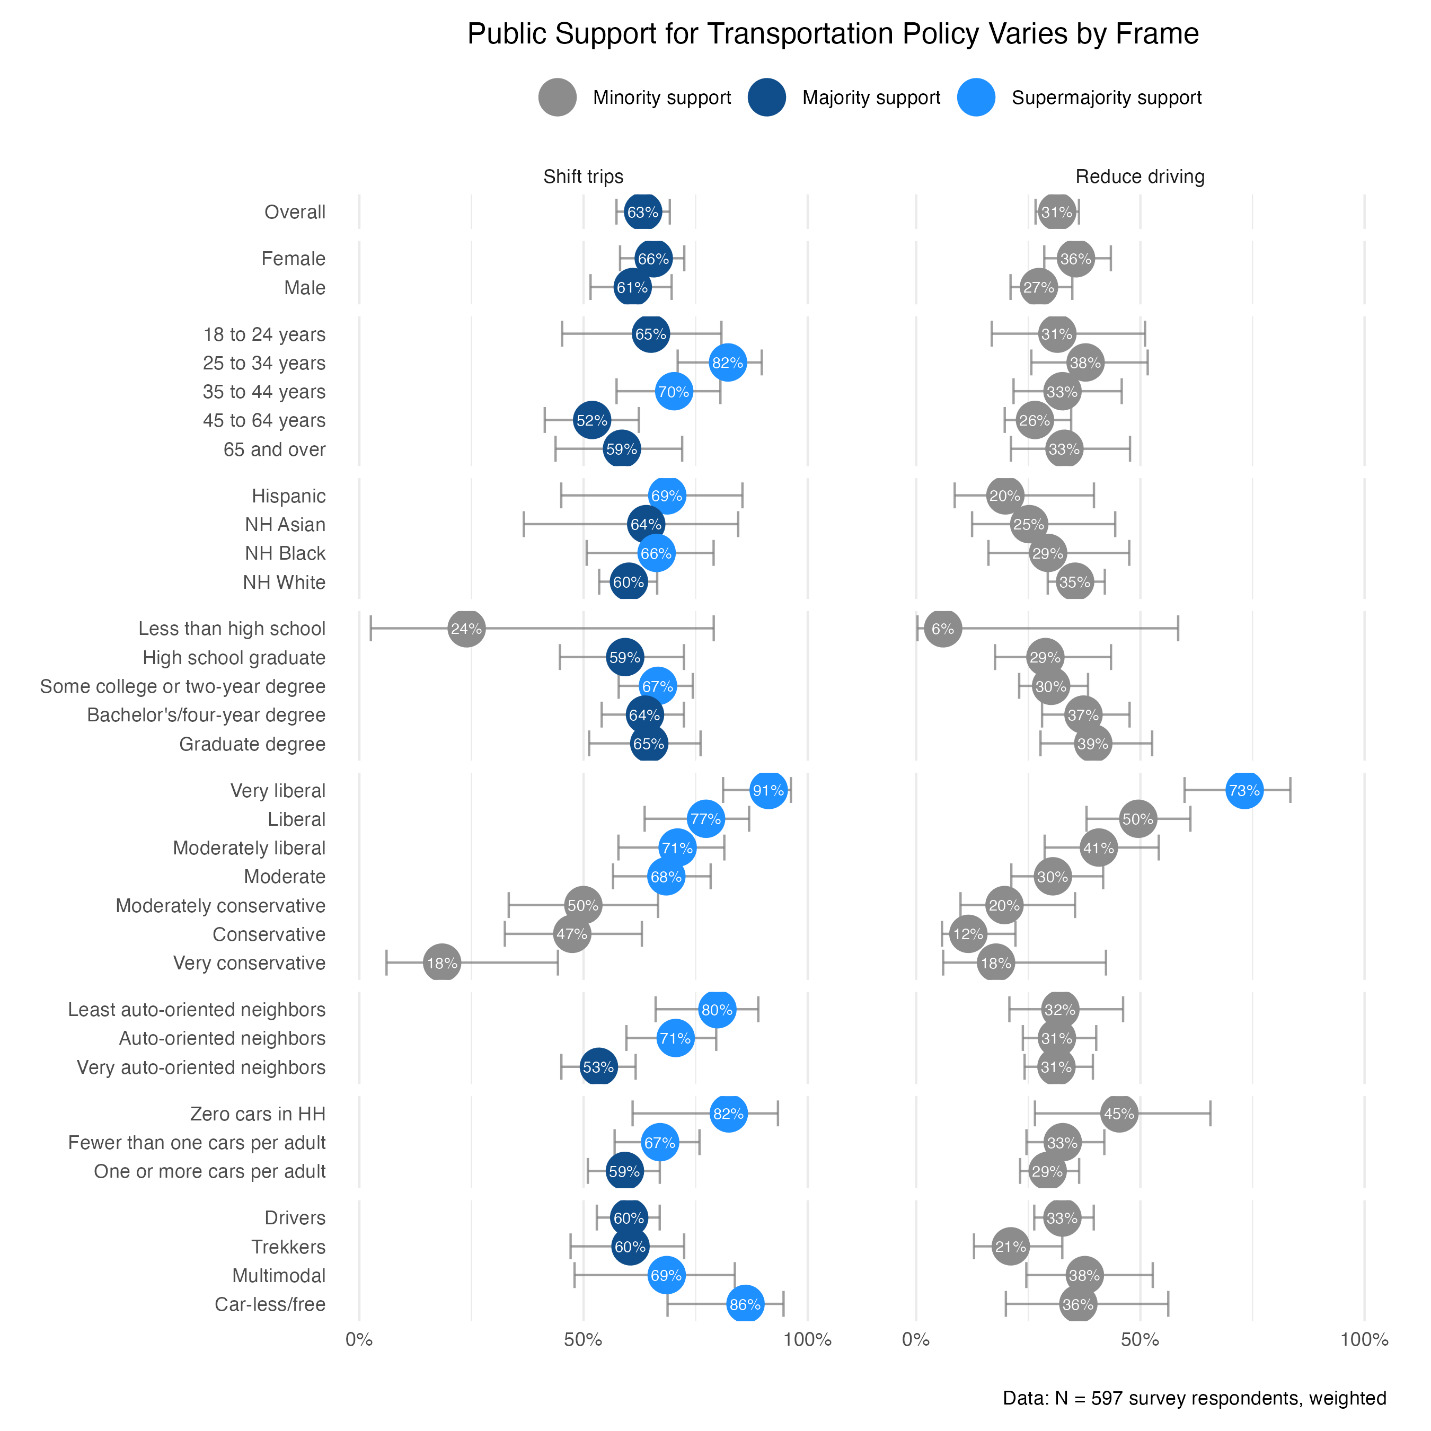
By contrast, “reduce driving” polled at just 34% and achieved majority support for just one group: “Very Liberal” respondents who represent just 5% of the U.S. population (General Social Survey 2018). Finally, “reduce driving” failed to garner majority support even among those who do not own a car, travel primarily without one, and live in the least auto-oriented neighborhoods, further illustrating its unpopularity.
In sum, Americans are susceptible to framing about transportation; what they prefer depends on how we ask them. The framing effect investigated here is large (34%), stable, and meaningful; in a referendum, framing could make the difference between victory and defeat.
Acknowledgements
This work was supported by a Kvarsten Faculty Development Grant Proposal from the University of Oregon and an Urban Transformation Research Initiative grant at Cornell University. We thank the following for their feedback on the survey instrument: Suzanne Charles, Brianne Eby, Dillon Fitch, Susan Handy, Amanda Howell, Evan Iacobucci, Jaekyeong “Jamie” Kwon, Rebecca Lewis, Michael Manville, Patricia Mokhtarian, Eric Morris, Robert Noland, Matthew Palm, Robert Schneider, and Linda Shi.