Loading [Contrib]/a11y/accessibility-menu.js
Findings
  • Menu
  • Articles
    • Resilience Findings
    • Transport Findings
    • Urban Findings
    • All
  • For Authors
  • Editorial Board
  • About
  • Blog
  • search

    Sorry, something went wrong. Please try your search again.
    ×

    • Articles
    • Blog posts

RSS Feed

Enter the URL below into your favorite RSS reader.

https://findingspress.org/feed
×
Transport Findings
December 02, 2021 AEST

Spatial Analysis of Dog Ownership and Car Use in the UK

Ian Philips, Giulio Mattioli, Jillian Anable,
car dependence dogs energy spatial regression
Copyright Logoccby-sa-4.0 • https://doi.org/10.32866/001c.29846
Photo by Danny Lines on Unsplash
Findings
Philips, Ian, Giulio Mattioli, and Jillian Anable. 2021. “Spatial Analysis of Dog Ownership and Car Use in the UK.” Findings, December. https://doi.org/10.32866/001c.29846.
Save article as...▾
  • PDF
  • XML
  • Citation (BibTeX)
Data Sets/Files (6)
Download all (6)
  • Table 1. Data sources
    Download
  • Figure 1. Line of best fit of the relationship of dogs per person and km per person by income quintile, with error bars (95% confidence interval). Quintile 1 is lowest income and 5 the highest. Spearman correlation coefficients by income quintile of the outcode-level median incomes as follows: income quintile 1 = 0.64, income quintile 2 = 0.55 income quintile 3 = 0.61 income quintile 4 = 0.68 income quintile 5 = 0.71.
    Download
  • Figure 2. Relationship between dog ownership and car km travelled by level of urbanisation with error bars (95% confidence interval). Spearman correlation coefficients by level of urbanisation are: Major conurbation= 0.55; Minor Conurbation = 0.15; City and Town = 0.43; Rural Town and Fringe = 0.14; Rural Village and Dispersed = -0.03
    Download
  • Table 2. Ordinary Least Squared Regression model outputs, Dependent variable is car km travelled per person per year.
    Download
  • Table 3. Spatial Durbin model outputs: Dependent variable is car km travelled per person per year
    Download
  • Figure 3**. *Co-efficient estimates for Dogs per person Model D using Geographically Weighted Regression (Quasi-Global R Squared = 0.9159 and AIC = 31506).
    Download

Sorry, something went wrong. Please try again.

If this problem reoccurs, please contact Scholastica Support

Error message:

undefined
×

View more stats

Abstract

Walking the dog, and other dog-related practices, have been suggested to be particularly car-dependent. Secondary data analysis presented finds associations between the high energy use practices of car travel and dog ownership. There is a strong association between the rate of dog ownership and car km travelled per person. This relationship holds when controlling for income, level of urbanisation housing type and demographic variables.

1. RESEARCH QUESTIONS AND HYPOTHESES

While much transport research focuses on the journey to work, leisure and other non-work related activities are responsible for a large share of car mileage and related environmental damage (Anable 2002; Mattioli, Anable, and Vrotsou 2016; Schlich et al. 2002). In this context, there is suggestive evidence that dog-related activities may be associated with higher levels of car travel. Based on a survey of dog owners in Sydney Australia, Kent and Mulley (2017) identify “a high level of car use for dog-related trips” and “a propensity for people to travel relatively long … distances with their dogs” (p.281) for activities such as taking the dog to a recreational area, to training or to the veterinary. They estimate 2.4 million dog-related car trips occurring in Sydney each week. Mattioli et al. (2016) find that the time-use activity ‘walking the dog’ is associated with high levels of car use in the UK, because of its high frequency and car dependence. Recent studies in Seattle U.S. identify walking the dog as a generator of car travel (MacKenzie and Cho 2020). These findings illustrate the broader point that energy and carbon-intensive activities are often undertaken for the sake of household pets (Strengers, Nicholls, and Maller 2016). Murray et al. (2010) find in a survey (n ~3000) that in rural areas the dog ownership rates are high. They suggest housing is on average larger in rural areas, giving more space for pets, in addition to the influence of demographic factors.

In this paper, we test the following two hypotheses, derived from the above-mentioned research, based on unique spatial data for the UK:

  1. there is a relationship between dog ownership and levels of car use

  2. such a relationship remains substantial even after controlling for income, and urbanisation

2. METHODS AND DATA

Car use data is available at LSOA[1] resolution and dog ownership is at a coarser non-overlapping postcode outcode geography (e.g. LS21). To avoid ecological fallacy (Openshaw 1984) we aggregated to postcode outcode resolution. A lookup table is available to link LSOA and postcode geographies (ONS 2017).

The data preparation phase produced variables at the postcode outcode level including: i) car kilometres travelled per person per annum; ii) dogs per person; iii) income quintile iv) rural-urban classification. Analysis was carried out using R and Rstudio (www.r-project.org). To aid reproducibility the code is shared by the authors https://github.com/DrIanPhilips/Dogs_and_car_use . Data sources are as shown in Table 1.

Table 1.Data sources
Variables Source (reference) Spatial unit
Dog population by postcode outcode (Animal and Plant Health Agency 2016) Post code outcode*
Postcode polygons Ordnance Survey Code Point Open Polygons https://digimap.edina.ac.uk Post code outcode
Mean vehicle kilometres travelled per person per year Cairns et al. (2014) LSOA
Rural Urban Classification http://geoportal.statistics.gov.uk/datasets/rural-urban-classification-2011-of-lower-layer-super-output-areas-in-england-and-wales LSOA
Experian LSOA income estimates (Experian Limited 2007) LSOA
LSOA population weighted centroids https://ons-inspire.esriuk.com/arcgis/rest/services/Census_Boundaries/Lower_Super_Output_Areas_December_2011_Centroids/MapServer LSOA
lookup table to link LSOA and postcode geographies ONS (2017)

* Also known as Postcode Districts. There are 2235 in England and Wales

3. FINDINGS

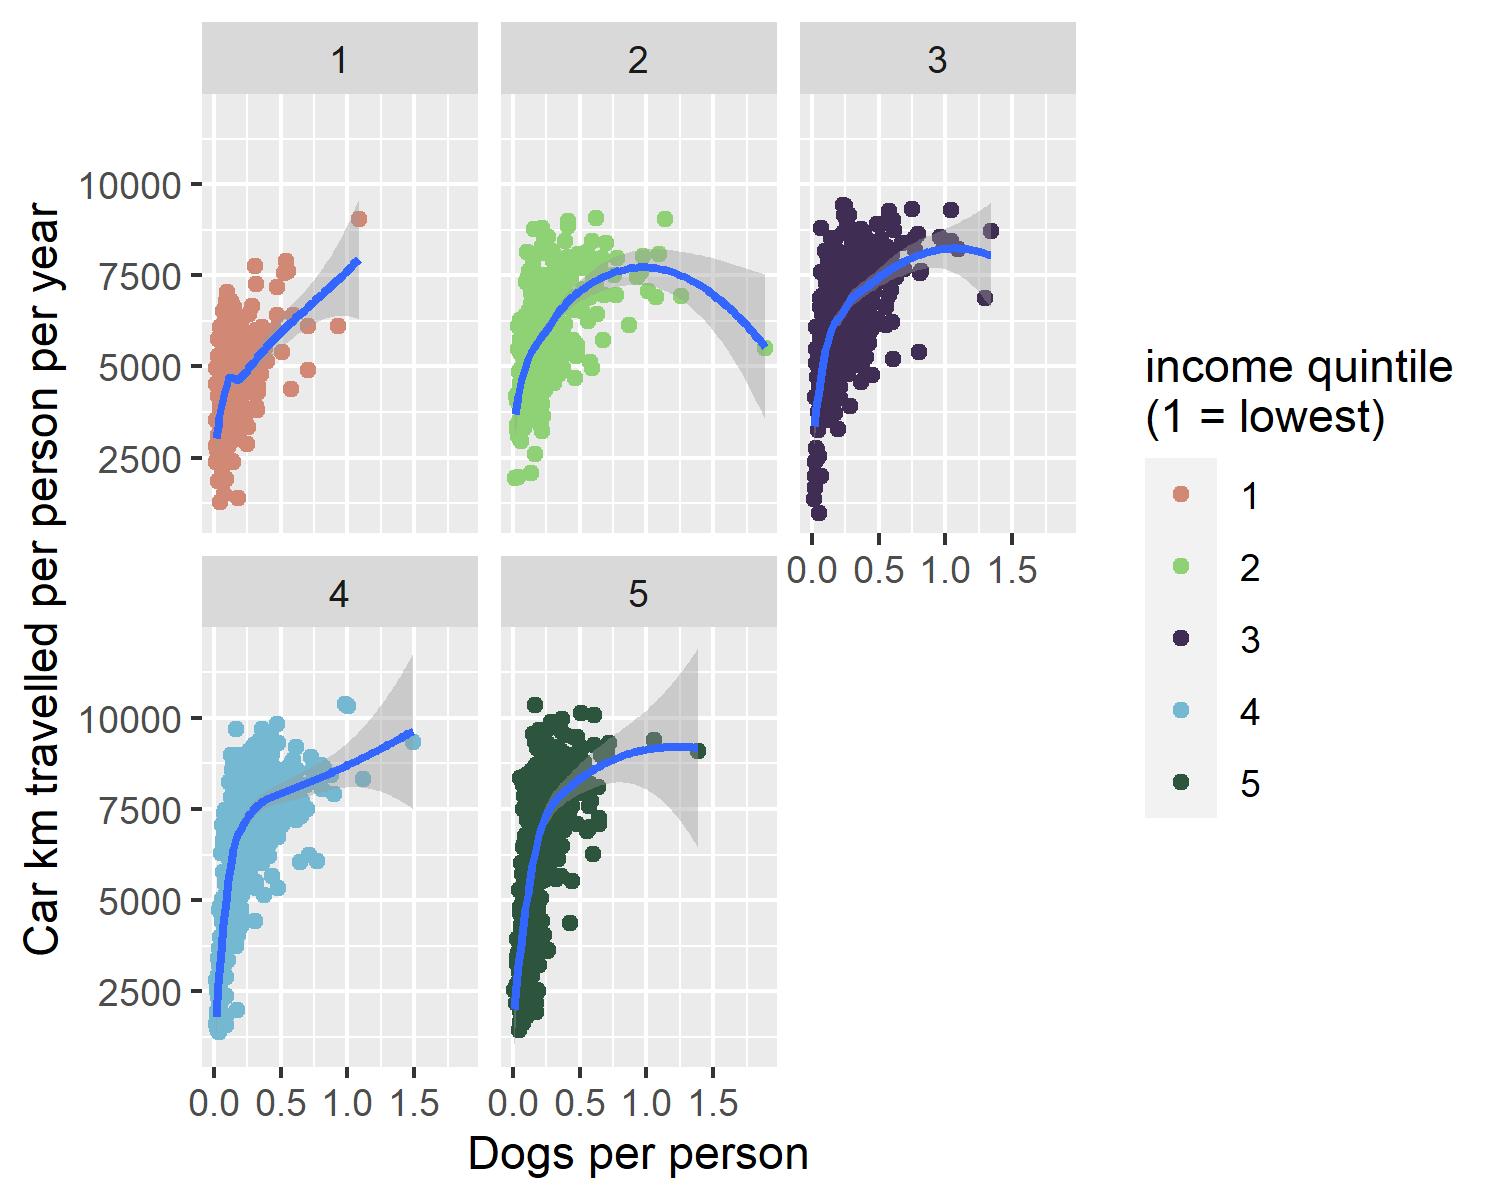
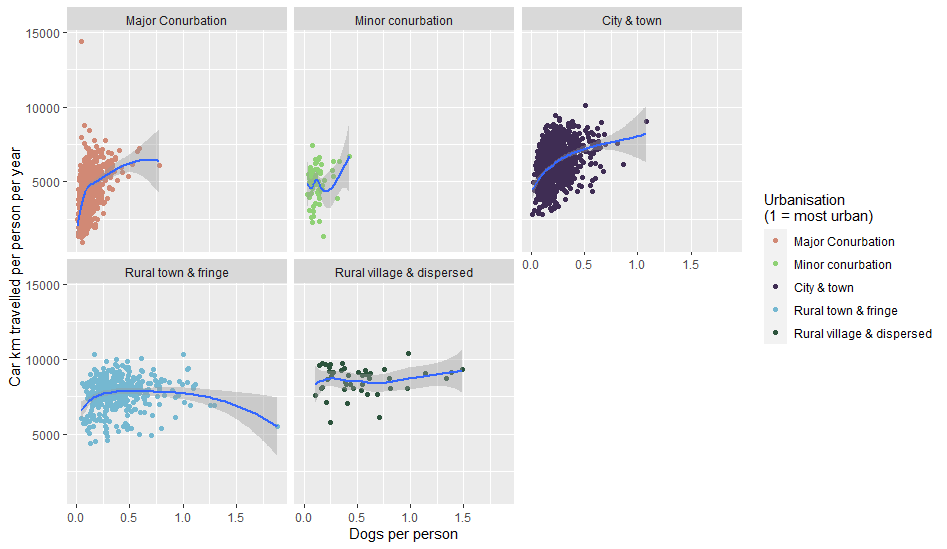
There is a considerable positive correlation (R=0.67 Spearman, 0.55 Pearson) between car kilometres travelled per person per annum and dogs per person, suggesting that as dogs per person increase so do car km per person. Since both dog ownership and car use may be associated with wealth and high consumption lifestyles, we next controlled for median income of each area, showing the relationship between car kilometres travelled and dog ownership for each income quintile (Figure 1). The results show that the association between car kilometres per person and dog ownership is highest in high-income areas (fourth and fifth quintiles), but, remains higher than 0.5 in lower income areas. Furthermore, for each income group there appears to be a threshold of dog ownership at which the car km per person changes rapidly. We also plot the level of urbanisation and dog ownership (Figure 2). The strongest positive correlation between dog ownership and car use is in major conurbations, the association between dog ownership and car use is weakest in rural areas.

Figure 1
Figure 1.Line of best fit of the relationship of dogs per person and km per person by income quintile, with error bars (95% confidence interval). Quintile 1 is lowest income and 5 the highest. Spearman correlation coefficients by income quintile of the outcode-level median incomes as follows: income quintile 1 = 0.64, income quintile 2 = 0.55 income quintile 3 = 0.61 income quintile 4 = 0.68 income quintile 5 = 0.71.
Figure 2
Figure 2.Relationship between dog ownership and car km travelled by level of urbanisation with error bars (95% confidence interval). Spearman correlation coefficients by level of urbanisation are: Major conurbation= 0.55; Minor Conurbation = 0.15; City and Town = 0.43; Rural Town and Fringe = 0.14; Rural Village and Dispersed = -0.03

A bivariate Ordinary Least Squares regression model with car kilometres travelled per person as the dependent variable and dogs per person as the sole predictor has an adjusted R2 of 0.32 (Model A) suggesting dog ownership alone is a moderate predictor of car km travelled, supporting hypothesis 1 above.

An adjusted regression model with car kilometres travelled per person as the dependent variable and dogs per person, income quintile and rural urban classification as predictors (Model B) gave an adjusted R2 of 0.6103, with a positive, statistically-significant coefficient for dog ownership. When dogs per person was removed from the model (Model C), the adjusted R2 dropped to 0.5802. This suggests that dog ownership retains some association with car km travelled even after accounting for income and level of urbanisation, supporting hypothesis 2 above.

A further regression model (Table 2, Models D and E) additionally considers age, gender, dwelling type employment status, and level of car ownership; the types of characteristics considered in an analysis of survey data by Kent and Mulley (2017). This model considers some other factors connected to the built environment such as housing type. We also include the proportion of families with dependent children. When ‘Dogs per person’ was removed from the model, the adjusted R2 still dropped albeit slightly. This model further supports the hypotheses above.

Table 2.Ordinary Least Squared Regression model outputs, Dependent variable is car km travelled per person per year.
Model A Model B (dogs per person included) Model C (dogs removed from model) Model D (dogs per person included) Model E (dogs removed from model)
Dogs per person 5,531*** 2,098*** 669***
(180) (167) (100)
Income quintile 357*** 380*** 73*** 70***
(18) (19) (17) (17)
Urban minor conurbation 1,044*** 1,111*** -2 -6
(157) (163) (92) (93)
Urban city and town 1,687*** 1,934*** 334*** 359***
(62) (61) (44) (44)
Rural town and fringe 2,818*** 3,406*** 934*** 1,029***
(88) (77) (63) (62)
Rural village and dispersed 3,378*** 4,243*** 1,060*** 1,214***
(reference class Urban Major conurbation) (189) (183) (119) (118)
Median age 19*** 22***
(7) (7)
% Female -157*** -161***
(15) (15)
% Detached housing 48*** 50***
(3) (3)
% Semi-detached housing 19*** 18***
(2) (2)
% Terraced housing 21*** 22***
(reference class % flats) (2) (2)
% Economically active 50*** 52***
(4) (4)
% No car -38*** -39***
(3) (3)
% families with dependent children -17*** -20***
(5) (5)
Constant 4,610*** 2,926*** 3,089*** 8,096*** 8,272***
(53) (73) (75) (766) (774)
Observations 2,037 2,037 2,037 2,037 2,037
Adjusted R2 0.3174 0.6103 0.5802 0.8730 0.8703
Spatial Autocorrelation of OLS residual (Moran’s I) 0.494*** 0.518*** 0.524*** 0.296*** 0.289***

Note: *p<0.1 **p<0.05 ***p<0.01
Units for % variables are 0-100 e.g. the coefficients are an estimate of the effect of a 1% change in the predictor variable

However, when we checked the OLS regression residuals we found all had significant spatial auto-correlation (See Table 2). Models A to C had strong autocorrelation, and Models D-E had moderate spatial autocorrelation. Spatial autocorrelation of residuals could lead to lead to underestimated standard errors and overstated statistical significance. LeSage (2014) suggests a Spatial Durbin Model is a good start point to try to address this. The model fit for each Spatial Durbin Model (using the AIC metric) improved upon their corresponding OLS model. Also, the model fit for models B and D which included dog ownership as a predictor have a slightly better fit than Model C and E respectively which did not have dog ownership as a predictor.

In both the OLS and Spatial Durbin Models, the coefficient on dogs per person gets smaller as more covariates are added. In the Spatial Durbin Models, the coefficients for dogs per person are smaller than in the corresponding OLS model, but in all models, dog ownership remains a significant predictor of car travel supporting the hypotheses above. The reduction in the magnitude of the coefficient of ‘Dogs per person’ between Models A and D (in both Table 2 and 3) is substantial, suggesting that much of the variable’s effect is accounted for by socio-demographic and built environment covariates. However even though the size of effect is reduced, the association still remains significant after considering the covariates in model D.

Table 3.Spatial Durbin model outputs: Dependent variable is car km travelled per person per year
Model A Model B (dogs per person included) Model C (dogs removed from model) Model D (dogs per person included) Model E (dogs removed from model)
Dogs per person 2,815*** 1,309*** 710***
(166) (132) (95)
Income quintile 558*** 582*** 13 13
(20) (20) (21) (21)
Urban minor conurbation 772*** 755*** 256 236
(279) (286) (198) (201)
Urban city and town 734*** 810*** 211** 235***
(123) (126) (89) (90)
Rural town and fringe 1,670*** 1,889*** 788*** 859***
(129) (130) (95) (96)
Rural village and dispersed 2,300*** 2,639*** 980*** 1,089***
(reference class Urban Major conurbation) (177) (179) (132) (132)
Median age 36*** 38***
(7) (7)
% Female -128*** -132***
(14) (15)
% Detached housing 37*** 38***
(3) (3)
% Semi-detached housing 5* 4
(3) (3)
% Terraced housing 9*** 9***
(3) (3)
% Economically active 50*** 50***
(5) (5)
% No car -42*** -43***
(4) (4)
% families with dependent children -16*** -17***
(5) (5)
lag.(Intercept) -935*** -549*** -573*** -381 -400
(29) (32) (33) (256) (260)
lag. Dogs per person 10 -53 -115***
(52) (48) (36)
lag. Income quintile -96*** -99*** 15*** 16***
(5) (5) (6) (6)
lag. Urban minor conurbation -92 -83 -58 -54
(57) (59) (41) (41)
lag. Urban city and town -46* -47* -4 -9
(27) (27) (20) (20)
lag. Rural town and fringe -143*** -114*** -27 -34
(34) (32) (26) (26)
lag. Rural village and dispersed -341*** -299*** -83* -97**
(60) (58) (45) (44)
lag. Median age -7*** -7***
(2) (2)
lag. % Female 3 3
(5) (5)
lag. % Detached housing -1 -1
(1) (1)
lag. % Semi-detached housing 3*** 3***
(1) (1)
lag. % Terraced housing 2** 2**
(reference class % flats) (1) (1)
lag. % Economically active -5*** -5***
(2) (2)
lag. % No car 5*** 5***
(1) (1)
lag. % families with dependent children 1 1
(1) (1)
Constant 6,007*** 3,705*** 3,876*** 7,512*** 7,753***
(131) (150) (153) (779) (790)
Akaike Inf. Crit. 34,422 33,303 33,405 31,763 31,814

Note: *p<0.1 **p<0.05 ***p<0.01
Units for % variables are 0-100 e.g. the coefficients are an estimate of the effect of a 1% change in the predictor variable

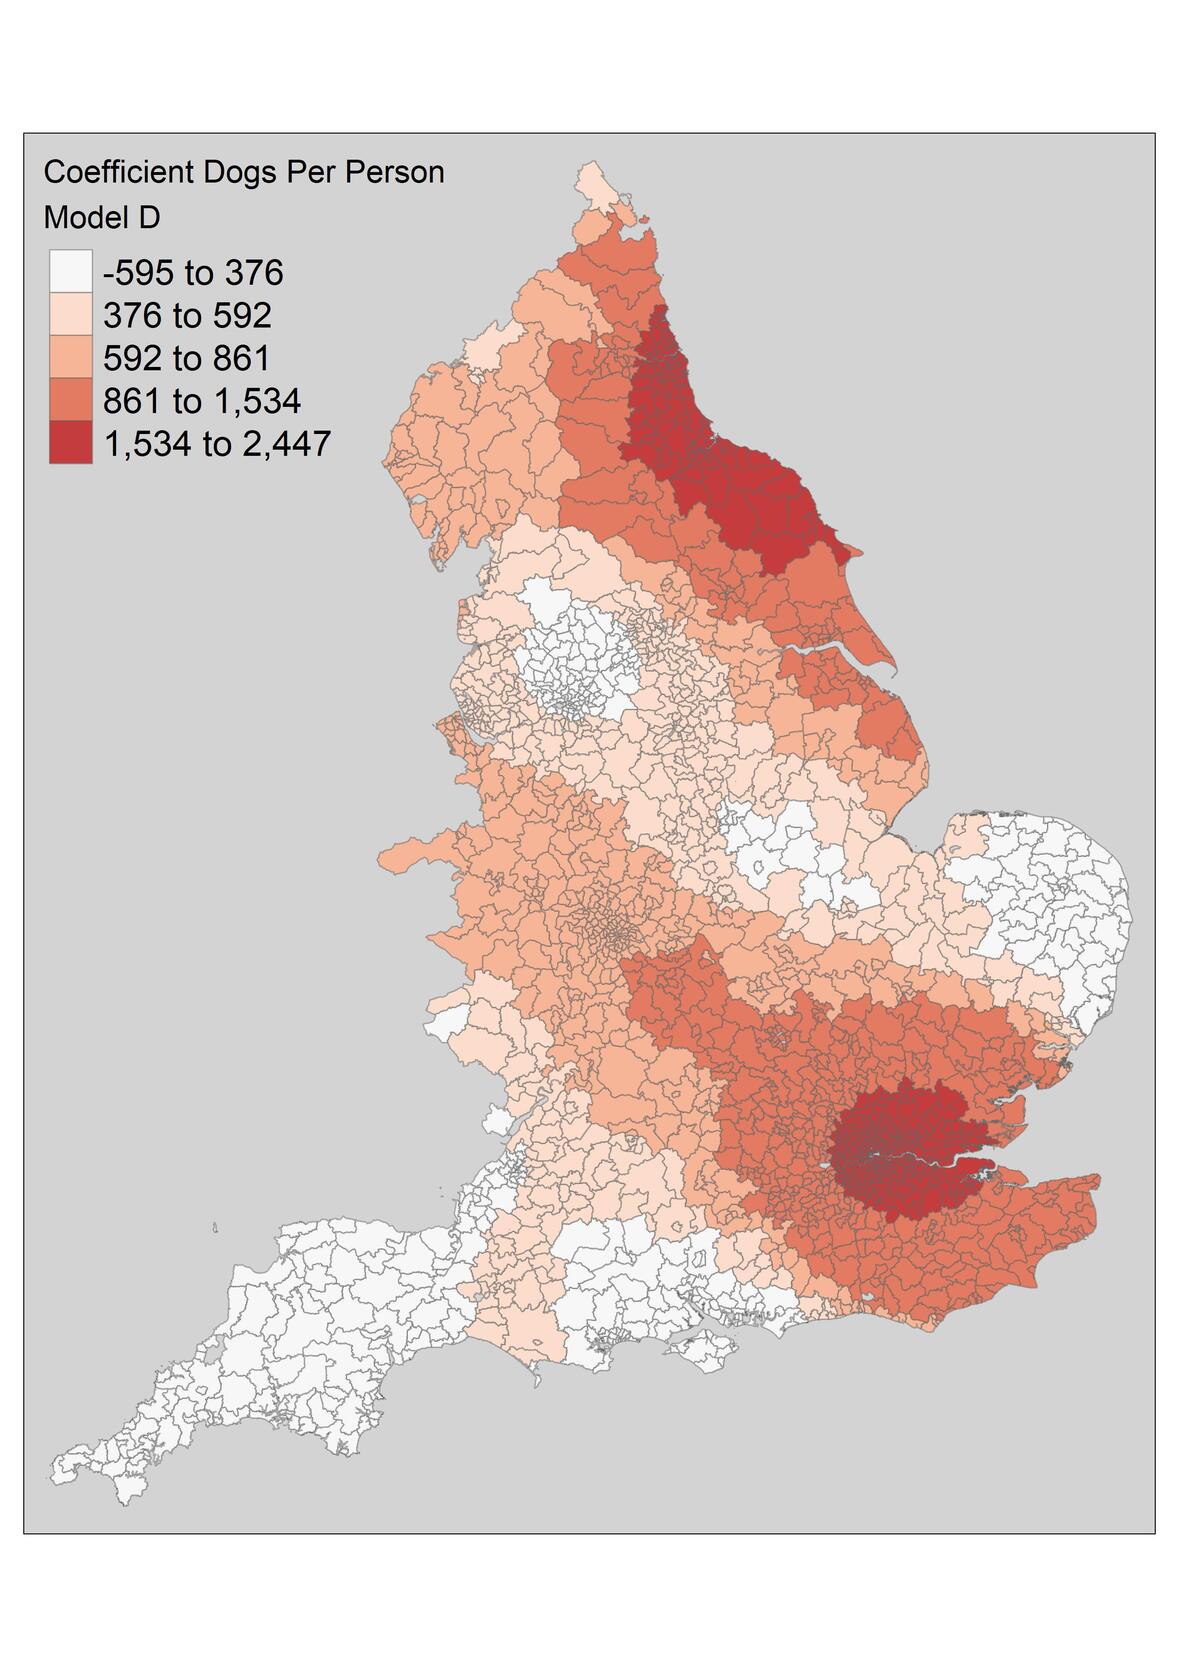
The Spatial Durbin Model offers an improved global model. However, when we run a Geographically Weighted Regression as a further step in exploring relationships as suggested by MacLachlan and Dennett (2021), we see that there is a non-stationarity; the relationship between variables differs between places (Fotheringham 2002). This is shown in Figure 3; Dog ownership in London, parts of the South East and The North East has a higher coefficient than elsewhere.

Figure 3
Figure 3.*Co-efficient estimates for Dogs per person Model D using Geographically Weighted Regression (Quasi-Global R Squared = 0.9159 and AIC = 31506).

While model form and specification could be investigated further in a future paper, our findings from all the models support the hypotheses of an association between dog ownership and car use, after controlling for obvious confounders. This is consistent with research suggesting that dog ownership is a car travel generator (Kent and Mulley 2017; MacKenzie and Cho 2020; Mattioli, Anable, and Vrotsou 2016) for social practices such as walking the dog and veterinary appointments. Our research provides support for those findings based on large-scale, spatially fine-grained data for England. As such, it provides support for calls for a greater use of practice theory in sustainable transport research (Kent 2021). From a policy perspective, it highlights the need for measures that aim at reducing car use, but are targeted to the specific social practices that motivate it (Hui 2013; Mattioli, Anable, and Vrotsou 2016). In this particular case, some have suggested specific policy interventions facilitating travelling with dogs on public transport and allowing off-leash dogs in neighbourhood parks (Kent, Mulley, and Stevens 2020; MacKenzie and Cho 2020) though others also note the need for more research with those who may feel intimidated by or excluded from spaces by a greater presence of dogs (Mayorga-Gallo 2018).


ACKNOWLEDGMENTS

This research forms part of a UKRI ESRC funded project ES/S001743/1


  1. English Lower Super Output Areas (LSOA) are UK census geographies including on average ca. 625 households and 1500 individuals. There are 32,844 LSOAs in England

Submitted: August 18, 2021 AEST

Accepted: November 08, 2021 AEST

References

Anable, J. 2002. “Picnics, Pets, and Pleasant Places.” In Social Change and Sustainable Transport. Bloomington: Indiana University Press. https://iupress.org/9780253340672/social-change-and-sustainable-transport/.
Google Scholar
Animal and Plant Health Agency. 2016. “Dog Population per Postcode District.” https://data.gov.uk/dataset/ec8fc820-2e36-49d0-a09c-e2901e10b2e4/dog-population-per-postcode-district.
Cairns, S., R. E. Wilson, T. Chatterton, J. Anable, S. Notley, and F. McLeod. 2014. Using MOT Test Data to Analyse Travel Behaviour Change - Scoping Report. /view.aspx?id=1324904.
Google Scholar
Experian Limited. 2007. “Experian Demographic Data, 2004-2005 and 2008-2011.” UK Data Service. https://beta.ukdataservice.ac.uk/datacatalogue/doi/?id=5738#1.
Fotheringham. 2002. Geographically Weighted Regression: The Analysis of Spatially Varying Relationships. 1 edition. John Wiley & Sons.
Google Scholar
Hui, A. 2013. “Practices, Movement and Circulation: Implications for Sustainability.” In Sustainable Practices: Social Theory and Climate Change, 89–102. Route. https://www.routledge.com/Sustainable-Practices-Social-Theory-and-Climate-Change/Shove-Spurling/p/book/9781138847156.
Google Scholar
Kent, Jennifer L. 2021. “The Use of Practice Theory in Transport Research.” Transport Reviews 0 (0): 1–23. https://doi.org/10.1080/01441647.2021.1961918.
Google Scholar
Kent, Jennifer L., and Corinne Mulley. 2017. “Riding with Dogs in Cars: What Can It Teach Us about Transport Practices and Policy?” Transportation Research Part A: Policy and Practice 106 (December): 278–87. https://doi.org/10.1016/j.tra.2017.09.014.
Google Scholar
Kent, Jennifer L., Corinne Mulley, and N Stevens. 2020. “Challenging Policies That Prohibit Public Transport Use: Travelling with Pets as a Case Study.” Transport Policy 99: 86–94. https://doi.org/10.1016/j.tranpol.2020.08.024.
Google Scholar
LeSage, James P. 2014. “What Regional Scientists Need to Know About Spatial Econometrics.” SSRN Scholarly Paper ID 2420725. Rochester, NY: Social Science Research Network. https://doi.org/10.2139/ssrn.2420725.
MacKenzie, Don, and Hyun Cho. 2020. “Travel Demand and Emissions from Driving Dogs to Dog Parks.” Transportation Research Record 2674 (6): 291–96. https://doi.org/10.1177/0361198120918870.
Google Scholar
MacLachlan, A, and A Dennett. 2021. CASA0005 Geographic Information Systems and Science. London: CASA. https://andrewmaclachlan.github.io/CASA0005repo/.
Google Scholar
Mattioli, Giulio, Jillian Anable, and Katerina Vrotsou. 2016. “Car Dependent Practices: Findings from a Sequence Pattern Mining Study of UK Time Use Data.” Transportation Research Part A: Policy and Practice 89 (July): 56–72. https://doi.org/10.1016/j.tra.2016.04.010.
Google Scholar
Mayorga-Gallo, Sarah. 2018. “Whose Best Friend? Dogs and Racial Boundary Maintenance in a Multiracial Neighborhood.” Sociological Forum 33 (2): 505–28. https://doi.org/10.1111/socf.12425.
Google Scholar
Murray, J. K., W. J. Browne, M. A. Roberts, A. Whitmarsh, and T. J. Gruffydd-Jones. 2010. “Number and Ownership Profiles of Cats and Dogs in the UK.” Veterinary Record 166 (6): 163–68. https://doi.org/10.1136/vr.b4712.
Google Scholar
ONS. 2017. “Postcode to Output Area to Lower Layer Super Output Area to Middle Layer Super Output Area to Local Authority District (December 2011) Lookup in England and Wales.” Office for National Statistics. 2017. https://data.gov.uk/dataset/e428c474-2e09-4ec0-aa37-a58364c8ccce/postcode-to-output-area-to-lower-layer-super-output-area-to-middle-layer-super-output-area-to-local-authority-district-december-2011-lookup-in-england-and-wales.
Openshaw, S. 1984. “Ecological Fallacies and the Analysis of Areal Census Data.” Environment and Planning A 16 (1): 17–31.
Google Scholar
Schlich, Robert, Stefan Schönfelder, Susan Hanson, Kay W, Robert Schlich, Stefan Schönfelder, Kay W. Axhausen, and Susan Hanson. 2002. “Leisure Travel in a Historical Perspective- Changes.”
Strengers, Yolande, Larissa Nicholls, and Cecily Maller. 2016. “Curious Energy Consumers: Humans and Nonhumans in Assemblages of Household Practice.” Journal of Consumer Culture 16 (3): 761–80. https://doi.org/10.1177/1469540514536194.
Google Scholar

Powered by Scholastica, the modern academic journal management system