
1. Questions
While the complex factors that affect Millennials’ residential choices have drawn attention (e.g., Myers 2016), heterogeneous directionalities of Millennials’ migration remain underexplored. Where do Millennials move to? Are migration patterns homogeneous within a birth cohort? Unveiling the process of moving from one location to another is crucial for geographers, urban planners, practitioners, and policymakers. A spatially explicit understanding of migration patterns could empower agencies to set policy targets for places while planning infrastructure programs for such as housing, commuting, and public services. Furthermore, exploring spatial patterns across age groups would bring a multifaceted understanding to generation and life cycle, generating new hypotheses about the mechanisms shaping residential migration.
The study examines Millennials’ spatial migration patterns in South Korea’s Seoul Metropolitan Area (SMA). Given the tendency of short-distance mobility, an analysis of intra-metropolitan migration will aid our understanding of Millennials’ location choices and the associated urban dynamics. This study answers the following research questions:
-
Where are Millennials’ migration flows clustered? In which directions are they heading?
-
How do the migration patterns among Millennials differ across age groups?
2. Methods
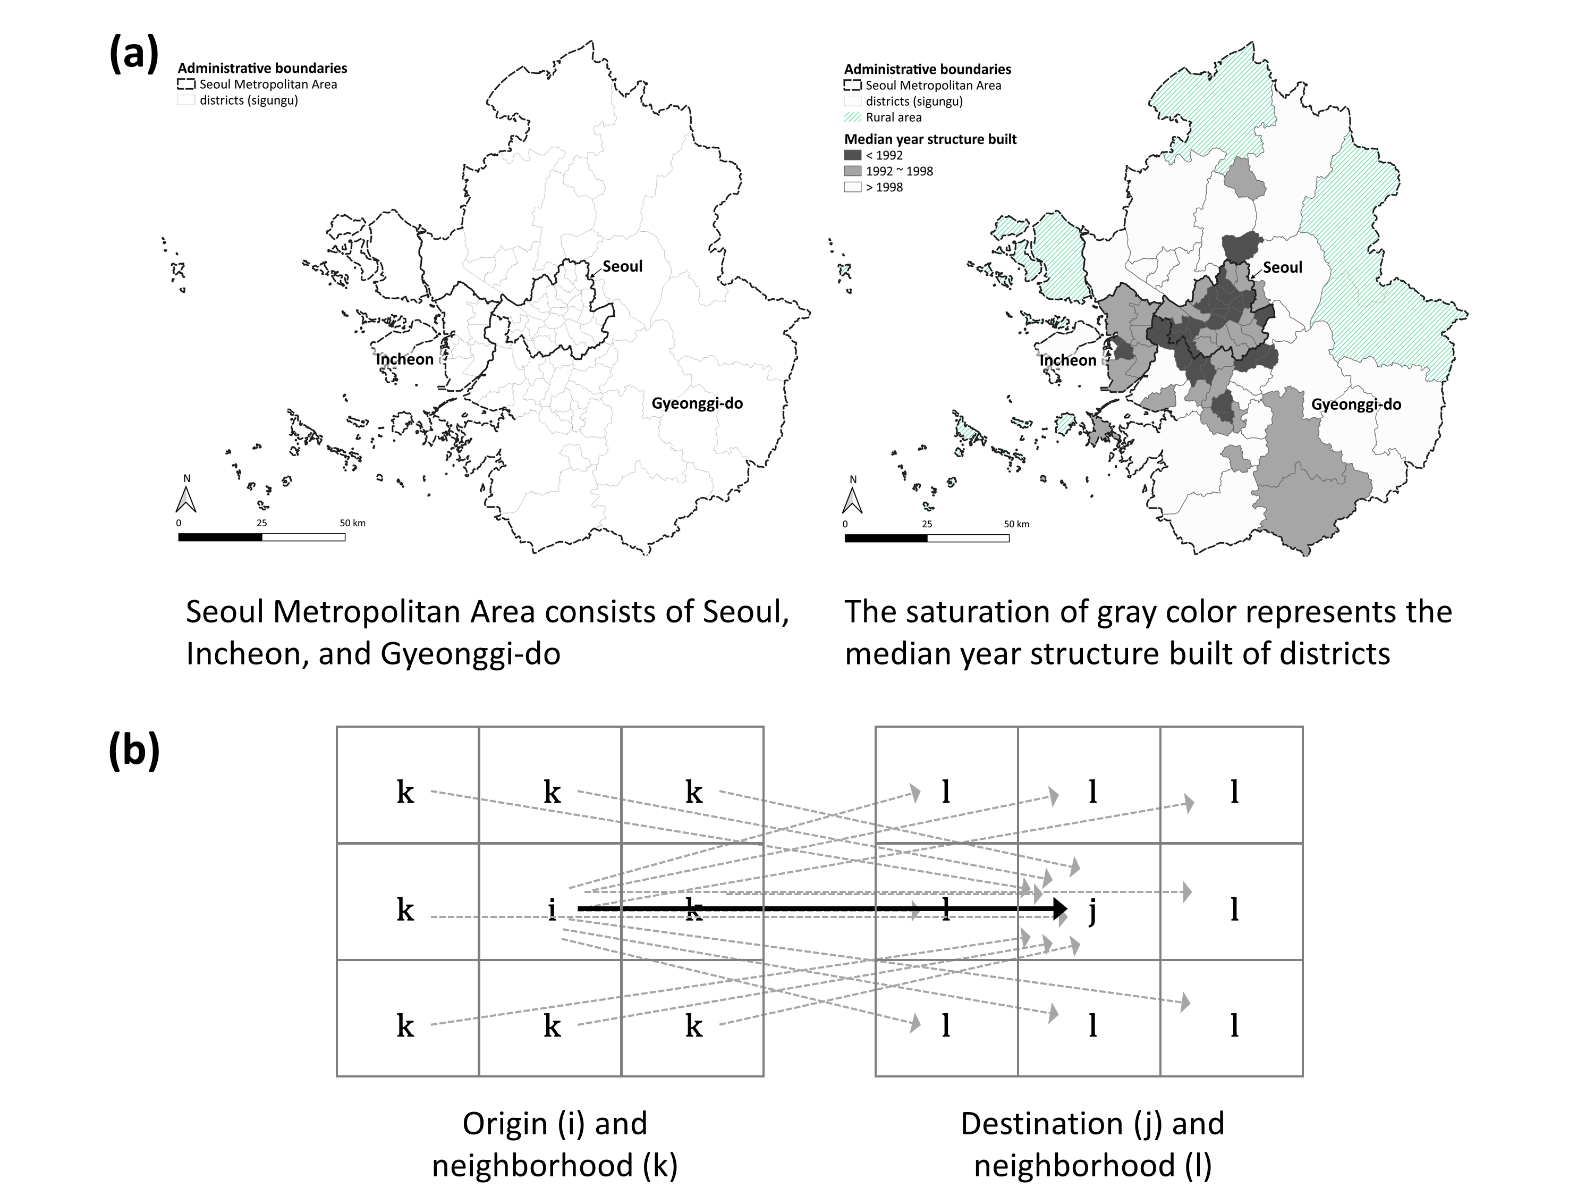
Our analyses describe migration patterns within the SMA, consisting of Seoul, the capital city, and its surrounding provinces. There are 77 districts (sigungu) within SMA. We categorized districts based on the median year in which the structure was built (Figure 1(a)) excluding rural areas. This gives a rough idea of which districts have experienced more recent development. Migration data in 2019 were retrieved from Statistics Korea (KOSTAT) and aggregated at the district level. The data provides household residential mobility information with age and the primary motive for migration. We adopt KOSTAT’s (2012) definition of Millennials as people who were born between 1979 and 1992. We then subdivided Millennials into younger (27-33) and older (34-40) groups based on the average marriage age (33) to consider the effect of life cycle.
_study_area_and_the_median_year_structure_built_of_districts__(b)_a_conceptual_represen.png)
We identify statistically significant migration clusters using the local spatial network autocorrelation statistic proposed by Berglund and Karlström (1999). The metric, an extended statistic of Getis and Ord (1992), detects spatial clustering of flows within the context of neighboring flows based on origins and destinations. To be a statistically significant hot flow (c.f., a hot spot with statistic), a flow will have a high value and be surrounded by other flows with high values as well. Thus, the method enables detecting a group of flows having similar traits in terms of directionality. We can analyze the general trend of flow data in consideration of the spatial structure of the area of interest, rather than focusing on few large-volume flows. To calculate the statistic, we generated a binary network spatial weight matrix for each link of the migration network matrix based on the spatial contiguity of zones. Each weight of the matrix was calculated using an equation as a combined form of multiple origins and destinations visualized in Figure 1(b) (Equation (1)). We then calculated statistic using Equation (2). To ensure a statistical significance of the value, we conducted bootstrapping permutation of resampling the individual statistic 10,000 times to generate a non-parametric distribution. Among the total 5,852 (77 x 76) flows, those with a value greater than the 500th largest value of the distribution (i.e., at the significance level of 0.05) are defined as migration clusters.
\[w_{ij,kl} = \ \left\{ \begin{matrix} 1\ if\ i = k\ and\ w(j,l) = 1,\ or\ j = l\ and\ w(i,k) = 1 \\ 0\ otherwise \end{matrix} \right.\tag{1} \]
where is 1 if and are contiguous and 0 otherwise. Two sets of flows, connecting i to j and k to l, are defined as neighboring flows (i.e., equals 1), when the flows are made from the same neighboring zone to another same neighboring zone. We care about spatial contiguity of both origins and destinations of flows for constructing a weight matrix.
\[G_{\text{ij}}^{*}(W) = \ \frac{\sum_{\text{kl}}^{\mathstrut}{w_{ij,kl}r_{\text{kl}}} - W_{\text{ij}}^{*}\overline{r}}{s\left\{ \frac{\left( nS_{1,ij}^{*} - W_{\text{ij}}^{*2} \right)}{(n - 1)} \right\}^{\frac{1}{2}}\ } \tag{2}\]
\[\overline{r} = \frac{1}{n}\sum_{\text{kl}}^{\mathstrut}r_{\text{kl}},\ \ \ s^{2} = \frac{\sum_{\text{kl}}^{\mathstrut}r_{\text{kl}}^{2}\ }{n - 1} - \ {\overline{r}}^{2},\ \ \ W_{\text{ij}}^{*} = \ \sum_{\text{kl}}^{\mathstrut}w_{ij,\ kl},\ \ \ S_{1,ij}^{*} = \ \sum_{\text{kl}}^{\mathstrut}w_{ij,kl}^{2}\]
, where is migration volume of network (a flow from to is total number of networks. Here, the local sum for a flow and its neighbors is compared to the sum of all flows.
To compare migration patterns of two different groups in the same area, we excluded overlapped clusters which are shown in both groups from each result. By doing so, we analyzed migration patterns unique to a group, compared to the other one. R 4.1.1. was used for statistic calculation and QGIS 3.20.2. was utilized for visualization following Graser (2019).
3. Findings
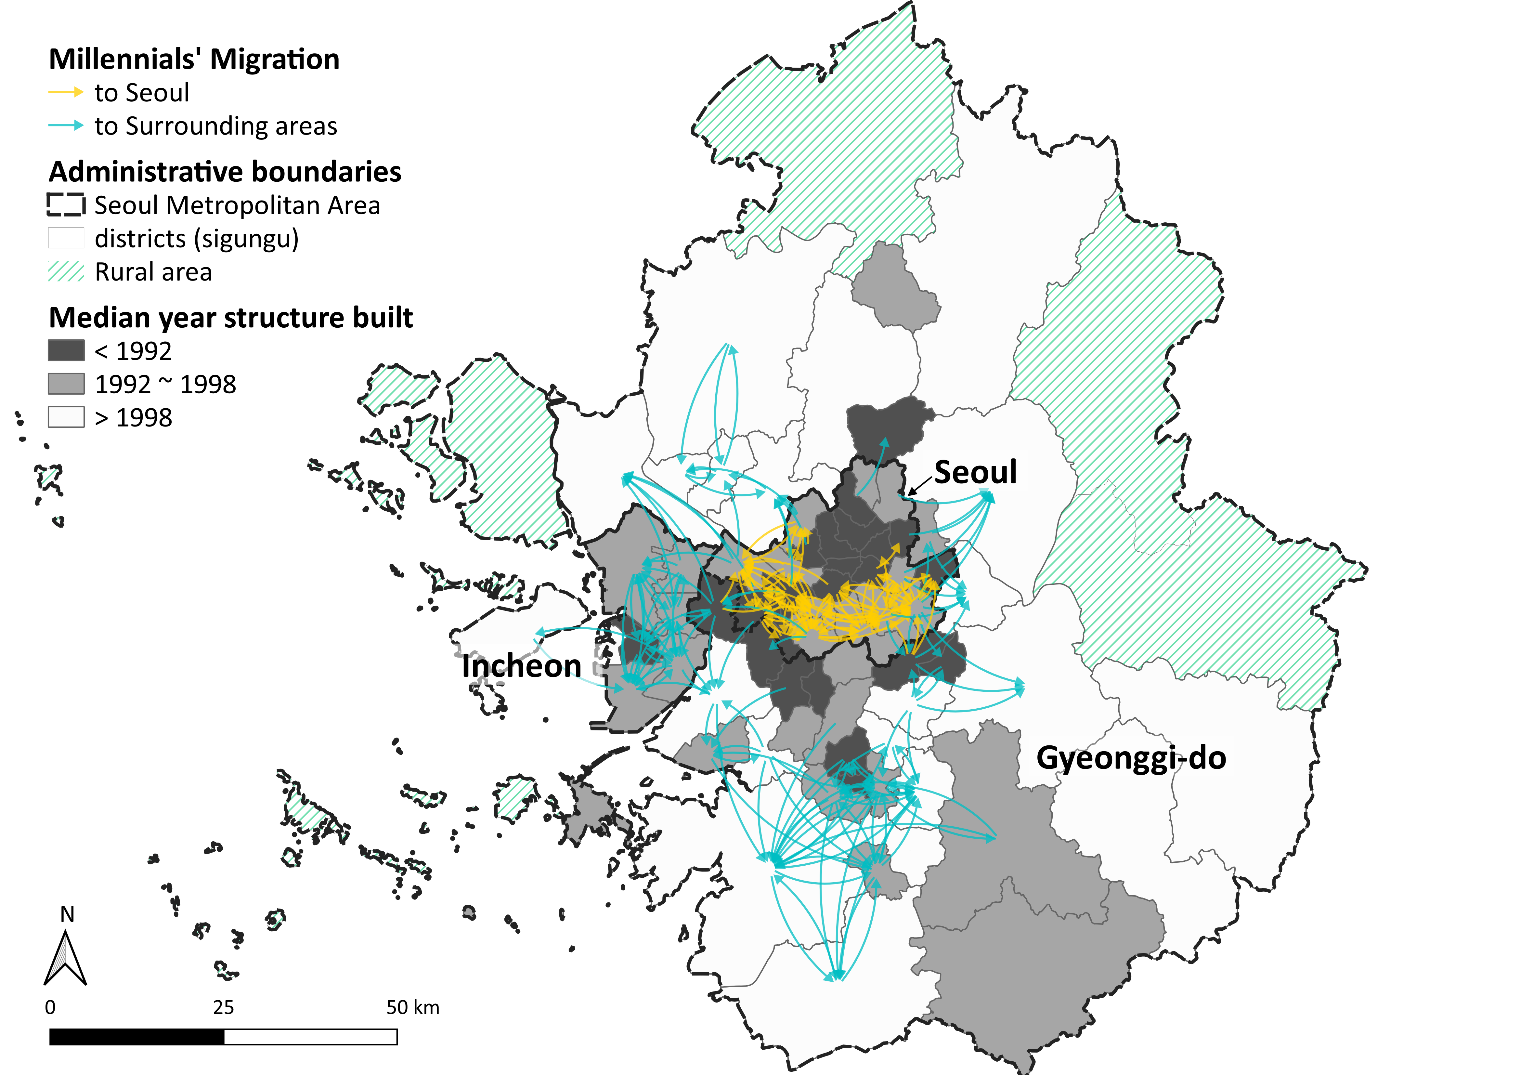
Millennials’ migration clusters are found both inside Seoul and out-migration flows of Seoul
Figure 2 shows the migration clusters of Millennials in 2019. Migration clusters detected by local spatial network autocorrelation statistic are concentrated in southern Seoul (yellow arrows). There are fewer migration clusters moving out of Seoul to surrounding districts. The diverging patterns – within versus out-migration– suggest different dynamics of migrations among Millennials.
When the migration clusters are collated with the median year structure built in districts, 77.8% of the clusters are heading to districts having the same or newer buildings (shaded cells in Table 1). Within Seoul, migration clusters are agglomerated in southern Seoul, which is relatively recently developed, and the out-migrants who left Seoul move to newer districts. The pattern indicates that Millennials prefer to live in newer villages, a finding consistent with previous studies (e.g., Lee 2021).
Spatially distinct migration clusters of younger and older Millennials are observed
Within the same birth cohort, each age group has its own migration pattern. Younger Millennials tend to move within Seoul (Figure 3(a)); older Millennials tend to leave Seoul for the surrounding districts.
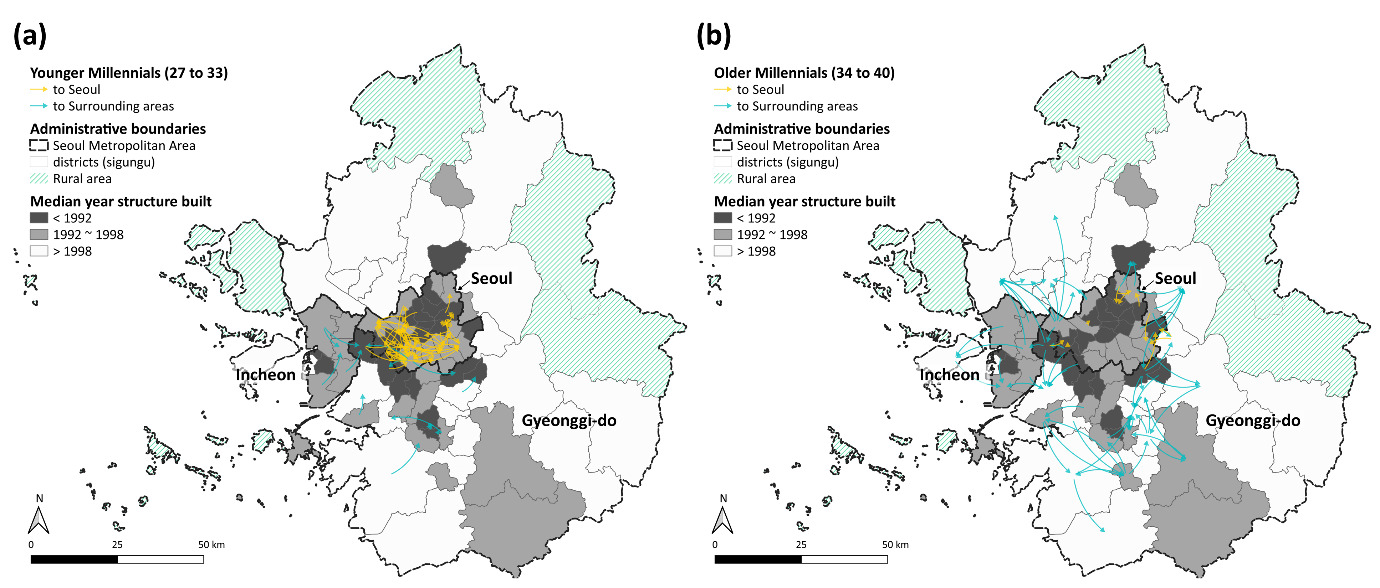
Such diverging patterns by age can be partially explained by changes in migration motives along the life cycle (Table 2). The higher share of young Millennials’ migration events is motivated by employment, which draws them to regions with the most job opportunities. At the same time, migration in search of better housing accounts for the migration of older Millennials’ migration who generally buy their first home after getting married.
The study applied local spatial network autocorrelation statistic to analyze Millennials’ spatial and directional migration patterns. Our results also showed that migrations of younger and older Millennials are separated in terms of origins and destinations, possibly reflecting different needs based on life cycle. The analysis demonstrated that the method detects migration clusters and is useful for comparing subsets.
Acknowledgments
This research is supported by the Faculty of Social Science at Western University.