
1. Questions
Debates over the effects of multiuse trails have evolved from whether they reduce property values to whether they cause gentrification (Rigolon and Németh 2020; Rigolon et al. 2020). Proximity to trails (< 0.5 miles) generally is associated with 3-5% premiums in property values (Crompton and Nicholls 2019), but larger increases and gentrification have occurred along some trails (e.g., Bloomingdale/606 in Chicago; Rigolon et al. 2020; Gould and Lewis 2017; Immergluck and Balan 2018; Smith et al. 2016). This paper describes changes in gentrification status and related indicators in neighborhoods near three trails three years after opening. We hypothesize changes will be greater in neighborhoods abutting trails than in nearby neighborhoods in the same residential submarket.
2. Methods
We study three trails: the Metropolitan Branch Trail (MBT), a Washington DC rail-trail; Shelby Farms Greenline (SFG), Memphis, TN; and Lafitte Greenway (LF), a New Orleans, LA rail-trail. We use a case-control, pre-post design and report changes three years after opening. Treatment groups comprise trail-abutting Census Block Groups (CBGs); control groups are CBGs adjoining the treatment CBGs. We use this approach rather than other methods (e.g., Mahalanobis distance matching (Kantor 2012); propensity score matching (Caliendo and Kopeinig 2008)) to identify the control group to focus on neighborhoods within the same residential submarkets and to eliminate the need to control for other measurable and immeasurable factors that become relevant when broader areas are analyzed (Dube, Lester, and Reich 2010; Harris, Larson, and Ogletree 2018).
We apply two frequently-used criteria to define gentrifiability and gentrification (i.e., changes from gentrifiable to non-gentrifiable; Hammel and Wyly 1996; Freeman 2005; McKinnish, Walsh, and White 2010) (Tables 1 and 2):
-
Median household income < the citywide median;
-
Median home value < the citywide median household income.
We also test differences between treatment and control groups for changes of five additional indicators of gentrification: median rent, percent owner-occupied housing, percent residents with Bachelors’ degrees, percent residents in professional occupations, and percent white residents (Table 3). Data come from the Census Bureau. We conduct Hotelling’s T-squared tests between the treatment and control groups on the differences of means of each indicator. The null hypothesis (i.e., difference = 0) is rejected when T-square is smaller than the critical value at the corresponding significance level. The means are weighted by frequency of observations (i.e., the count of corresponding type of housing, individuals, or households) in each CBG (Hotelling 1992; Wilks 1962; Table 3). Our discussion focuses on changes in gentrifiable CBGs (36 % of CBGs analyzed). We also present results separately for all and non-gentrifiable CBGs (Tables 1-3). A limitation of this design is that three years may be insufficient for trail-related redevelopment to occur.
3. Findings
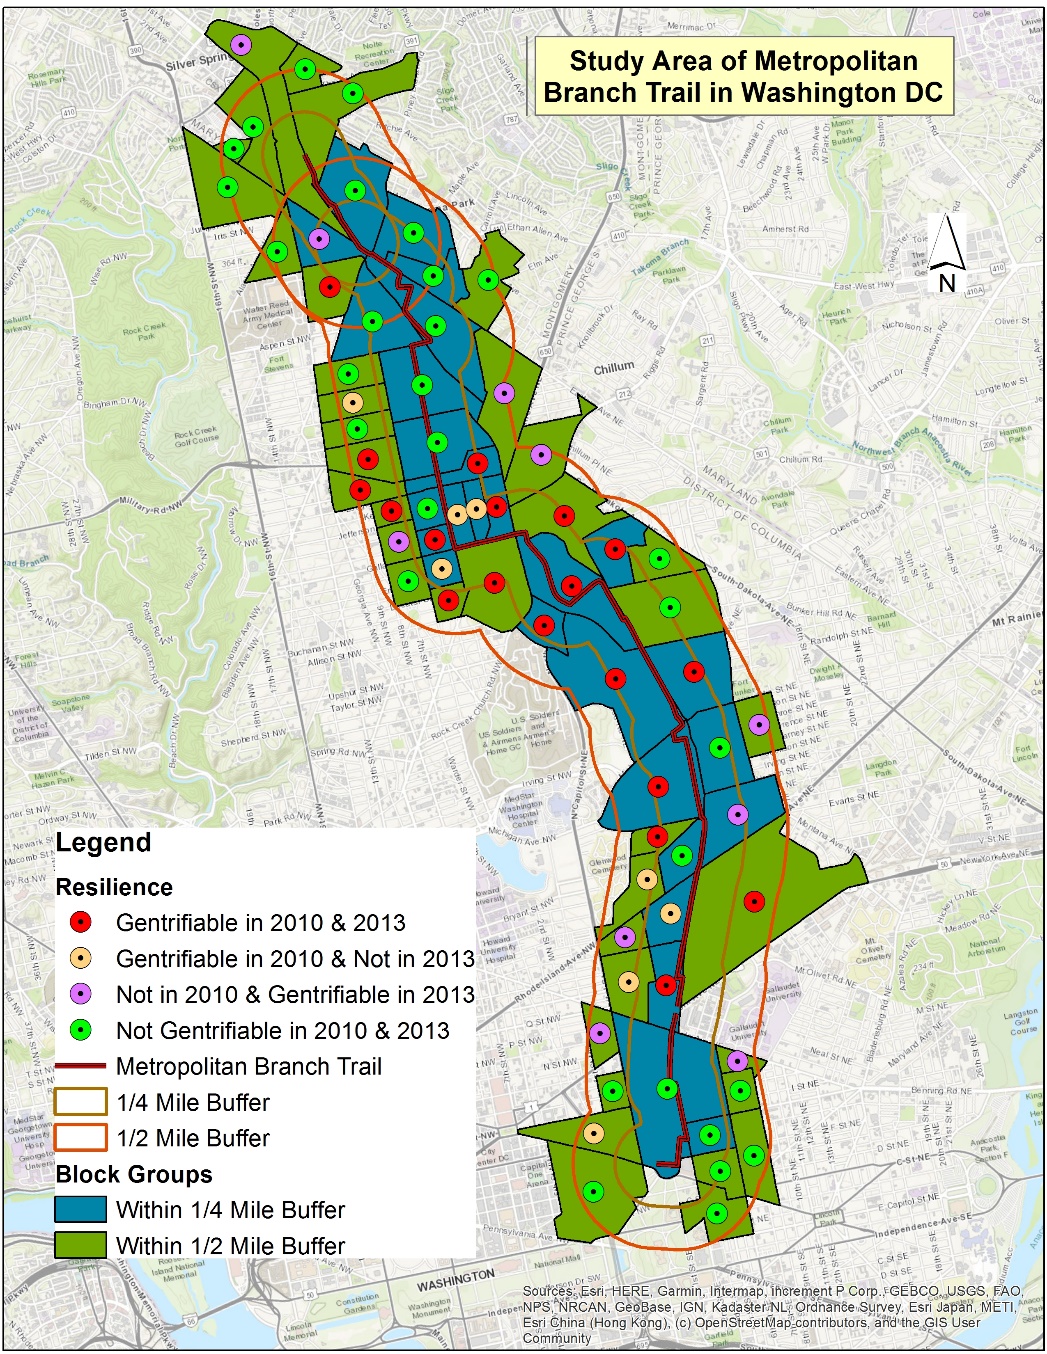
Metropolitan Branch Trail
The 8-mile MBT was developed next to an active railroad through economically and racially diverse neighborhoods from the city’s northern edge to the Union Station terminal (Figure 1). When the trail opened (2010), half the 28 CBGs in the treatment group and one-third of the 39 CBGs in the control group, respectively, were gentrifiable (Tables 1-2). The majority of gentrifiable CBGs in both the treatment and control groups remained so in 2013 (71% and 69%, respectively). No non-gentrifiable CBGs in the treatment groups reverted to gentrifiable status; nearly one-third in the control did. Rates of change of indicators associated with gentrification were significantly different but, contrary to hypotheses, greater increases occurred in the control group than in the treatment group (Table 3). Overall, results provide evidence of gentrification, but a minority of CBGs gentrified, and rates of increases in indicators in the non-gentrifiable CBGs were greater, suggesting trail proximity is influential but not the determining factor in gentrification.

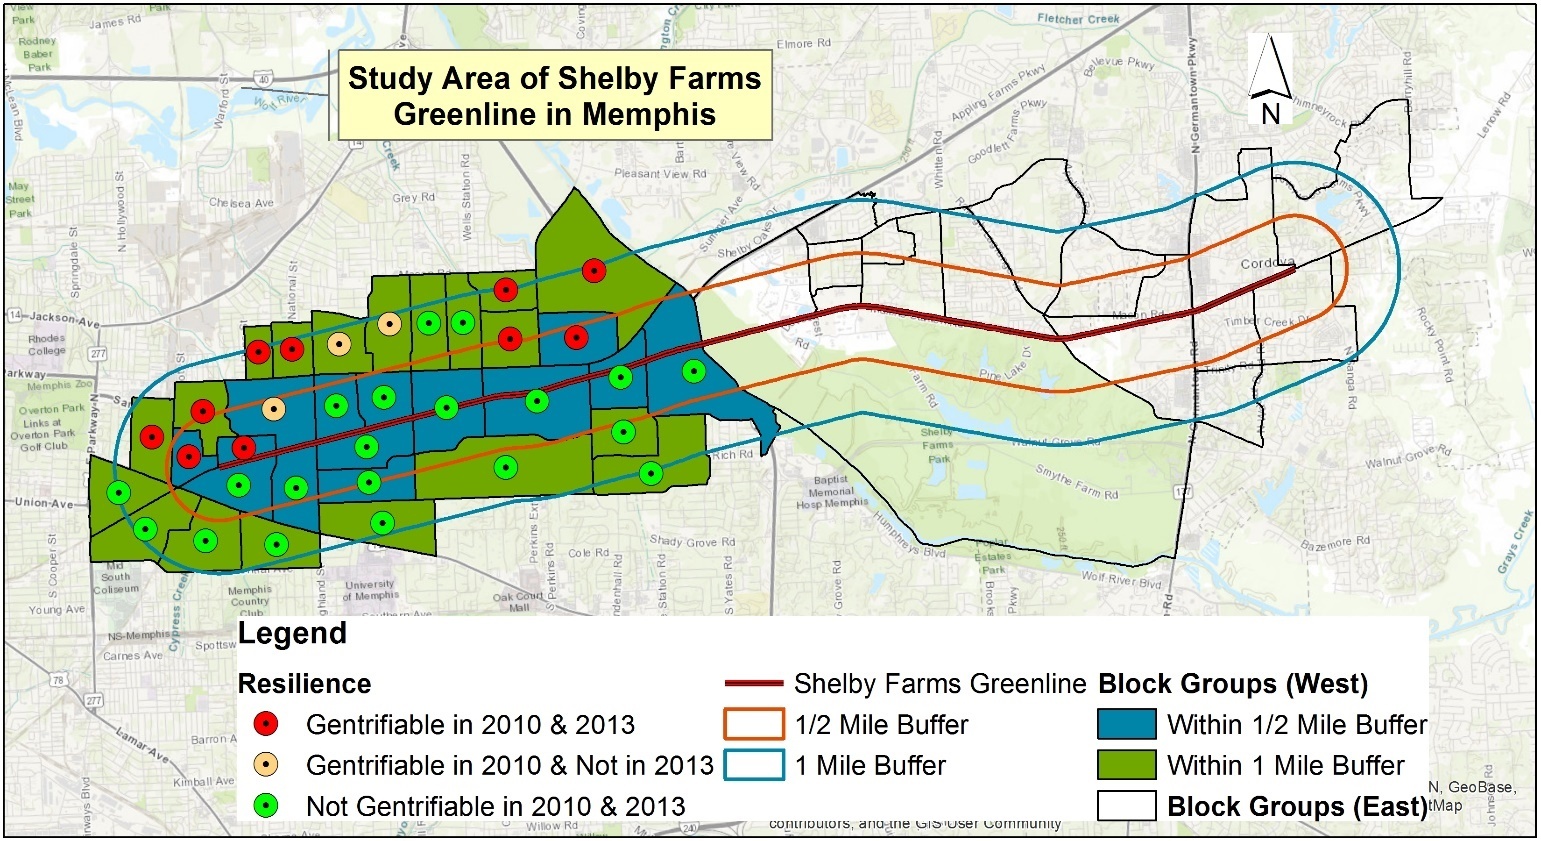
Shelby Farms Greenline
The 10.7-mile Greenline was built in a corridor where lower- and higher-income neighborhoods reflect historic patterns of economic and racial segregation (Figure 2). All CBGs south of the trail were non-gentrifiable. North of the trail, most CBGs were gentrifiable but these were mainly in the control group. The eastern end is bounded by parks and not analyzed. When the Greenline opened (2010), four of the 14 CBGs in the treatment group and nine of the 19 CBGs in the control group, respectively, were gentrifiable (Tables 1-2). Approximately three-fourths of the gentrifiable CBGs in both the treatment and control groups remained gentrifiable in 2013. Consistent with hypotheses, the rates of change of most indicators associated with gentrification were higher for CBGs in the treatment group than in the control group (Table 3). These results provide evidence of gentrification, but the majority of gentrifiable CBGs in both the treatment and control groups did not gentrify. However, rates of increases in indicators in the treatment group were higher, suggesting proximate neighborhoods changed faster.
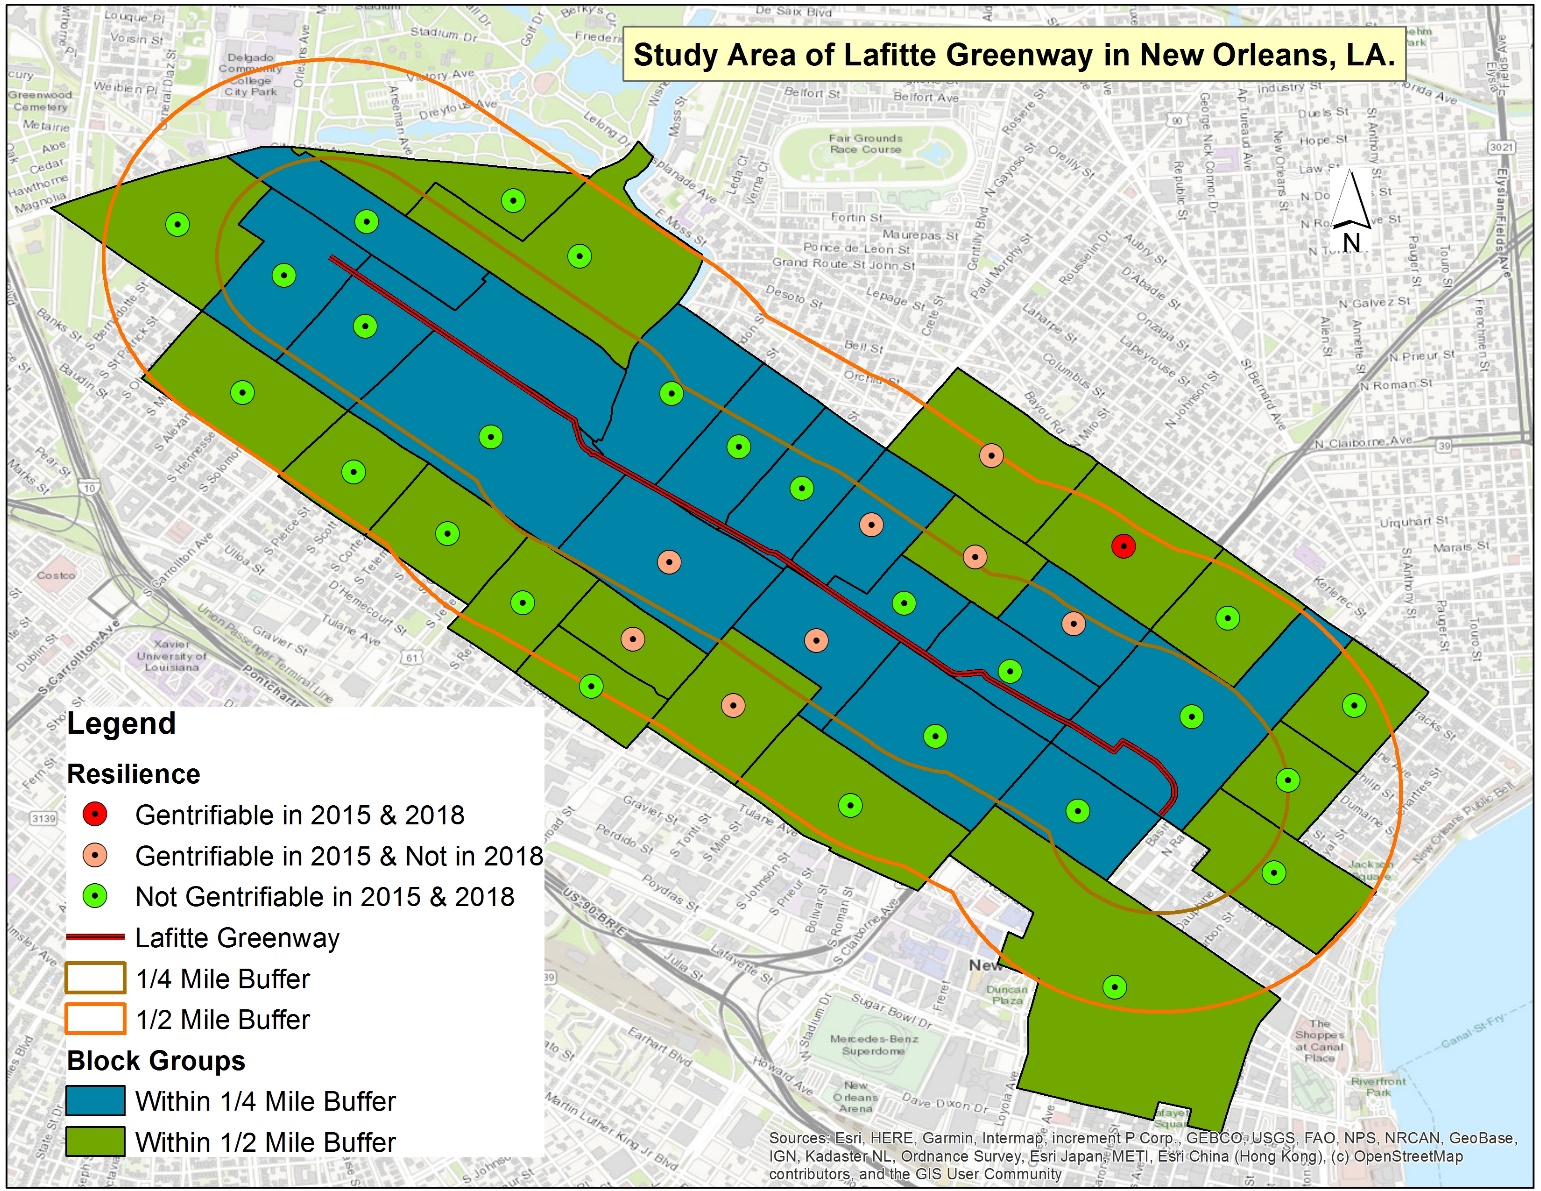
Lafitte Greenway
The 2.6-mile LG was developed along a canal right-of-way northwest-southeast towards the CBD through neighborhoods that mostly were non-gentrifiable (Figure 3). In 2015, only four of the 16 CBGs in the treatment group and five in the control group, respectively, were gentrifiable (Tables 1-2). By 2018, eight of these nine CBGs were non-gentrifiable; a single CBG in the control group remained gentrifiable. Contrary to hypotheses, the rates of change of most indicators associated with gentrification were higher for CBGs in the control group than in the treatment group (Table 3). These results provide substantial evidence of gentrification, but rates of increases in indicators were higher in the control groups, suggesting adjacent neighborhoods changed more slowly.

Summary
Analyses provide evidence of gentrification in each case, but the majority of gentrifiable CBGs in treatment and control groups adjacent to the MBT and SFG remained gentrifiable. In contrast, only one of nine gentrifiable CBGs along the Lafitte Greenway remained gentrifiable. Changes in indicators associated with gentrification mostly were positive for gentrifiable CBGs. They were greater in the treatment group along the SFG, but smaller near the MBT and LG, indicating adjacency to trails was associated with slower growth in these cases. These findings corroborate prior research: trails are heterogeneous; their effects are context-dependent and may be highly localized. Gentrification is not universal, at least after three years. Trail-related redevelopment may continue longer; additional analyses would be useful to assess longer-term effects.