Questions
Electric scooter (or e-scooter) is one of the newest forms of shared mobility and a convenient and environmentally efficient mode of transport. In US cities, concerns have been raised about inequities in the geographical distribution and access to e-scooters (Dill and McNeil 2021; Frias-Martinez et al. 2021). In response, some cities have started to impose regulations on e-scooter operating companies to ensure the deployment of a share of their e-scooters in socially disadvantaged areas. For example, Minneapolis, a mid-sized city in the USA and the most populous city in Minnesota, had started prioritizing safety and equity in e-scooter operation in 2020 for the first time after the inception of the e-scooter-share program in 2018. Specifically, the city set a limit of a maximum of 40% of deployed e-scooters that could be around downtown and required a minimum of 30% of e-scooters in areas with concentrated poverty in the northeast, north, and south Minneapolis (Mahmud 2021; City of Minneapolis 2021). The city’s assessment is primarily focused on the poverty rate and did not highlight much on other socio-demographic constructs (e.g., lower educational attainment, dependency on public and shared transportation for commuting, lower usage of credit cards and smartphones) that can potentially lead to inequality in accessing scooters.
Several recent scholarly works have examined the variation of e-scooter usage among different societal groups (Bai and Jiao 2020; Caspi, Smart, and Noland 2020). E-scooter usage largely depends on its supply/availability (Merlin et al. 2021), which is more important from an equity perspective but not yet sufficiently evaluated through the lens of social equity. Further, from the local context of Minneapolis, the availability of e-scooter among disadvantaged groups (e.g., communities that depend more on transit, bike, and walking for commuting than car) other than low-income was also not examined. To this end, this study seeks answers to the following two interrelated questions: Are e-scooters more likely available in areas with disadvantaged communities? How has the association changed spatially after complying with the city’s new distribution requirement?
Methods
This study uses e-scooter availability data of 2019 and 2020 from the open data portal of the city of Minneapolis. The data has daily records and does include the number of e-scooters found idle on different streets at six specific times (i.e., 1:00 am, 5:00 am, 9:00 am, 1:00 pm, 5:00 pm, and 9:00 pm) during a day. We then calculated the average number of e-scooters available during these six times for the entire study period (i.e., August 13 to October 19) for each street. The street profiles were then aggregated into census block groups and summed up using the “Spatial Join” tool of ArcGIS Pro, where streets passing through multiple block groups were assigned to the block group where their centers fall in. Thus, we calculated our final variable of interest, e-scooter availability per 1,000 population, where:
We made this calculation for both 2019 and 2020. The summary statistics of our dependent (e-scooter availability) and independent variables are provided in Table 1. Unsurprisingly, like bike ridership (Tokey 2020) and overall mobility (Tokey 2021), e-scooters availability and usage is also substantially lower in 2020 than in 2019 due to COVID-19. Our main independent variables describe the social composition of block groups, collected from the American Community Survey 5-year estimate data. These include poverty rate, percentage of non-white population, percentage of people with lower educational attainment (high school or below), and commuter mode choice. Because commuter mode choice is a percentage, we also included the total number of workers per block group as a control variable. Distance from the city center (downtown) to the centroid of block groups is also a control variable because previous studies indicated a distance decay for e-scooter usage in Minneapolis (Bai and Jiao 2020). The percentage of cellular internet users is another control variable because of the requirement of having a smartphone and an internet connection to unlock an e-scooter before riding. Finally, e-scooter usage is also controlled to avoid the risk of overemphasizing an area with low e-scooter availability where usage is also low. E-scooter usage in a block group is calculated using the formula by Bai and Jiao (2020).
\[\text{Daily e-scooter usage} = \frac{\text{n}_{\text{inflow}}\ + \ \text{n}_{\text{outflow}} - \ \text{n}_{\text{internal}}}{\sum_{\mathstrut}^{\mathstrut}\text{d}}\]
where ninflow, noutflow, and ninternal are the number of total trips terminated at, started from, and made within the block groups. d is the number of total days in the study period.
Findings
We fitted Spatial Lag Models (SLM) for the global parameters, and the regression result of SLM is provided in Table 2. In model 1 and model 3, we found that only non_CTV (% of commuters without a car, truck, or van) and the controls (except cell_data) were significantly associated with e-scooter availability in 2019 and 2020, respectively. This indicates that areas with a high poverty rate, a high percentage of non-white people, and less-educated people did not have significantly fewer e-scooters available than their counterparts. The inverse relationship of non_CTV indicates that e-scooters are less available in areas where the share of walking, biking, or public transportation commuters is high. Model 2 and model 4 are reduced forms of models 1 and 3, respectively, where only modal accessibility and poverty rates were included. The association of car-less commuters percentage pertained in the reduced model. However, the effect was reduced in 2020 compared to 2019. Also, the poverty rate became significantly positive (p< 0.10), which indicates improved equity in poverty-stricken areas.
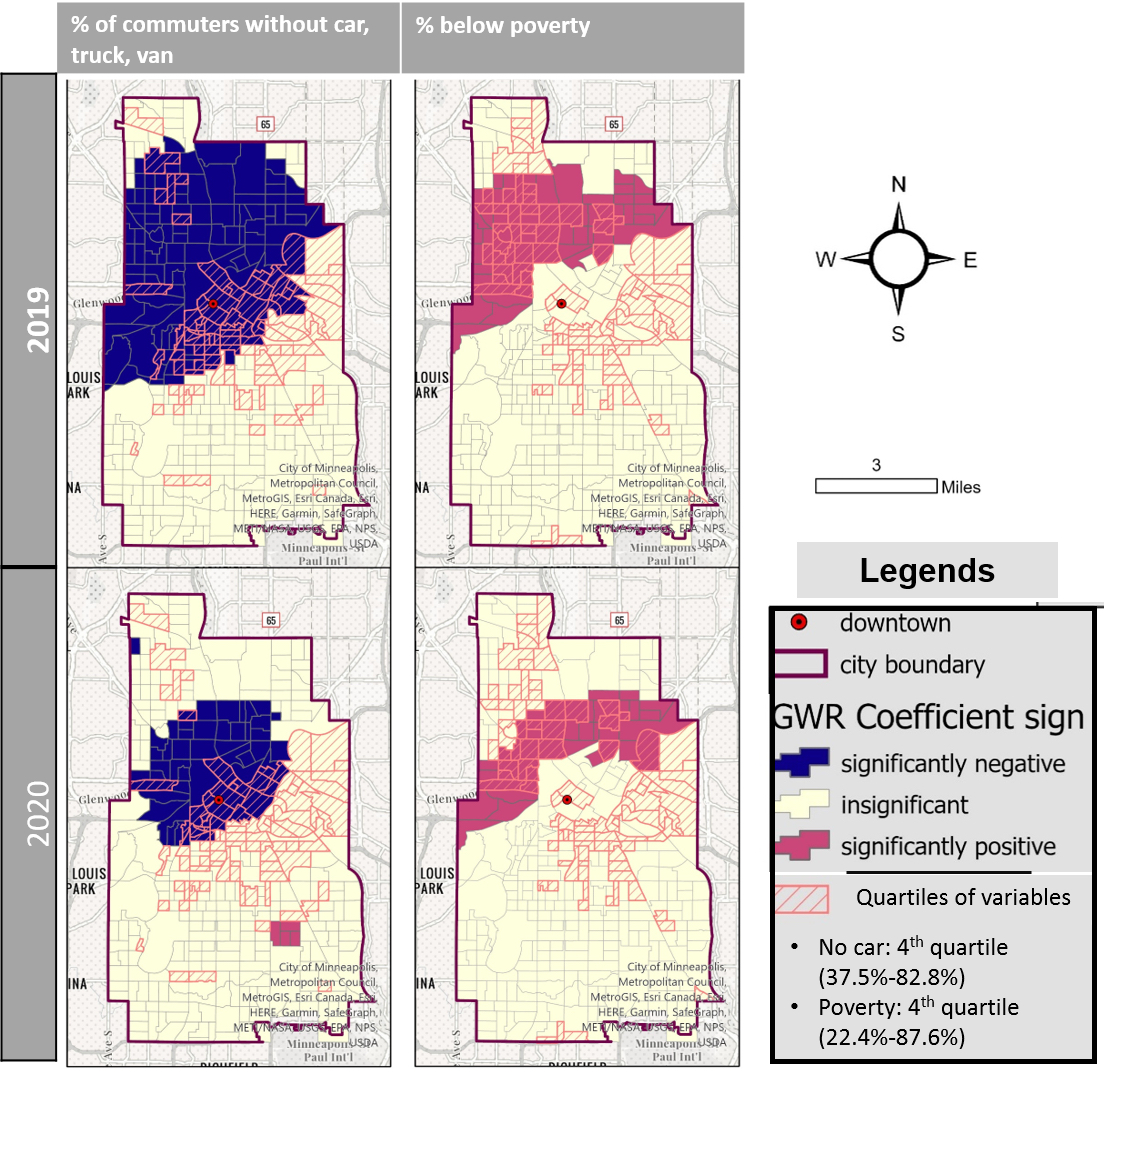
Model 2 and 4 were further estimated by Geographically Weighted Regression (GWR), and the spatial variation of effects is shown in Figure 1. The signs of the coefficients are overlaid with the highest quartiles of the explanatory variables. The 4th quartiles for blw_pov and non_CTV are ranged within 37.5-82.8% and 22.4-87.6%, respectively. In the left panel, the blue-colored areas indicate the reverse relationship between e-scooter availability and the percentage of car-less commuters. Some Block groups, mostly in the northwest of the city and around downtown, with the highest percentages of car-less commuters, were included in that blue-colored area in 2019. In 2020, perhaps as a result of the city’s effort to ensure a minimum number of e-scooters in poor northwestern areas, the association was not significant there. However, some block groups around downtown have a higher share of car-less commuters associated with a lower e-scooter availability. In the right panel, the association of the poverty rate with e-scooter availability is shown. All the significant areas—mostly comprised of areas with the top quartile of poverty rate—had a positive association (red-colored). These low-income areas had higher availability of e-scooter in both 2019 and 2020.

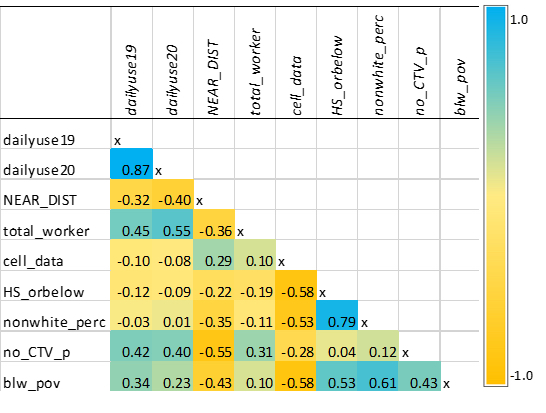
All the models have reasonable explanatory power (adjusted R2 = 0.50 to 0.65) (Table 3 in Appendix). With that, there is no multicollinearity problem since the maximum Variance Inflation Factor (VIF) is below 4. We have also assessed correlations of independent variables (Figure 2 in Appendix) to build reduced models. The SLMs significantly controlled the spatial dependence of the dependent variable of a target block group on its neighbors. They also have accounted for spatial autocorrelation. Although the GWR has clustered residual in the 2019 model, it performed better than SLM in the 2020 model with higher R2, lower AIC, and insignificant Moran’s I.
In short, the availability of e-scooter in Minneapolis is not significantly less in socially disadvantaged areas characterized by a high poverty rate, low education rate, and high percentage of racial minorities. Instead, northwestern areas with high poverty rates had high availability of e-scooter per capita. While these indicate better equity performance, downtown-centric areas demand careful consideration in policy for the detected association of low e-scooter availability and the high rate of commuters without automobiles.
Acknowledgement
I am indebted to Dr. Ralph Buehler (Professor, Urban Affairs and Planning, Virginia Tech) for his suggestions, comments and edits that helped this manuscript a lot.
