Loading [Contrib]/a11y/accessibility-menu.js
Skip to main content
null
Findings
  • Menu
  • Articles
    • Energy Findings
    • Resilience Findings
    • Safety Findings
    • Transport Findings
    • Urban Findings
    • All
  • For Authors
  • Editorial Board
  • About
  • Blog
  • covid-19
  • search

RSS Feed

Enter the URL below into your favorite RSS reader.

http://localhost:39917/feed
Transport Findings
November 05, 2021 AEST

Travel Time Impacts of Using Shared Automated Vehicles along a Fixed-Route Transit Corridor

Yantao Huang, Kara M. Kockelman,
transit corridortotal system costpublic transportationshared automated vehicles
Copyright Logoccby-sa-4.0 • https://doi.org/10.32866/001c.29147
Photo by Mitchell Kmetz on Unsplash
Findings
Huang, Yantao, and Kara M. Kockelman. 2021. “Travel Time Impacts of Using  Shared Automated Vehicles along a Fixed-Route Transit Corridor.” Findings, November. https:/​/​doi.org/​10.32866/​001c.29147.
Save article as...▾
Download all (3)
  • Figure 1. Corridor settings
    Download
  • Figure 2. Simulation flow of SAVs and pasengers
    Download
  • Figure 3. Total travel cost vs. SAVs’ share of PKT
    Download

Sorry, something went wrong. Please try again.

If this problem reoccurs, please contact Scholastica Support

Error message:

undefined

View more stats

Abstract

Shared automated vehicles (SAVs) offering a fixed-route transit may compete well against privately operated vehicles. This paper analyzes the system costs of all travelers along a 6.4-kilometer (4-mile) corridor under different penetration rates for 10-seat SAVs. The work prices out walking, waiting, riding, and driving times for all travelers in the corridor, along with vehicle ownership, parking, and operating costs. Results show that such self-driving mini-buses or SAVs lower total costs per passenger-kilometer traveled when SAV mode split exceeds 20 percent, even though walking and waiting are valued at relatively high cost. Such vehicles dramatically free up pavement (and parking) space, and perform even better when parking costs at drivers’ destinations are high.

1. Questions

Shared automated vehicles (SAVs) are expected to draw users from all modes, including traditional transit systems (Huang, Kockelman, and Truong 2021; Haboucha, Ishaq, and Shiftan 2017). SAV-based systems are likely to be far more demand responsive (including door-to-door) and physically nimble when stopping to pickup and dropoff passengers, relative to standard buses, thanks to smaller sizes. Without a human driver and with lower crash rates, they can be far more cost-effective than traditional transit, as the technology matures (U.S. Department of Transportation 2018b; Loeb and Kockelman 2019). While various surveys (Etzioni et al. 2021; Gurumurthy and Kockelman 2020) predict SAVs’ future market penetration, actual traffic conditions and total system costs are missing, for this kind of new “transit” service.

2. Methods

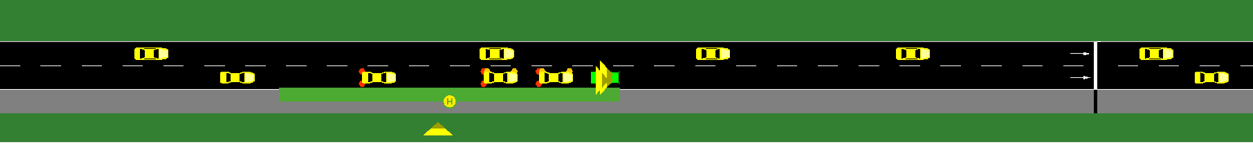
This work specifies detailed behaviors of human-driven cars or “background vehicles”, SAVs, and SAV users using Simulation of Urban Mobility (SUMO) software for a suite of detailed outputs, every half-second. All vehicles and riders share a straight one-way 2-lane, 6.4-kilometer (4-mile) corridor with a speed limit of 48 km/hr (30 miles/hr). During the 2-hour simulation period, both SAVs and background vehicles traverse the entire 6.4-kilometer corridor while riders use SAV services for 1.6-kilometer (1-mile) trips in the corridor. Uniformly generated at random positions along the corridor, riders walk to the nearest stop, take the next available SAV and alight at stops closest to their final destinations. If riders are waiting or have almost arrived at a stop, or there are onboard riders who plan to alight, SAVs must stop and then dwell at those locations, which are evenly placed every 0.4 kilometers (quarter mile), in the mid-point of each 0.4-kilometer road segment (Figure 1). The detailed simulation flow is shown in Figure 2. The TraCI Python module was used to ensure real-time control of vehicles and travelers. Each scenario required about 5 to 60 minutes of run-time, depending on SAV penetration rates.

Figure 1
Figure 1.Corridor settings
Figure 2
Figure 2.Simulation flow of SAVs and pasengers

This simulation uses 10-seat SAVs, which is a common SAV size for public AV demonstrations (U.S. Department of Transportation 2018a). Vehicle behavior and configurations are shown in Table 1. 4-seater, 6-seater, 20-seater and even 40-seater AVs (with some pasengers also standing) are possible as well, with different cost, service frequency, and traffic implications (Huang, Kockelman, and Truong 2021). Different SAV penetration rates are specified here, as different shares from a fixed 19,312 person-kilometers traveled (PKT) (12,000 person-miles traveled) background demand. Travelers shifting from privately owned or used vehicles to SAVs with dynamic ride-sharing (DRS) en route still results in the same 19,312 total PKT, in the corridor, as each of the private-vehicle occupants or drivers (for a 6.4-kilometer total-corridor trip) results in 4 separate 1.6-kilometer (1-mile) trips in the SAVs. More boardings and alightings will add more complexity and congestion delays to the corridor, but may still beat the private car rides, thanks to higher vehicle occupancies in 10-seat SAVs. Here, SAVs are dispatched to provide 1.5 times the PKT demanded of them, in order to deliver an average load factor of 2/3 (or 6.7 seats occupied on average, in 10-seat SAVs).

Table 1.Vehicle configurations and other simulation parameters
SAVs Other vehicles in traffic Sources
Capacity (# of seats) 10 seats 4 seats Stocker and Shaheen 2017
Vehicle dimension Length (m) 5.5 m 4.3 Krajzewicz et al. 2012; GOGO Charters 2020
Width (m) 2.5 m 1.8
Height (m) 2.8 m 1.5
Lane changing model LC2013 Erdmann 2015
Car following model MinGap (m) 1 m 2.5 Morando et al. 2018
Acceleration rate (m/s2) 1.28 m/s2 2.6 Bae, Moon, and Seo 2019
Deceleration rate (m/s2) 1.63 m/s2 4.5
Emergency deceleration rate (m/s2) 9 Krajzewicz et al. 2012
Other parameters (e.g., driver imperfection) Krauss Krauß 1998
Boarding duration (second per rider) 4 seconds N/A Jara-Díaz and Tirachini 2013

Background vehicles are assumed to have an average vehicle occupancy (AVO) of 1.2 persons (U.S. Department of Transportation 2017) and values of travel time (VOTT) for drivers and passengers in these private vehicles are $15 and and $7.50 per person-hour, respectively. SAV riders are assumed to have a high VOTT ($30 per person-hour) while waiting at stops, but just $7.50 per person-hour once they are on board (Liu et al. 2017; Fan, Guthrie, and Levinson 2016). Background vehicles are assumed to have ownership and operating costs of $0.36 per kilometer (AAA 2020) plus a $3 parking fee at their destination, paid by each vehicle’s users or subsidized by the establishment providing the parking space (Litman 2012). Considering ownership and operating costs, 10-seat SAVs are assumed to cost $0.68 per kilometer driven (Bösch et al. 2018). Finally, SAVs are assumed to stop in the outside lane of this 2-lane (one-way) corridor, so they create congestion every time they stop. For other vehicle sizes and corridor designs, please see Huang, Kockelman, and Truong (2021).

3. Findings

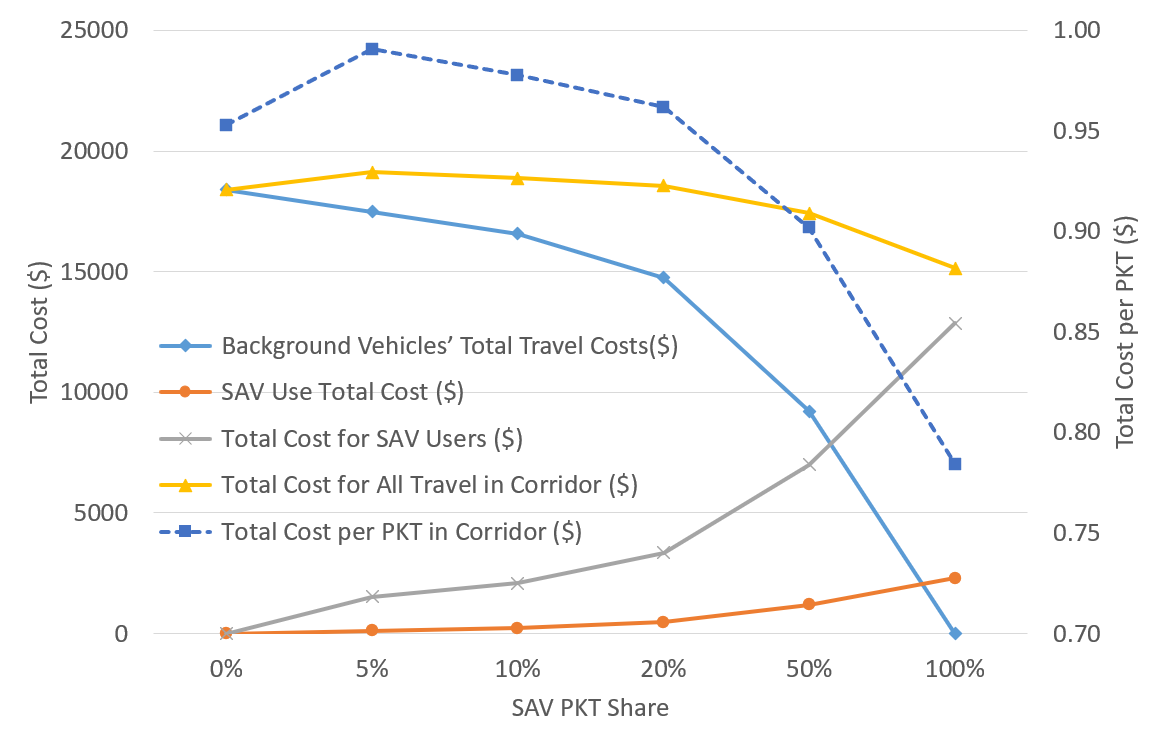
Table 2 shows the results of the 2-hour peak-period simulations. As travelers shift from private vehicles to SAVs, the background vehicles’ user costs fall and SAV system costs rise, but not per traveler. The total cost per PKT also rises, as SAV PKT share rises, at first. It peaks quickly, at approximately a 5% SAV-choice penetration rate. When the SAV PKT share reaches 20%, total travel costs in the corridor fall to the 100% private-vehicle (zero SAVs) scenario’s cost. These results suggest that roadway systems may benefit from 10-seat SAVs at mode splits higher than 20%. Of course, if private vehicles are also driven “autonomously”, their drivers’ VOTT will fall. But, if we include the true costs of private vehicles accessing the corridor as short trips, the way the SAV users are assumed to, the breakpoint favoring SAVs may happen much earlier.

Table 2.Corridor cost results across different SAV PKT shares
SAV PKT Share Background Vehicles
# Background-Vehicle (Private Car) Trips Background Vehicles’ Total Travel Time (hr) Background-Vehicles’ VOTT Costs ($) Parking Cost for Background Vehicles ($) Ownership & Use Cost of Background Vehicles ($) Background Vehicles’ Total Travel Costs($)
0% 2,500 car trips 353 hr $5,095 $7,500 $5,800 $18,395
5% 2,375 337 4,854 7,125 5,510 17,489
10% 2,250 319 4,602 6,750 5,220 16,572
20% 2,000 285 4,104 6,000 4,640 14,744
50% 1,250 178 2,571 3,750 2,900 9,221
100% - - - - - -
SAV PKT Share SAV Riders SAV
# SAV Riders SAV Rider Onboard Travel-Time Cost ($) SAV Rider Wait Time Costs ($) Average SAV User Wait Time (minutes) Total Cost for SAV Users ($) # SAVs Needed SAV Use Total Cost ($)
0% - - - - - 0 SAVs -
5% 600 riders $245 $1,272 4.2 min $1,517 27 $119
10% 1,200 497 1,583 2.6 2,080 51 224
20% 2,400 977 2,380 2.0 3,357 106 466
50% 6,000 2,284 4,721 1.6 7,005 270 1,188
100% 12,000 4,221 8,634 1.4 12,854 520 2,288
SAV PKT Share Total Cost for All Travel in Corridor ($) Total Cost per PKT in Corridor ($) SAV Average Vehicle Occupancy (AVO) SAV AVO in Center 2-mile Section of Corridor
0% $18,395 $0.95 per PKT in corridor 0 0
5% 19,125 0.99 56% 71%
10% 18,876 0.98 59% 75%
20% 18,568 0.96 57% 74%
50% 17,414 0.90 56% 66%
100% 15,142 0.78 58% 62%

In the extreme case, when all travelers are served by SAVs (and other, non-motorized modes, for example), total cost falls to $0.78 per PKT, which is 18% less than the “business as usual” (100% private vehicles) scenario. Importantly, only 520 SAV trips are needed along the corridor during the 2-hr simulation, lowering total vehicle footprints by about 80%, which is dramatic.

Figure 3
Figure 3.Total travel cost vs. SAVs’ share of PKT

The corridor may experience slower traffic than simulated because the human-driven vehicles will create congestion when entering, exiting and stopping along the corridor, and may crash more often. Therefore, shifting to SAVs may bring more benefits than estimated here. But fixed-route SAVs service may not be accessible for everyone, because of walking (access) distances to access the stop or people with travel limitations who still need door-to-door service. Constructing dedicated lanes for SAV stops can improve operational effiency and safety (by interrupting fewer background vehicles), but would cost more (for right of way and construction). Related to this, the cost analysis would be more comprehensive if external cost were included, such as emissions, collisions, and noise.

Overall, this analysis suggests that cities and corridors will benefit from higher SAV penetration rates, even with more short trips, and many stops along the way. Transit agencies using SAVs to serve fixed-route transit corridors can save society money, while dramatically reducing vehicles’ footprints, thereby freeing up pavement for other uses. Of course, incentives to ensure such mode splits (like congestion pricing of corridors, transit use subsidies, and higher gas taxes in undertaxed nations like the U.S.) will also be needed, to get the mode splits to shift so much from current conditions in many settings. Fortunately, smart, connected (to cellular) vehicles will have such capability, and conventional vehicles can be upgraded now for 5G-based pricing.


Acknowledgments

The authors thank Jade (Maizy) Jeong for her excellent editing and submission support.

Submitted: April 13, 2021 AEST

Accepted: October 12, 2021 AEST

References

AAA. 2020. “YOUR DRIVING COSTS: How Much Are You Really Paying to Drive?” https:/​/​exchange.aaa.com/​wp-content/​uploads/​2019/​09/​AAA-Your-Driving-Costs-2019.pdf.
Bae, Il, Jaeyoung Moon, and Jeongseok Seo. 2019. “Toward a Comfortable Driving Experience for a Self-Driving Shuttle Bus.” Electronics 8 (9): 943. https:/​/​doi.org/​10.3390/​electronics8090943.
Google Scholar
Bösch, Patrick M., Felix Becker, Henrik Becker, and Kay W. Axhausen. 2018. “Cost-Based Analysis of Autonomous Mobility Services.” Transport Policy 64 (May):76–91. https:/​/​doi.org/​10.1016/​j.tranpol.2017.09.005.
Google Scholar
Erdmann, Jakob. 2015. “SUMO’s Lane-Changing Model.” In Modeling Mobility with Open Data, 105–23. Cham: Springer International Publishing. https:/​/​doi.org/​10.1007/​978-3-319-15024-6_7.
Google Scholar
Etzioni, S., R.A. Daziano, E. Ben-Elia, and Y. Shiftan. 2021. “Preferences for Shared Automated Vehicles: A Hybrid Latent Class Modeling Approach.” Transportation Research Part C: Emerging Technologies 125:103013.
Google Scholar
Fan, Yingling, Andrew Guthrie, and David Levinson. 2016. “Waiting Time Perceptions at Transit Stops and Stations: Effects of Basic Amenities, Gender, and Security.” Transportation Research Part A: Policy and Practice 88 (June):251–64. https:/​/​doi.org/​10.1016/​j.tra.2016.04.012.
Google Scholar
GOGO Charters. 2020. Minibus Comparison Chart. https:/​/​gogocharters.com/​mini-bus-comparison-chart.
Gurumurthy, Krishna Murthy, and Kara M. Kockelman. 2020. “Modeling Americans’ Autonomous Vehicle Preferences: A Focus on Dynamic Ride-Sharing, Privacy & Long-Distance Mode Choices.” Technological Forecasting and Social Change 150 (January):119792. https:/​/​doi.org/​10.1016/​j.techfore.2019.119792.
Google Scholar
Haboucha, Chana J., Robert Ishaq, and Yoram Shiftan. 2017. “User Preferences Regarding Autonomous Vehicles.” Transportation Research Part C: Emerging Technologies 78 (May):37–49. https:/​/​doi.org/​10.1016/​j.trc.2017.01.010.
Google Scholar
Huang, Yantao, Kara M. Kockelman, and Long T. Truong. 2021. “SAV Operations on a Bus Line Corridor: Travel Demand, Service Frequency, and Vehicle Size.” Journal of Advanced Transportation 2021 (July):5577500. https:/​/​doi.org/​10.1155/​2021/​5577500.
Google Scholar
Jara-Díaz, S., and A. Tirachini. 2013. “Urban Bus Transport: Open All Doors for Boarding.” Journal of Transport Economics and Policy 47 (1): 91–106.
Google Scholar
Krajzewicz, D., J. Erdmann, M. Behrisch, and L. Bieker. 2012. “Recent Development and Applications of SUMO-Simulation of Urban MObility.” International Journal On Advances in Systems and Measurements 5 (3 & 4).
Google Scholar
Krauß, S. 1998. “Microscopic Modeling of Traffic Flow: Investigation of Collision Free Vehicle Dynamics.” Doctoral dissertation.
Litman, T. 2012. “Parking Costs, Transportation Cost and Benefit Analysis: Techniques, Estimates and Implications.” Victoria Transport Policy Institute. https:/​/​www.vtpi.org/​tca/​tca0504.pdf.
Liu, Jun, Kara M. Kockelman, Patrick M. Boesch, and Francesco Ciari. 2017. “Tracking a System of Shared Autonomous Vehicles across the Austin, Texas Network Using Agent-Based Simulation.” Transportation 44 (6): 1261–78. https:/​/​doi.org/​10.1007/​s11116-017-9811-1.
Google Scholar
Loeb, Benjamin, and Kara M. Kockelman. 2019. “Fleet Performance and Cost Evaluation of a Shared Autonomous Electric Vehicle (SAEV) Fleet: A Case Study for Austin, Texas.” Transportation Research Part A: Policy and Practice 121 (March):374–85. https:/​/​doi.org/​10.1016/​j.tra.2019.01.025.
Google Scholar
Morando, Mark Mario, Qingyun Tian, Long T. Truong, and Hai L. Vu. 2018. “Studying the Safety Impact of Autonomous Vehicles Using Simulation-Based Surrogate Safety Measures.” Journal of Advanced Transportation 2018:1–11. https:/​/​doi.org/​10.1155/​2018/​6135183.
Google Scholar
Stocker, A., and S. Shaheen. 2017. “Shared Automated Vehicles: Review of Business Models.” International Transport Forum Discussion Paper. https:/​/​www.itf-oecd.org/​shared-automated-vehicles-review-business-models.
U.S. Department of Transportation. 2017. “Summary of Travel Trends 2017 National Household Travel Survey.” https:/​/​nhts.ornl.gov/​assets/​2017_nhts_summary_travel_trends.pdf.
———. 2018a. “Autonomous Vehicle Fleet Ownership and Operating Costs Are Expected to Be Half That of Traditional Vehicles by 2030-2040.” https:/​/​www.itskrs.its.dot.gov/​its/​benecost.nsf/​ID/​52ada2ffac6ec4b4852582f00067a4e3.
———. 2018b. “Low-Speed Automated Shuttles: State of the Practice. Final Report.” https:/​/​rosap.ntl.bts.gov/​view/​dot/​37060/​dot_37060_DS1.pdf?

This website uses cookies

We use cookies to enhance your experience and support COUNTER Metrics for transparent reporting of readership statistics. Cookie data is not sold to third parties or used for marketing purposes.

Powered by Scholastica, the modern academic journal management system