

1. Questions
Scooters could arguably replace motorized trips (Abouelela, Al Haddad, and Antoniou 2021), or at least reduce their negative impacts, especially if they are well integrated with existing public transportation. This integration can solve the first and last-mile dilemma (Fearnley, Johnsson, and Berge 2020), increasing accessibility to public transportation (Oeschger, Carroll, and Caulfield 2020), but also leading to more sustainable transportation systems (Kager, Bertolini, and Brömmelstroet 2016). One of the most important, but not yet studied aspects of scooter integration with public transportation, is the distance between the stops and the scooters, as walking distance willingness could be a factor affecting or determining the use of different transportation services. In this study, we assessed the distances between bus stops and parked scooters both temporally and spatially. Temporal analysis considered different hours of the day and different days of the week, while spatial analysis looked at different land uses, distances from the city center, and accessibility to public transportation (bus). This assessment aimed to answer following research questions:
-
What is the average distance between scooter trip starting points (origins) and the nearest public transportation stops, in this case bus stops?
-
How do different temporal and spatial factors influence the distance between parked scooters and nearest bus stops?
2. Methods
We used the open scooter trips data[1] from Louisville, Kentucky, to analyze the relation between trips starting points and the nearest bus stops, as buses are the only available public transportation services in the city, organized by the Transit Authority of River City (TARC, ridetarc.org). We collected 505,993 trips starting the 9th of August 2018 till the 31st of January 2020.[2] Subsequently, we removed trips outside the operation zones, trips with distances less than 100 meters[3] or more than 50 km, with durations more than 120 minutes, or speeds higher than 25 km/hour, resulting in 379,308 trips (75% of the original trips). The bus stops locations were defined using GTFS files downloaded from the Open Mobility Data platform (transitfeeds.com). We retrieved the city’s land use data from the city portal (data.louisvilleky.gov). Finally, the census zones limits used for the Local Index of Transit Availability (LITA) calculation were retrieved from the USA Census Bureau (census.gov).
To answer the first research question, we used the Approximate Nearest Neighbor (ANN) searching algorithm library (Arya et al. 2019) available in the statistical software package R (R Core Team 2021), in order to calculate the euclidean distance between trips’ starting points[4] and the nearest bus stops.
To answer the second research question, the distance was calculated and aggregated for different temporal features, meaning different hours of the day, and different days of the week. For assessing the impact of spatial features, three metrics were considered: land use (considering the land use of the trip starting point), distance from city center , and LITA (for the different census zones). Thereafter, parking distances were assessed spatially.
LITA calculations consider three aspects of public transportation service characteristics per census zone:
-
Route coverage score: the number of public transportation stops per zone
-
Frequency: the daily number of buses traveling the zone
-
Capacity: seat–miles per capita
LITA is calculated as the total daily seats on the bus line [bus capacity (assumed 36 seat/bus for TARC buses) multiplied by the number of buses per day] multiplied by the length of the bus route in the zone (in miles), divided by the sum of the total resident and employment population per zone.
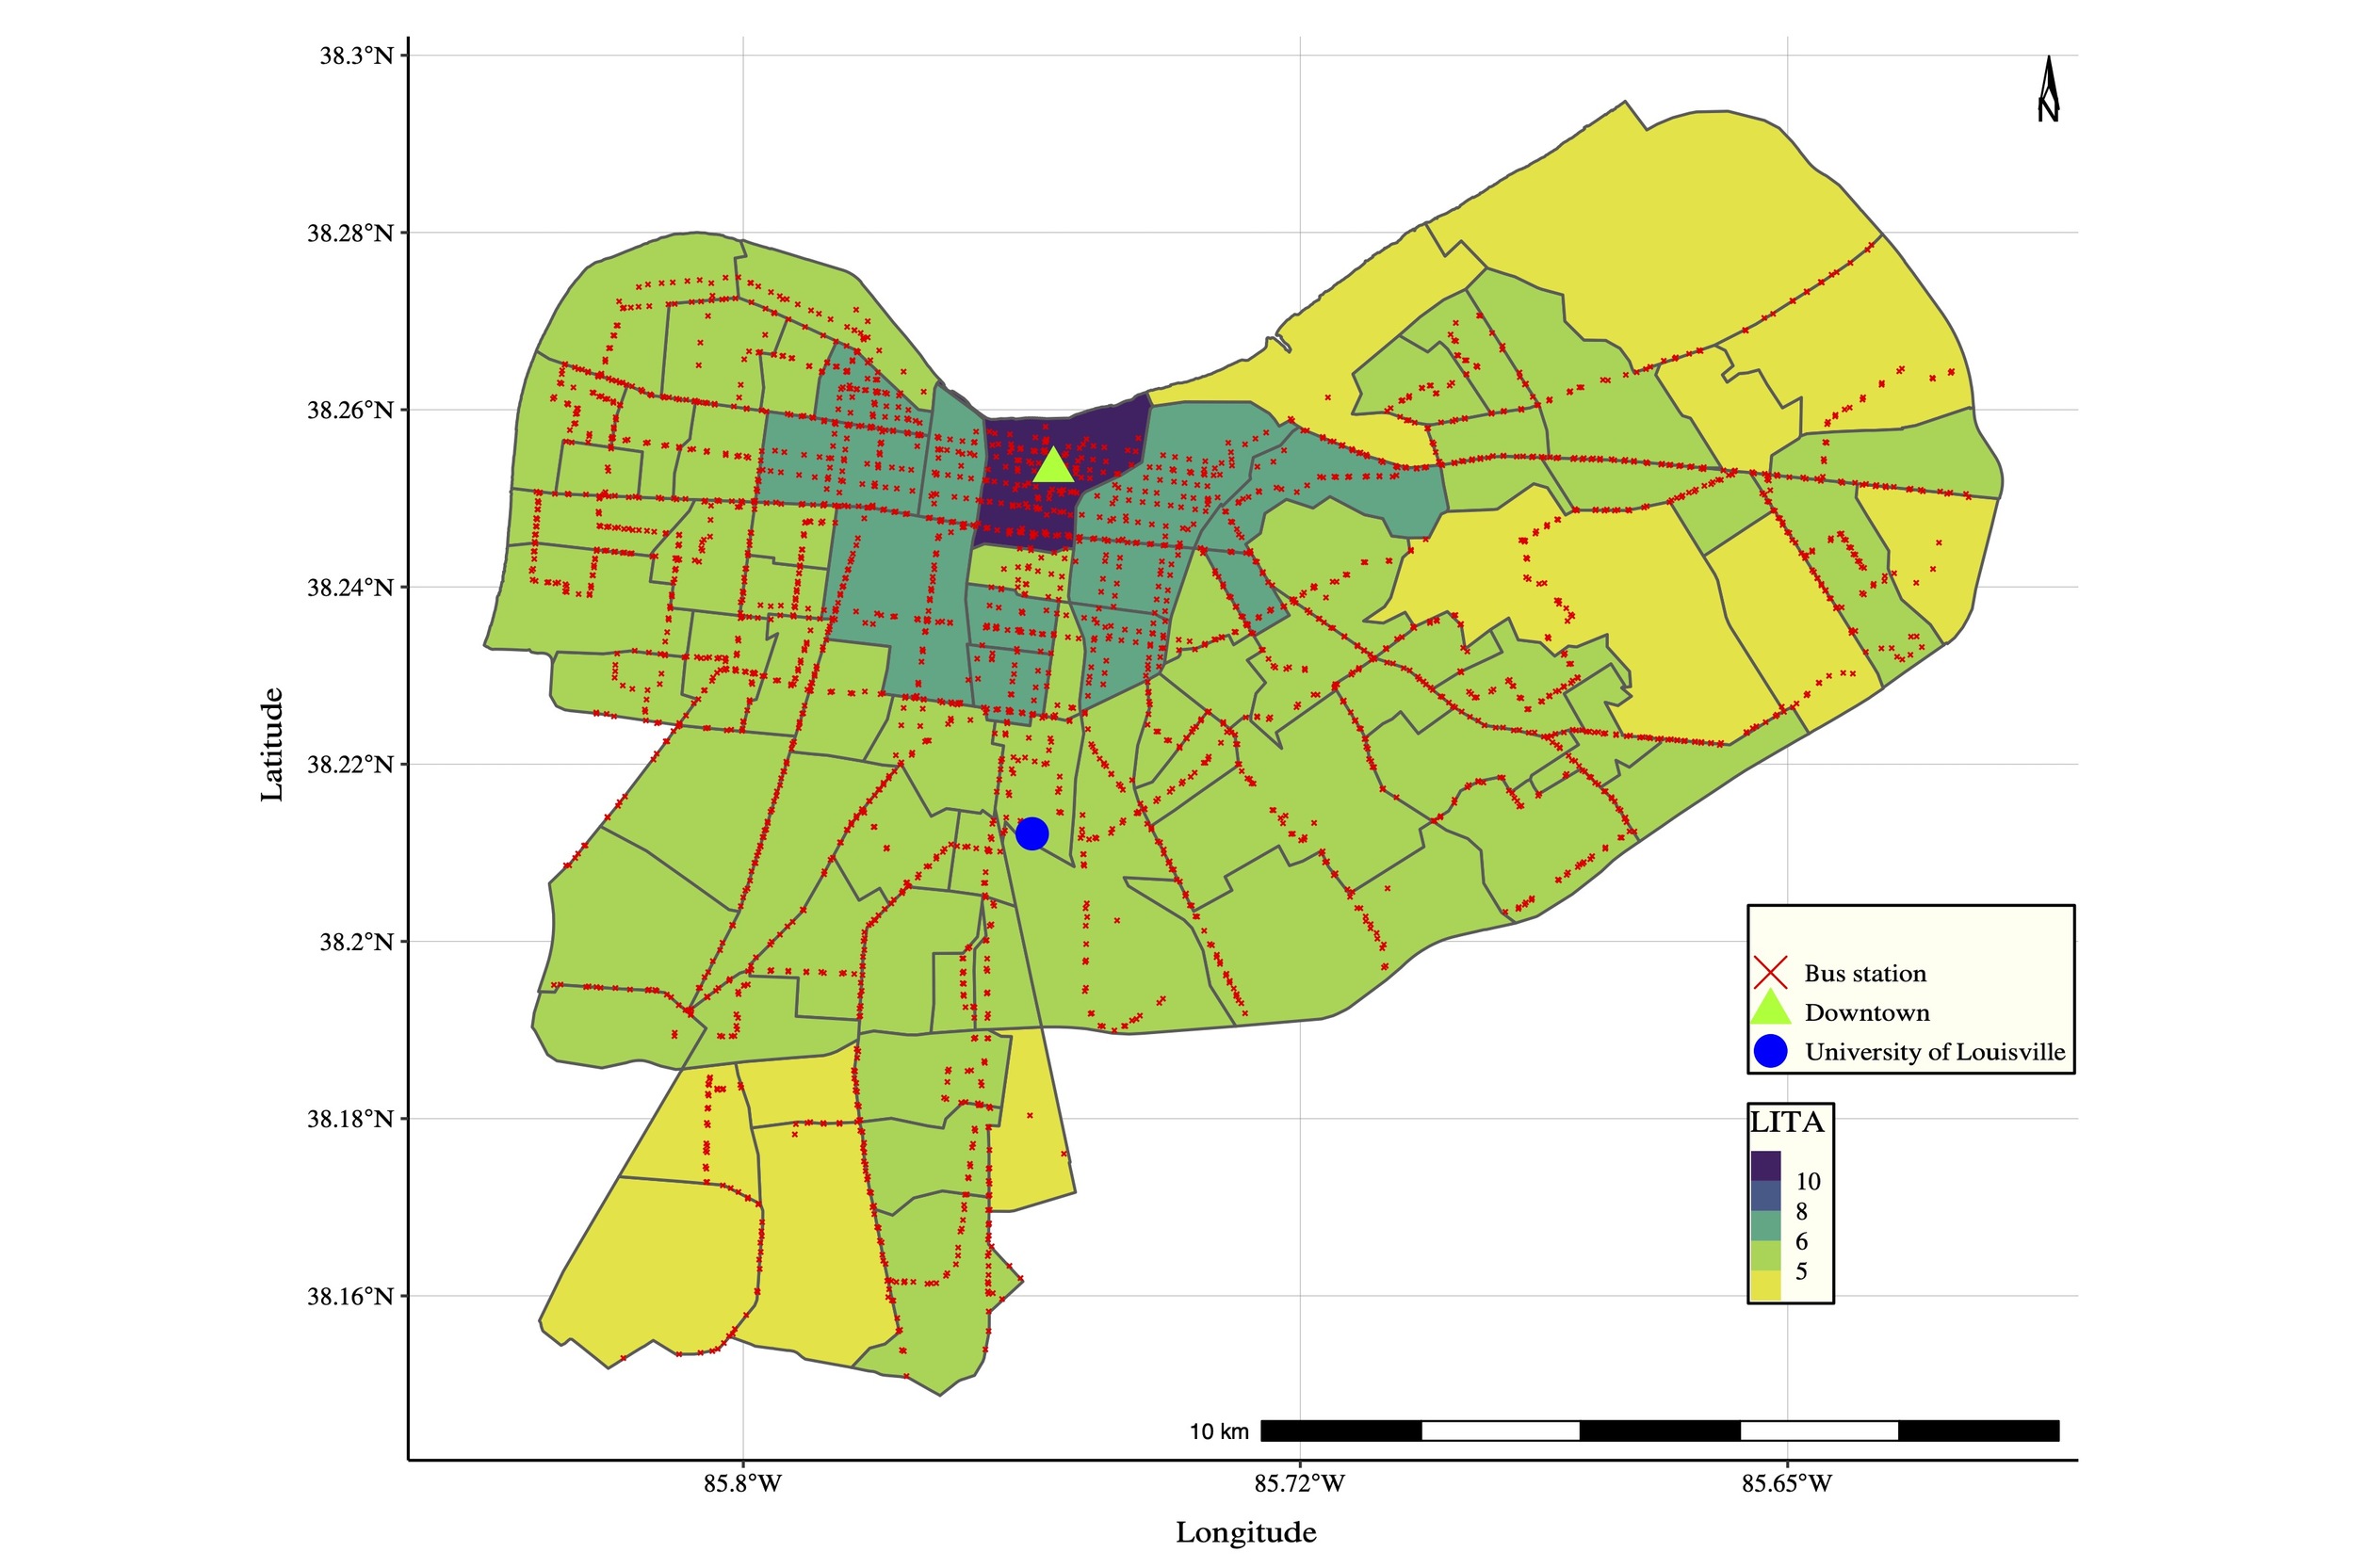
Inputs needed for the above metrics, such as the bus stops, number of daily buses, length of bus lines, were all calculated using the GTFS files. The average of the three scores was added to 5.5, to avoid negative numbers resulting in the LITA score (Chen 2018), for which the higher the value, the better the accessibility per zone. Figure 1 shows the calculated LITA per zone for Louisville, Kentucky.
It is to be noted that the trips’ geo-locations (latitude and longitude) were rounded to the nearest three decimal numbers for privacy reasons, which on average could affect the scooter location by 30 meters. While this approximation could have affected the distance calculations, the methodology used in this research could be generalized for other datasets with more accurate coordinates.
3. Findings
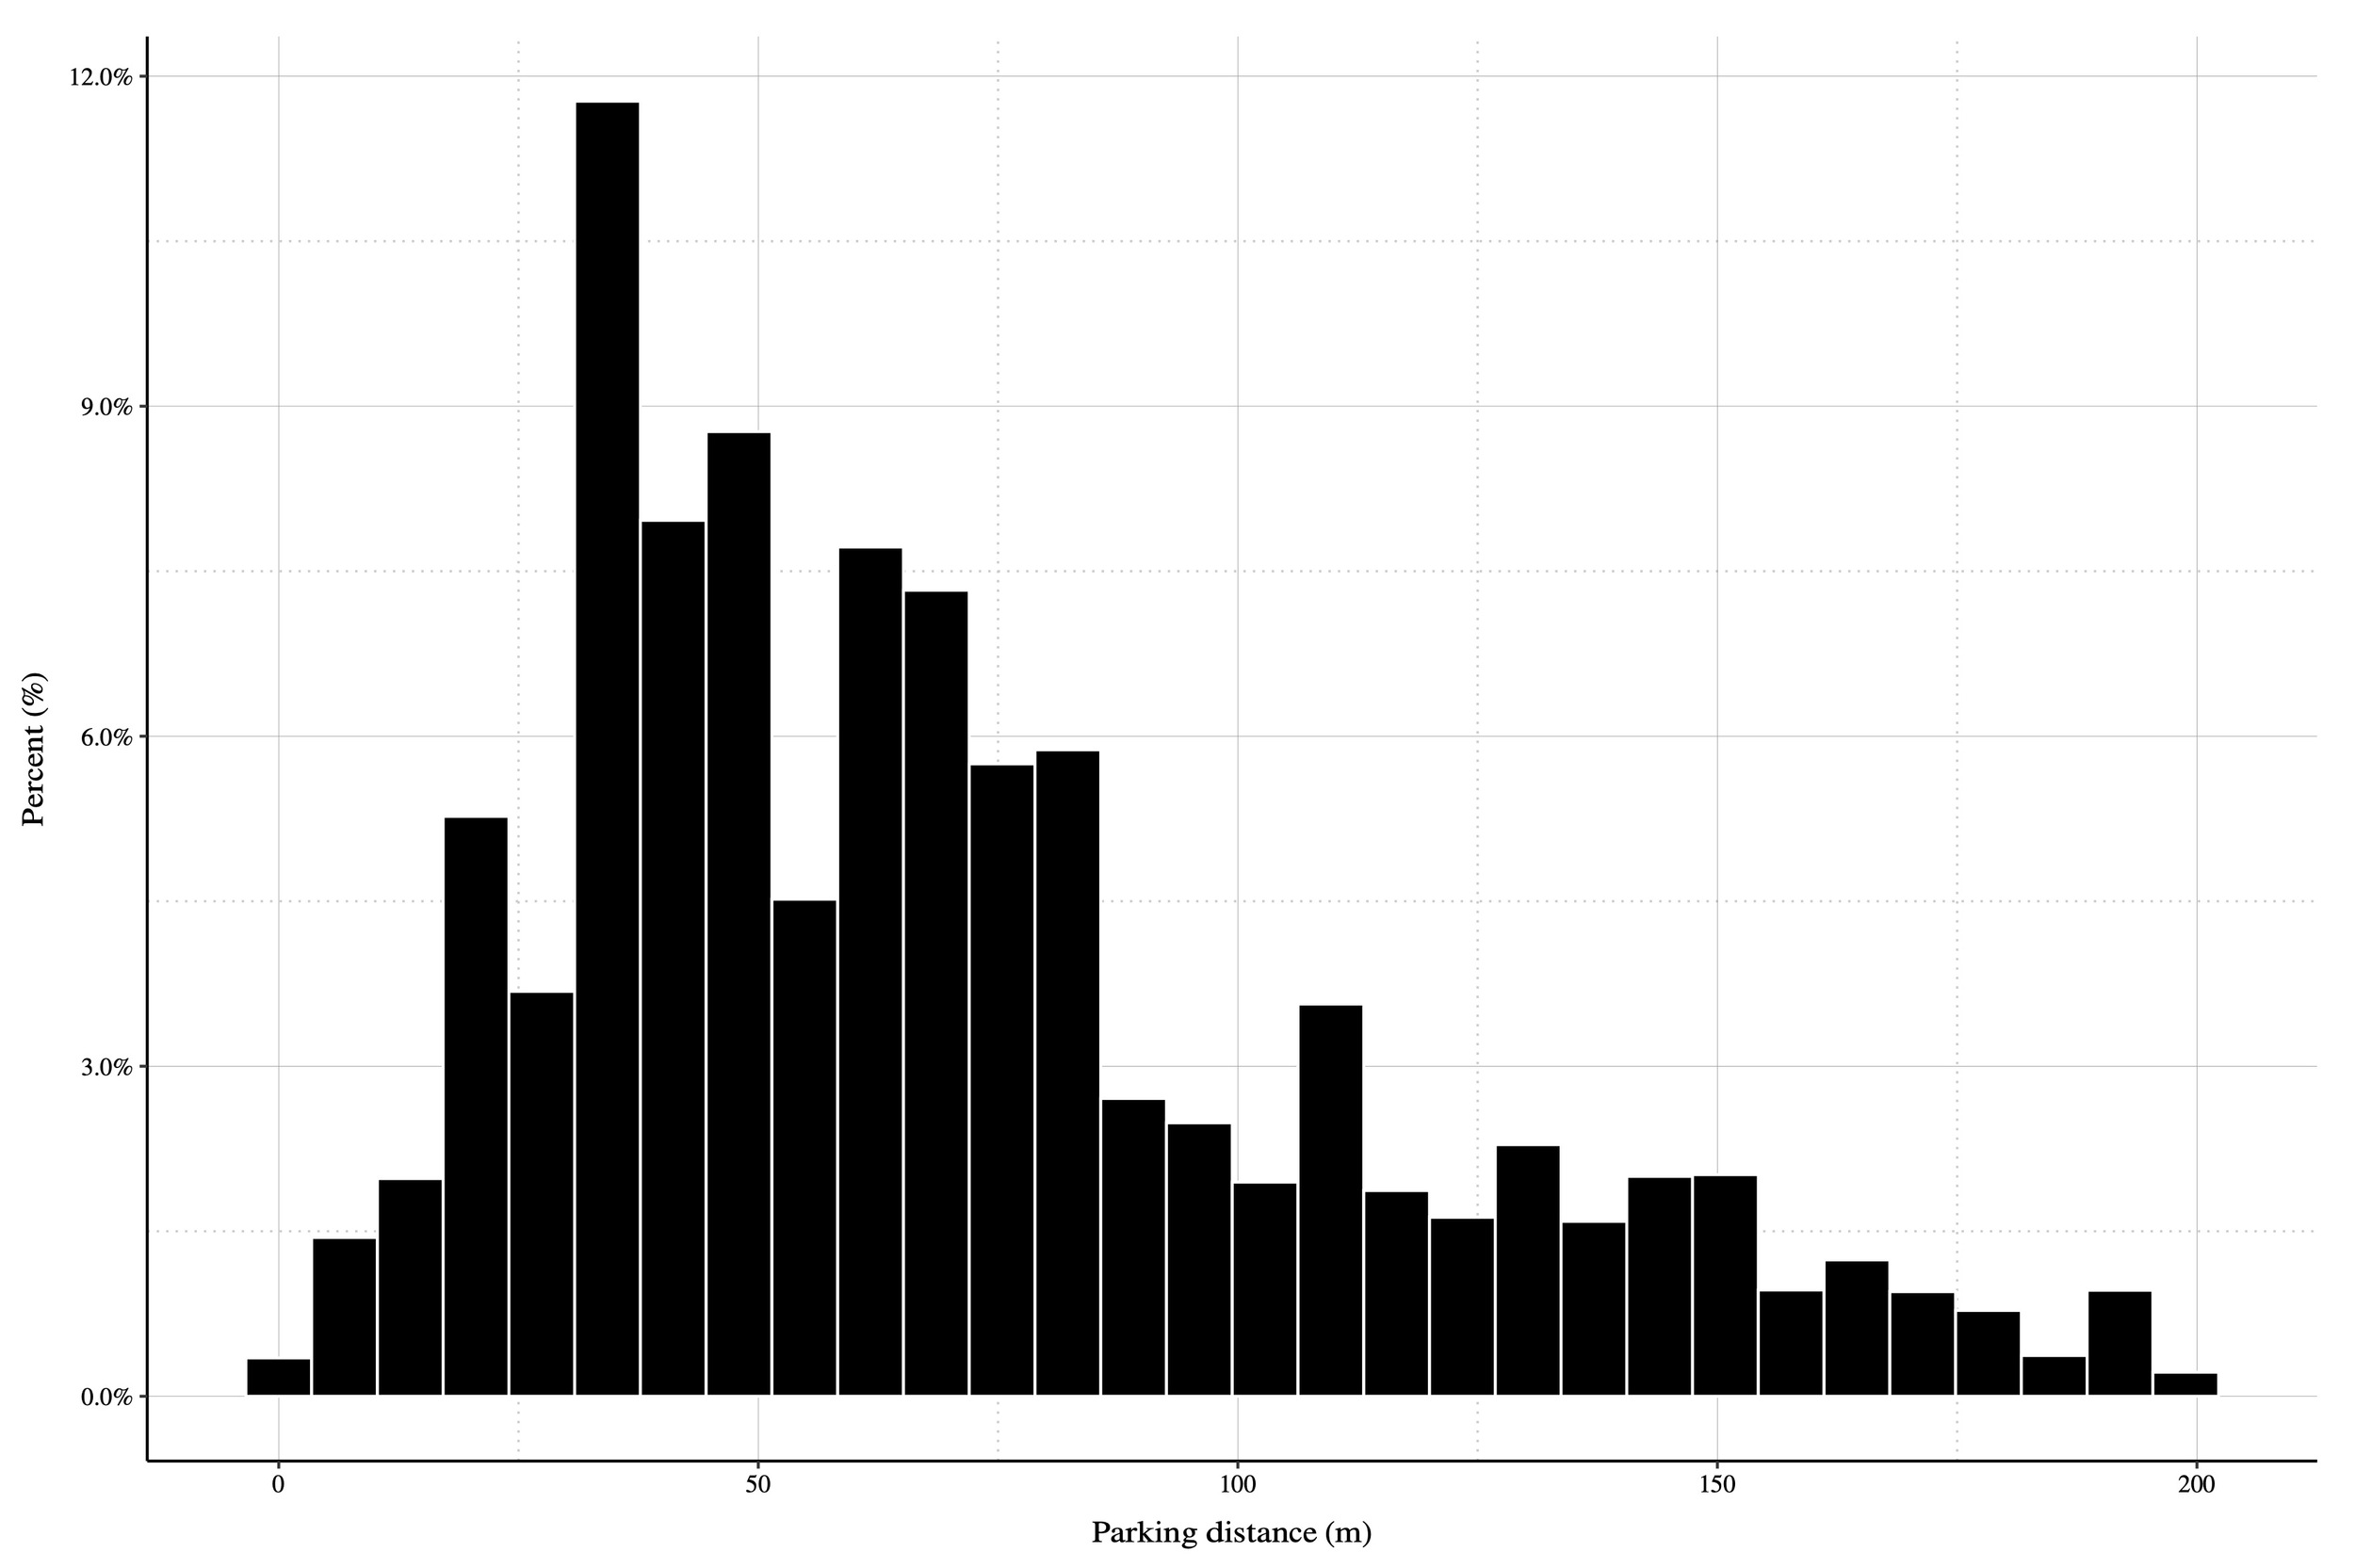
The euclidean distance calculations, along with the impact assessment of temporal and spatial features on parking distances between scooters and nearest bus stops, are summarized in Table 1. The obtained mean parking distance was found to be with a standard deviation m, which answers the first research question. The overall parking distance distribution is presented in Figure 2. Findings show that for 50% of the trips, scooters were parked within 70 meters from the nearest bus station, and for 85% of the trips, the parking distance was less than 200 meters.
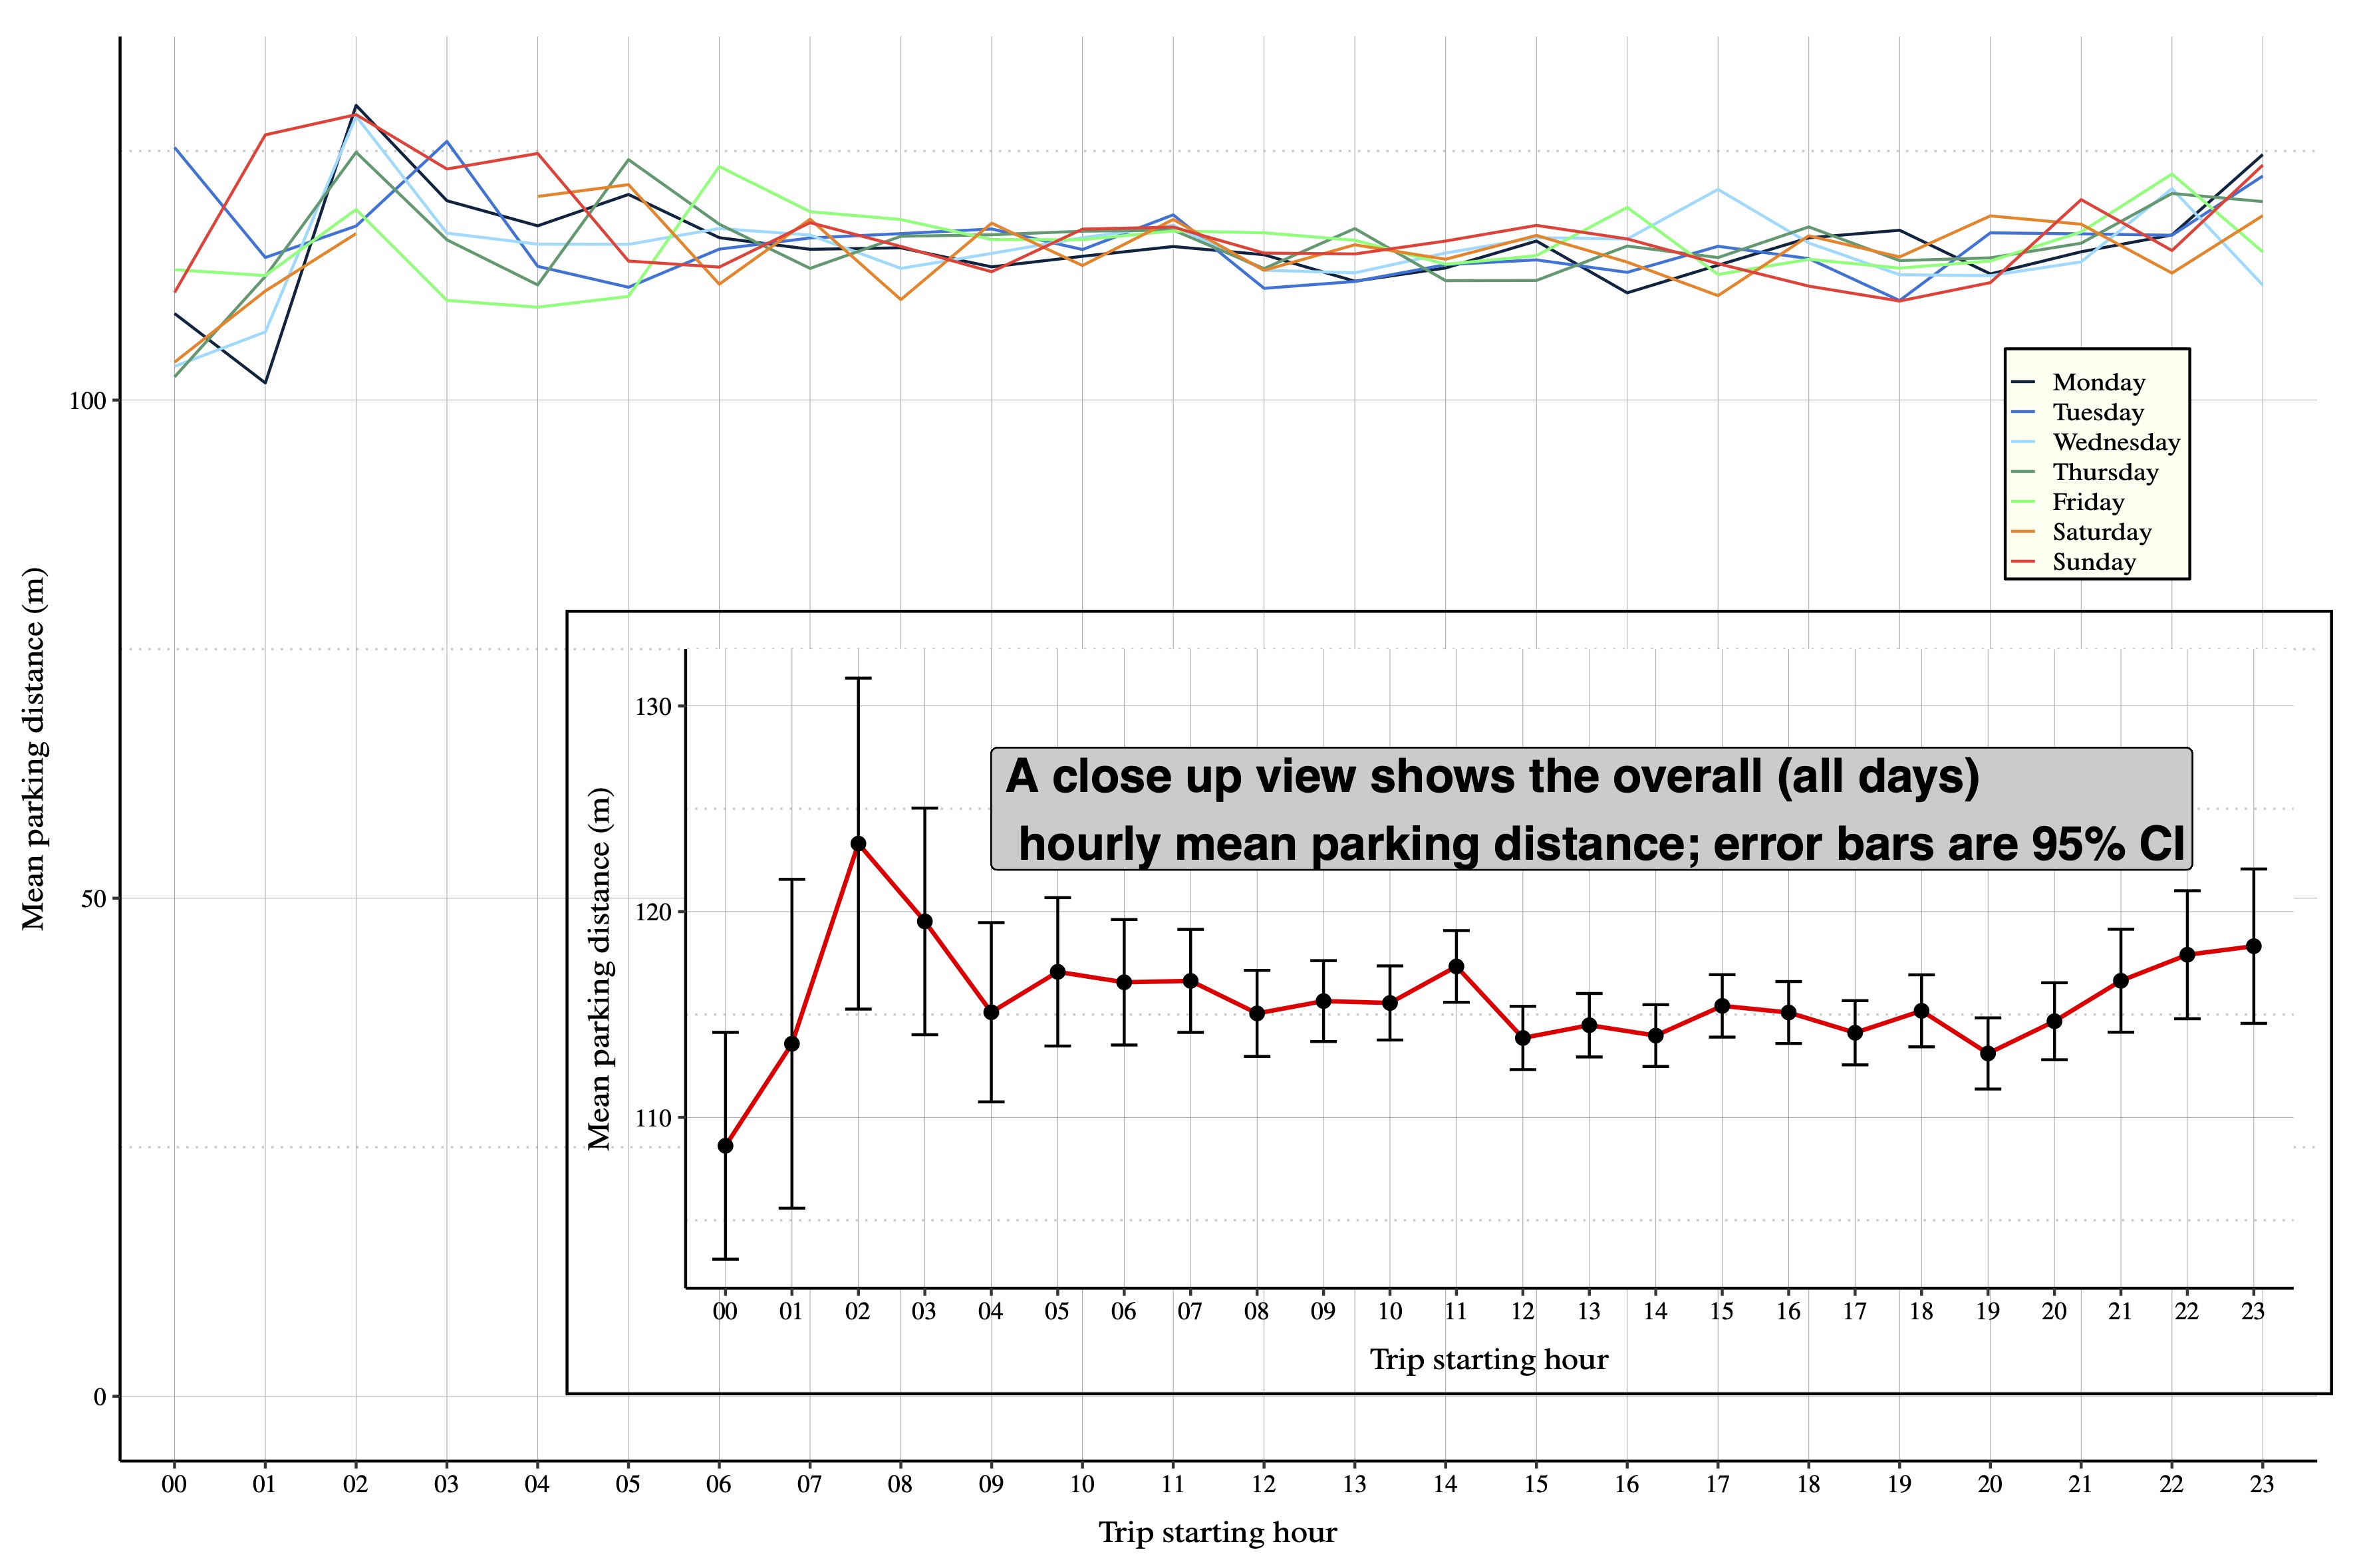
The hourly distribution of the distances for the different days (Figure 3) shows that the parking distance has a rather similar pattern throughout the day, except between 2 and 4 a.m. Parking distances between 2 and 4 a.m. are statistically different from the rest of the day[5] and tend to be longer, meaning that scooters tend to be further from bus stops. One possible reason could be the very small share of trips originating between 2 and 4 a.m. (about 0.6 % of the total daily trips). To investigate whether this was due to rebalancing and redistribution, distances were calculated between trip starting and ending points and the nearest bus stops, and their distribution compared with each other. Yet, as no statistical difference was found between both, there was no evidence to the rebalancing and redistribution effect. Longer distances might indicate that people use scooters from bus stops to travel further distances during early day hours (between 2 and 4 a.m.), which have no bus temporal coverage; in Louisville, the service hours for bus is between 5:30 a.m. and 10:30.[6] Also, early morning distances tend to be longer during the weekend compared to weekdays, which could be attributed to an increase in recreational activity during weekends.

Analyzing the distances according to varying land uses did not reveal any significant differences; however, the trip percentages showed that half of the trips started in commercial and public and semi-public land uses; this might indicate that scooters could have been used for recreational trips, as was supported in Noland (2019), and as observed in Washington, D.C. (McKenzie 2019). The distance to the nearest station per each category of LITA values showed no significant differences or relation between the distances and the zonal bus accessibility. However, 40% of the scooters were parked in highly bus–accessible areas (LITA = 10-11), which could indicate that scooters complement the use of buses or extend bus accessibility. Also, the distance between scooters and the nearest bus stop was not affected by the scooter’s locations away from the city center.
Findings indicated that scooters could be used to extend the temporal accessibility of the bus service. On the contrary, there was not sufficient evidence that distance is impacted by any tested spatial features, including LITA, and land use. Of course, a finer spatial resolution of the data could lead to a more accurate analysis; however, this might come at the price of jeopardizing users’ locations, and therefore privacy. Additional data, such as user survey data focusing on trip purpose and multimodality, could undoubtedly help in better understanding whether or not scooters are used as first and last mile access to and from public transport, in the case of Louisville, bus services.
The methodology presented in this paper could be replicated in other cities, in order to better understand scooter parking patterns, and whether the results obtained in Louisville would be comparable in other cities in the US, but also in the world. This could give an insight to service providers on how to better integrate scooters with existing public transportation systems.
data.louisvilleky.gov/dataset/dockless-vehicles, accessed 30/6/2021
Noland (2019) analyzed in more details the trip characteristics of a sample of this dataset.
The removal of short trips, less than 100 meters, was done to avoid GPS multipath errors, as done in McKenzie (2019) for cleaning shared e–scooters trips.
Only starting points or origins were considered to avoid data duplication; each trip origin or starting point is a previous trip destination or ending point.
This was found based on a t–test between the mean parking distances between 2 and 4 a.m. and the mean during the rest of the day.
https://moovitapp.com/index/en/public_transit-line-17-Louisville_KY-1442-11408-240824-0, accessed 1/7/2021