
1. Questions
Racial bias in policing is a significant concern in Canadian cities (Samuels-Wortley 2019), with racialized people[1] found to be “grossly over-represented in discretionary, lower-level charges” (Ontario Human Rights Commission 2020), both in general policing and in areas such as transit enforcement (Owusu-Bempah and Wortley 2020). Understanding the relationship between planning and policing is necessary to mitigate against “patterns of racialized harm” (Simpson, Steil, and Mehta 2020, 133). Despite recent research demonstrating the disproportionate impacts of policing on cyclists (Barajas 2021), there has been little analysis of cyclist enforcement in Canadian cities.
This research seeks to answer the following questions: what are the types and frequencies of tickets issued to cyclists? Are there disparities in cyclist enforcement and how do they vary by neighbourhood context? As there has been little research in this area in Canadian cities, this research also assessed the data limitations in understanding the impact of policing on cyclists. This research focuses on Winnipeg, Manitoba, a city with above-average levels of segregation (Walks and Bourne 2006), historic and on-going colonial-settler violence (Dorries et al. 2019), and documented evidence of racial bias in policing (Comack 2019). While the results focus on Winnipeg, the results will be of interest to policymakers in other Canadian cities.
2. Methods
We used a freedom of information request to the Winnipeg Police Service to obtain all tickets issued to cyclists from 2018 to 2020. Winnipeg Police do not collect demographic information (such as race or gender) when giving citations so data was limited to type of offence, date and location. Cyclists can be charged under the Manitoba Highway Traffic Act for offenses including failure to exercise due care and attention; failure to wear a helmet (under 18 only); failure to ride as closely as practicable to right-hand curb; failure to have lights or reflectors; or, riding a bicycle on sidewalk (for bicycles with wheel diameter larger than 41 cm, i.e. adult bicycles).
The data provided included 1,012 tickets issued to cyclists, of which 86% included a usable location (either address or intersection). The ticket locations and type of offence were mapped using QGIS. If tickets were issued on a boundary between census tracts, they were distributed equally between the tracts. In the absence of ticket-specific data, we used census-tract level data from the 2016 Canada Census (Statistics Canada 2016). Neighbourhood analysis included percentage of racialized (visible minority[2] and Indigenous identity), low income (using the Low-Income Measure or LIM, which is based on median household incomes), and immigrant residents, as well as percentage of trips to work by bicycle. We used ticket counts and neighbourhood demographic data to develop descriptive statistics about where tickets were issued.
3. Findings
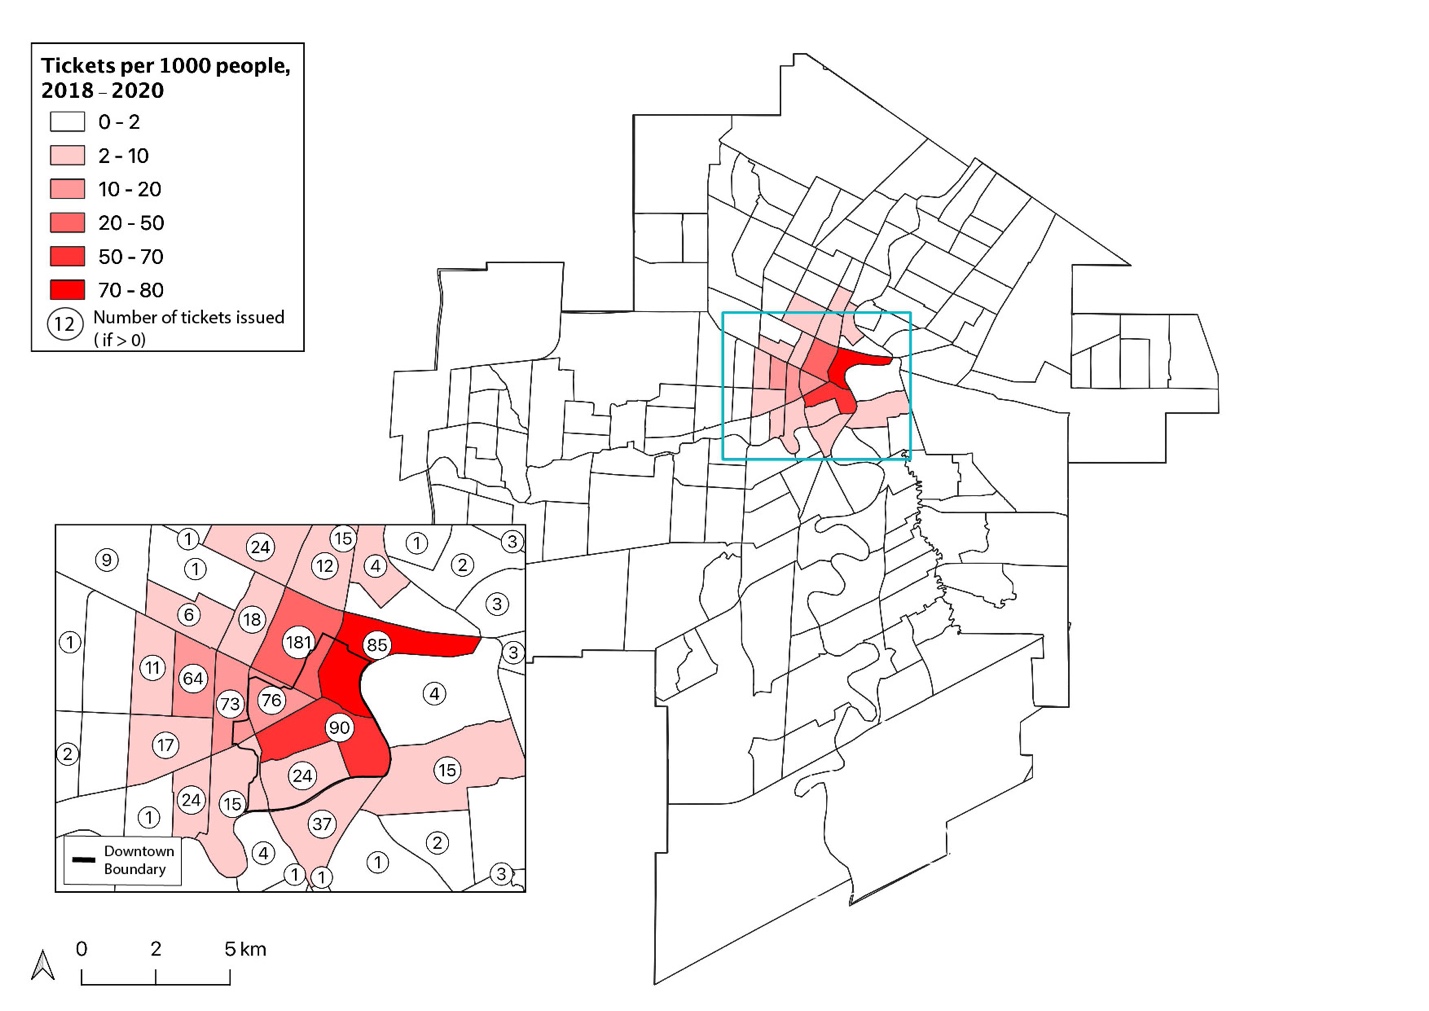
The vast majority of tickets (96%) were issued for either ‘failure to exercise due care and attention’ (73%) or ‘operating a bicycle on a sidewalk’ (23%). Figure 1 shows the ticketing rate per 1000 people for every census tract in the city, as well as the number of tickets issued in central core neighbourhoods. Tickets were issued to cyclists across the city, but the majority of census tracts had zero tickets (Table 1) and there were no census tracts with a rate above 2 tickets/1000 people outside of the central core. While the average rate of ticketing citywide was 1 ticket/1000 people, inner-city areas had rates as high as 77 tickets/1000 people. Of all the tickets issued, 58% were given in five inner city census tracts, which have 2% of the city’s population.
.jpeg)
For the most part, census tracts that had the highest ticketing rates generally had more (1) low-income residents, (2) residents that identify as a visible minority or Aboriginal, and (3) residents that are immigrants, compared with the City of Winnipeg as a whole (Table 2). The five census tracts with the highest ticketing rates had above-average rates in almost every indicator studied. For the five indicators assessed, the census tracts with highest ticketing rates were above the city average in 22 of 25 instances (88%). While some highly-ticketed areas were below the city average in percentage of visible minority, Aboriginal identity, or immigrant residents, all of these areas had higher rates of poverty (Figure 2), including more than three times the city average. Highly-ticketed areas also uniformly show measures of child poverty (LIM for residents under the age of 17) that are substantially higher than the city average, with these census tracts having rates 35 – 48% higher than the rest of the city. Three of the highest ticketed census tracts had cycling commute rates less than or equal to the city average, while two had higher cycling rates.

This analysis shows problematic levels of policing in low-income and racialized communities but the assessment is limited due to data unavailability. The demographics of those receiving tickets is not collected by police in Winnipeg, similar to other Canadian jurisdictions that suppress relevant racial and demographic data (Millar and Owusu-Bempah 2011). While cyclists may not live in the areas in which they receive tickets, the unavailability of person-specific data should not preclude analysis of community disparities in policing. A second data omission is area or route-specific cycling counts, to allow for adjusting the number of tickets by actual cyclist rates rather than journey to work census data. The most recent active transportation plan states that there is a high concentration of cycling activity in the central neighbourhoods (City of Winnipeg and Urban Systems 2014, 64), though other reports show that less than 50% of bike commute trips go through downtown (Bike Winnipeg 2016, 12). Cyclists counts were only available for off-road trails (City of Winnipeg 2021), limiting understandings of the impact of policing on equity-seeking communities. Future research should also attempt to exogenously observe the number of violations per bicyclist in various parts of the city, rather than relying on selective enforcement statistics.
The term racialized is used to reflect race as a social construct, rather than using inaccurate terms such as racial or visible minority (Ontario Human Rights Commission 2020).
While visible minority is a problematic and inaccurate term (see Millar and Owusu-Bempah 2011) it is used here to reflect how census data is collected and reported.