Loading [Contrib]/a11y/accessibility-menu.js
Skip to main content
null
Findings
  • Menu
  • Articles
    • Energy Findings
    • Resilience Findings
    • Safety Findings
    • Transport Findings
    • Urban Findings
    • All
  • For Authors
  • Editorial Board
  • About
  • Blog
  • covid-19
  • search

RSS Feed

Enter the URL below into your favorite RSS reader.

http://localhost:5959/feed
Transport Findings
October 06, 2021 AEST

How Does the COVID-19 Pandemic Affect Transport-Related Diesel Consumption in the U.S.?

Xinyi Wu, Yan Zhou, Zifeng Lu, Xin He,
transportationfreightenergycovid-19diesel consumption
Copyright Logoccby-sa-4.0 • https://doi.org/10.32866/001c.28109
Photo by elCarito on Unsplash
Findings
Wu, Xinyi, Yan Zhou, Zifeng Lu, and Xin He. 2021. “How Does the COVID-19 Pandemic Affect Transport-Related Diesel Consumption in the U.S.?” Findings, October. https:/​/​doi.org/​10.32866/​001c.28109.
Save article as...▾
Download all (2)
  • Figure 1. Estimated Diesel Consumption Relative to the Baseline (2018) Consumptions in Six Selected States
    Download
  • SI
    Download

Sorry, something went wrong. Please try again.

If this problem reoccurs, please contact Scholastica Support

Error message:

undefined

View more stats

Abstract

Understanding how energy usage reacts to the COVID-19 pandemic is essential to making strategic policy decisions. This study aims to quantify the pandemic’s influences on diesel consumption and explore the potential causes of the differences across regions. We found various levels of reduction in diesel consumption at the state level during the pandemic in the U.S. Many factors, including COVID-19 cases and commodities being moved, are associated with these reductions. In particular, at the state level, more truck/train shipping of minerals, coal, and forest products associates with fewer truck activities and greater decreases in diesel consumption.

1. QUESTIONS

Despite several studies focusing on how the COVID-19 pandemic affects freight movement (Hu and Chen 2021; Ou et al. 2020), few have explored its correlation with transportation-related diesel consumption. This study aims to quantify the pandemic’s association with diesel consumption and explore the potential causes of the differences across regions. This paper answers the following research questions:

  • How does the transportation diesel consumption fluctuate during the COVID-19 pandemic in the U.S.?

  • What are the contributing factors to the change in transportation diesel consumption?

2. METHODS

The transportation sector is the largest consumer of diesel fuel in the U.S., accounting for 80% of diesel consumption in 2020 relative to industrial, commercial, and residential sectors (EIA, 2021). Therefore, we used total diesel consumption in the U.S. as the indicator to study COVID-19’s impact on the transportation sector. Due to the practical difficulty in collecting daily and weekly diesel consumption, we used the four-week moving average product supplied of distillate fuel oil estimated by EIA as a proxy. For the rest of the paper, we state diesel consumption instead of diesel supply unless otherwise stated. Because of the difficulty in acquiring daily or weekly truck activity data by commodity type, we used percentage changes in rail commodities to reflect proportional changes in freight and truck activities.

We applied ordinary least square (OLS) models to analyze data at the national and selected state levels. To account for the time-lagged effect in this data, we included time-lagged variables for the dependent variable and all the major independent variables (Table 1). We also employed robust standard error in the models as a remedy of heteroskedasticity.

Table 1.Explanatory Variables
Category Variable Lagged Periodicity Notes
COVID-19 Confirmed cases 7 days and 10 days Daily Include cases at both the national and state level (Gu 2020).
Deaths
Deaths per 1000 7 days
Deaths per state area
Rail Freight commodities Chemicals
Coal
Farm products
Forest products
Grain
Minerals
Other commodities
Total intermodal units
7 days Weekly Show percentage change in rail freight traffic (carloads) compared with the same week last year (Association of American Railroads (AAR) 2020).
State COVID Policies States of emergency
Restaurant restriction
Stay-at-home orders
Daily (Adolph et al. 2020)
Days of the week Weekend Holiday Daily

3. FINDINGS

Compared with April 2018, the national daily diesel consumption in April 2020 decreased by about 15% (U.S.Energy Information Administration (EIA) 2020). Our modeling results indicate that national daily confirmed cases and national confirmed cases with a seven-day lag have significant associations with diesel consumption at the national level (Table 2). Many types of rail freight commodities show significant correlations. The lagged variables of three commodities, forest, mineral, and other products, also show significant correlations, indicating their ongoing effects on diesel consumption in the present and the future.

Table 2.Modelling Results at the National Level
Variables Coefficient P-value
COVID-19 cases National Daily confirmed cases -0.008 0.000
National Daily confirmed cases (7 days lagged) 0.004 0.010
Rail freight commodities Chemicals 1996.3 0.000
Farm products 1795.2 0.020
Forest products 1129.6 0.001
Grain 541.5 0.005
Minerals -915.48 0.011
Total intermodal units -3903.3 0.000
Forest products (7 days lagged) -764.76 0.029
Other products (7 days lagged) -669.44 0.003
Minerals (7 days lagged) -2726.6 0.000

*Note: Only variables with P-values smaller than 0.05 are included.

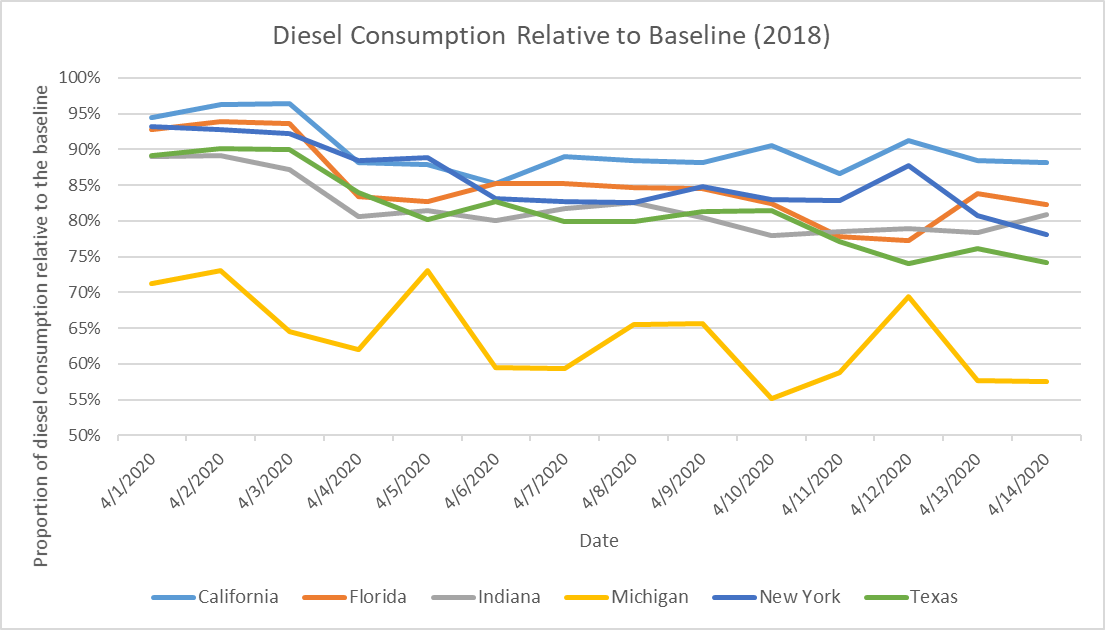
We selected six states with high freight activities for state-level analyses: California, Florida, Indiana, Michigan, New York, and Texas (Pishue 2020) and disaggregated the national-level diesel consumption into state-level consumption.[1] Using the first two weeks in April as examples, Figure 1 shows how much diesel is consumed each day per state relative to the consumption in 2018. We then calculated the weighted average of daily VMT reductions for fleet and long-haul trucks and analyzed their associations with COVID cases, changes in rail freight commodities, and state-level COVID policies in each state[2] (Table 3).

Figure 1
Figure 1.Estimated Diesel Consumption Relative to the Baseline (2018) Consumptions in Six Selected States
Table 3.Modeling Results at the State Level
State Category Variable Coefficient P-Value
California Rail freight commodities Farm Products 0.678 0.021
Grain 0.271 0.027
Florida Rail freight commodities Chemicals 0.565 0.000
Forest products (7 days lagged) -0.289 0.049
Days of the week Weekday -0.011 0.002
Holiday -0.305 0.033
Indiana COVID-19 National Daily confirmed cases 3.71E-06 0.037
Rail freight commodities Farm products 1.263 0.032
Forest products -0.631 0.047
Minerals -1.029 0.008
Michigan COVID-19 National Daily confirmed cases 5.71E-06 0.023
National Daily confirmed cases (7 days lagged) -6.41E-06 0.036
Rail freight commodities Farm products 1.806 0.001
Minerals -1.036 0.021
State policies Restaurant restriction -0.129 0.045
New York Rail freight commodities Chemicals 0.773 0.004
Coal (7 days lagged) -0.518 0.021
Farm products 1.421 0.000
Grain 0.328 0.036
Other products 0.158 0.017
Intermodal units -1.718 0.016
Intermodal units (7 days lagged) 1.309 0.006
State policies Restaurant restriction -0.181 0.014
Days of the week Holiday -0.356 0.042
Texas COVID-19 National daily deaths 2.65E-05 0.005
Texas Daily deaths (10 days lagged) 5.32E-05 0.028
Rail freight commodities Farm products 0.796 0.004
Minerals -0.478 0.047
State policies Stay-at-home order -0.055 0.030
Days of the week Weekday -0.017 0.000
Holiday -0.226 0.005

*Note: Only variables with P-values smaller than 0.05 are included.

Analytical results at the state level show that all six selected states showed some levels of reduction in diesel consumption during the pandemic (Figure 1). Michigan had the largest average daily decrease (64% of the baseline). The other five states had similar but smaller levels of average decreases, consuming about 81% (Texas) to 90% (California) of their baseline consumption. Reductions in diesel consumption of these states were consistent with their reductions in freight truck miles (Pishue 2020).

COVID-19’s impact on diesel consumption at the state level depends on the top freight commodities in that state. For instance, the top two commodities by value in Michigan are transportation equipment and machinery. The need for these commodities correlates with economic activities, which makes them vulnerable to the pandemic that causes slow growth rates (Michigan Department of Transportation (MDOOT) 2017). By contrast, the top two commodities by value in California are electronics and miscellaneous manufacturing products (e.g. jewelry) (California Department of Transportation (Caltrans) 2019). Demand for these products could increase during the pandemic because of the upswing of e-shopping. These different freight structures help explain why Michigan has the largest decrease in freight activities and diesel consumption during the pandemic, whereas California has the smallest decrease.

Regression results imply some level of associations between COVID-19 and diesel consumption. Truck activities in three states (Indiana, Michigan, and Texas) show correlations with the number of COVID-19 cases. Even though each state reacts differently to freight commodities, freight activities related to farm products show overarching associations with truck activities in most states. Different pandemic-related policies also have linkages with fluctuations in truck activities. Although these policies do not directly influence freight activities, stay-at-home orders in Texas and restaurant restrictions in Michigan and New York still have indirect negative associations with truck activities in these states. Finally, many COVID-19 and freight commodity variables also tend to have time lag effects on truck activities.

Freight activities related to farm products, grain, and chemicals shows positive impacts on truck activities and energy usage. Compared with other commodities, demand for farm products, grain, and chemicals are the least affected by the COVID-19 pandemic (Condon et al. 2020). Both farm products and grain are closely related to peoples’ basic needs. Because of the rising need for essential cleaning and sanitation during the pandemic, the demand for chemicals also increased. The necessity of these commodities makes them less affected by the pandemic than other commodities. At the early stage of the pandemic, the panic buying of food and sanitizing products may also have led to increased freight activities related to these commodities. The stable and even growing consumption of related products stabilized or increased freight transport of these commodities. Therefore, more shipping of these commodities tends to result in higher truck VMT, which make diesel consumption less impacted at the national and state levels than gasoline (Ou et al. 2020).


Acknowledgments

The efforts of the authors of Argonne National Laboratory (under Contract DE-AC02-06CH11357) are supported by U.S. Department of Energy and the Aramco Research Center.


  1. Steps for the disaggregation of national diesel consumption can be found at https://xinyiwu.weebly.com/resources.html.

  2. Due to the small sample size, splitting the data into two time periods before and after the peak of the pandemic may lead to unreliable results. We recognize this limitation and recommend splitting the data in future related research when the sample size permits.

Submitted: March 09, 2021 AEST

Accepted: September 08, 2021 AEST

References

Adolph, C., K. Amano, B. Bang-Jensen, N. Fullman, and J. Wilkerson. 2020. “State-Level Social Distancing Policies in Response to the 2019 Novel Coronavirus in the US.” GitHub. 2020. https:/​/​github.com/​COVID19StatePolicy/​SocialDistancing.
Association of American Railroads (AAR). 2020. “Weekly Rail Traffic Data.” 2020. https:/​/​www.aar.org/​aar_news/​weekly-rail-traffic-data/​.
California Department of Transportation (Caltrans). 2019. “California Freight Mobility Plan 2020.” 2019. https:/​/​dot.ca.gov/​-/​media/​dot-media/​programs/​transportation-planning/​documents/​freight-cfmp-2019-draft/​00-cfmpdraftchapter17final.pdf.
Condon, J., S. Gailus, F. Neuhaus, and M. Peña-Alcaraz. 2020. “Global Freight Flows after COVID-19: What’s next? McKinsey & Company.” 2020. https:/​/​www.mckinsey.com/​industries/​travel-logistics-and-infrastructure/​our-insights/​global-freight-flows-after-covid-19-whats-next.
Gu, Y. 2020. “COVID-19 Projections.” GitHub. 2020. https:/​/​github.com/​youyanggu/​covid19_projections/​tree/​master/​projections.
Hu, S., and P. Chen. 2021. “Who Left Riding Transit? Examining Socioeconomic Disparities in the Impact of COVID-19 on Ridership.” Transportation Research Part D: Transport and Environment 90:102654.
Google Scholar
Michigan Department of Transportation (MDOOT). 2017. “Michigan Freight Plan: Supplement to the 2040 MI Transportation Plan.” 2017. https:/​/​www.michigan.gov/​documents/​mdot/​MDOT_DRAFT_StateFreightPlan2017_599148_7.pdf.
Ou, Shiqi, Xin He, Weiqi Ji, Wei Chen, Lang Sui, Yu Gan, Zifeng Lu, et al. 2020. “Machine Learning Model to Project the Impact of COVID-19 on US Motor Gasoline Demand.” Nature Energy 5 (9): 666–73. https:/​/​doi.org/​10.1038/​s41560-020-0662-1.
Google Scholar
Pishue, B. 2020. “COVID-19’s Impact on Freight: An Analysis of Long-Haul Freight Movement During a Pandemic.” INRIX.
U.S.Energy Information Administration (EIA). 2020. “Petroleum & Other Liquids: 4-Week Avg U.S Product Supplied of Distillate Fuel Oil.” 2020. https:/​/​www.eia.gov/​dnav/​pet/​hist/​LeafHandler.ashx?n=PET&s=WDIUPUS2&f=4.

This website uses cookies

We use cookies to enhance your experience and support COUNTER Metrics for transparent reporting of readership statistics. Cookie data is not sold to third parties or used for marketing purposes.

Powered by Scholastica, the modern academic journal management system