1. Questions
Cruising for parking—succinctly defined as excess vehicle travel from parking search (Weinberger, Millard-Ball, and Hampshire 2020)—is often referred to as circling for parking. But circling is just one of the potential search strategies. Here, we investigate the geometric realizations of the search strategies that drivers employ to find parking.
We hypothesize that a range of spatial strategies are used by drivers. With high parking turnover, drivers might find it profitable to circle around on a defined set of blocks. However, some drivers might find this frustrating and prefer to search in virgin territory, perhaps in a spiral shape or through making random turns. Willingness and ability to walk will also affect whether a driver remains close to their destination or searches a more expansive area.
2. Methods
We use a dataset of 107,275 GPS traces of vehicle trips in San Francisco, California and Ann Arbor, Michigan. The San Francisco traces were collected from in-vehicle and hand-held navigation systems, and were purchased from a commercial aggregator. The Ann Arbor traces were collected from volunteer drivers by the University of Michigan Transportation Research Institute. In both cities, we assume that most cruising trips are in search of on-street parking, given the typically higher prices for off-street parking in the US (Manville 2014).
We focus on the final portion of each vehicle trip, from when a driver first enters a 400m buffer around their final parking location. We compute the shortest-path (network) distance and the actual path (map-matched) distance. We define cruising as any trip where the actual distance is more than 200m longer than the shortest-path distance, i.e., where the driver takes a circuitous route. The exception: we exclude trips where more than 50% of travel takes place outside the 400m buffer, as these are likely to be errand and drop-off trips (e.g., the school run). Our data sources, data processing workflow, and analysis are fully described in Hampshire et al. (2016) and Weinberger et al. (2020).
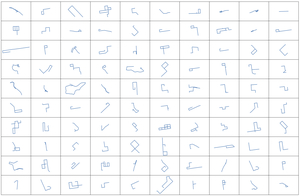
In this study, we analyze the 5,316 trips —570 from Ann Arbor and 4,746 from San Francisco—that we previously identified as cruising. Figure A1 shows a random sample of 100 cruising trips, illustrating the variety of cruising shapes.
We first calculate metrics that characterize the geometric patterns. At each intersection, we use the change in bearing to identify whether a driver turns left, continues straight, turns right, or makes a U-turn. We then calculate the number and fraction of turns of each type. We calculate the area of the convex hull of the driver’s route and its ratio to the cruising path length, in order to measure the compactness of the search area. We also calculate the path length, the number of times that the driver crosses over their path (defined as the number of unique edges minus the number of unique nodes plus one), and the fraction of repeated blocks. Table 1 shows descriptive statistics.
We use k-means cluster analysis (Jain 2010) in the Python scikit-learn library to identify distinct patterns of cruising. We standardize all variables by subtracting the mean and dividing by the standard deviation, and use the elbow method to select the number of clusters (k=5). Our results are qualitatively similar to different choices of k and input variables.
3. Findings
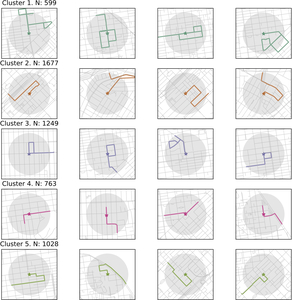
Figure 1 shows the z-scores of each cluster centroid to illustrate how the clusters are differentiated. Figure 2 shows the four most representative examples of each cluster. Cluster 1 is characterized by longer parking search distances and more times that the driver crosses over their path. Cluster 2 is characterized by fewer turns, with the driver often choosing to continue straight at an intersection, and a less compact search area as indicated by the ratio of the convex hull to the path length. Clusters 3 and 5 involve higher proportions of right and left turns respectively, while Cluster 4 is typified by U-turns.
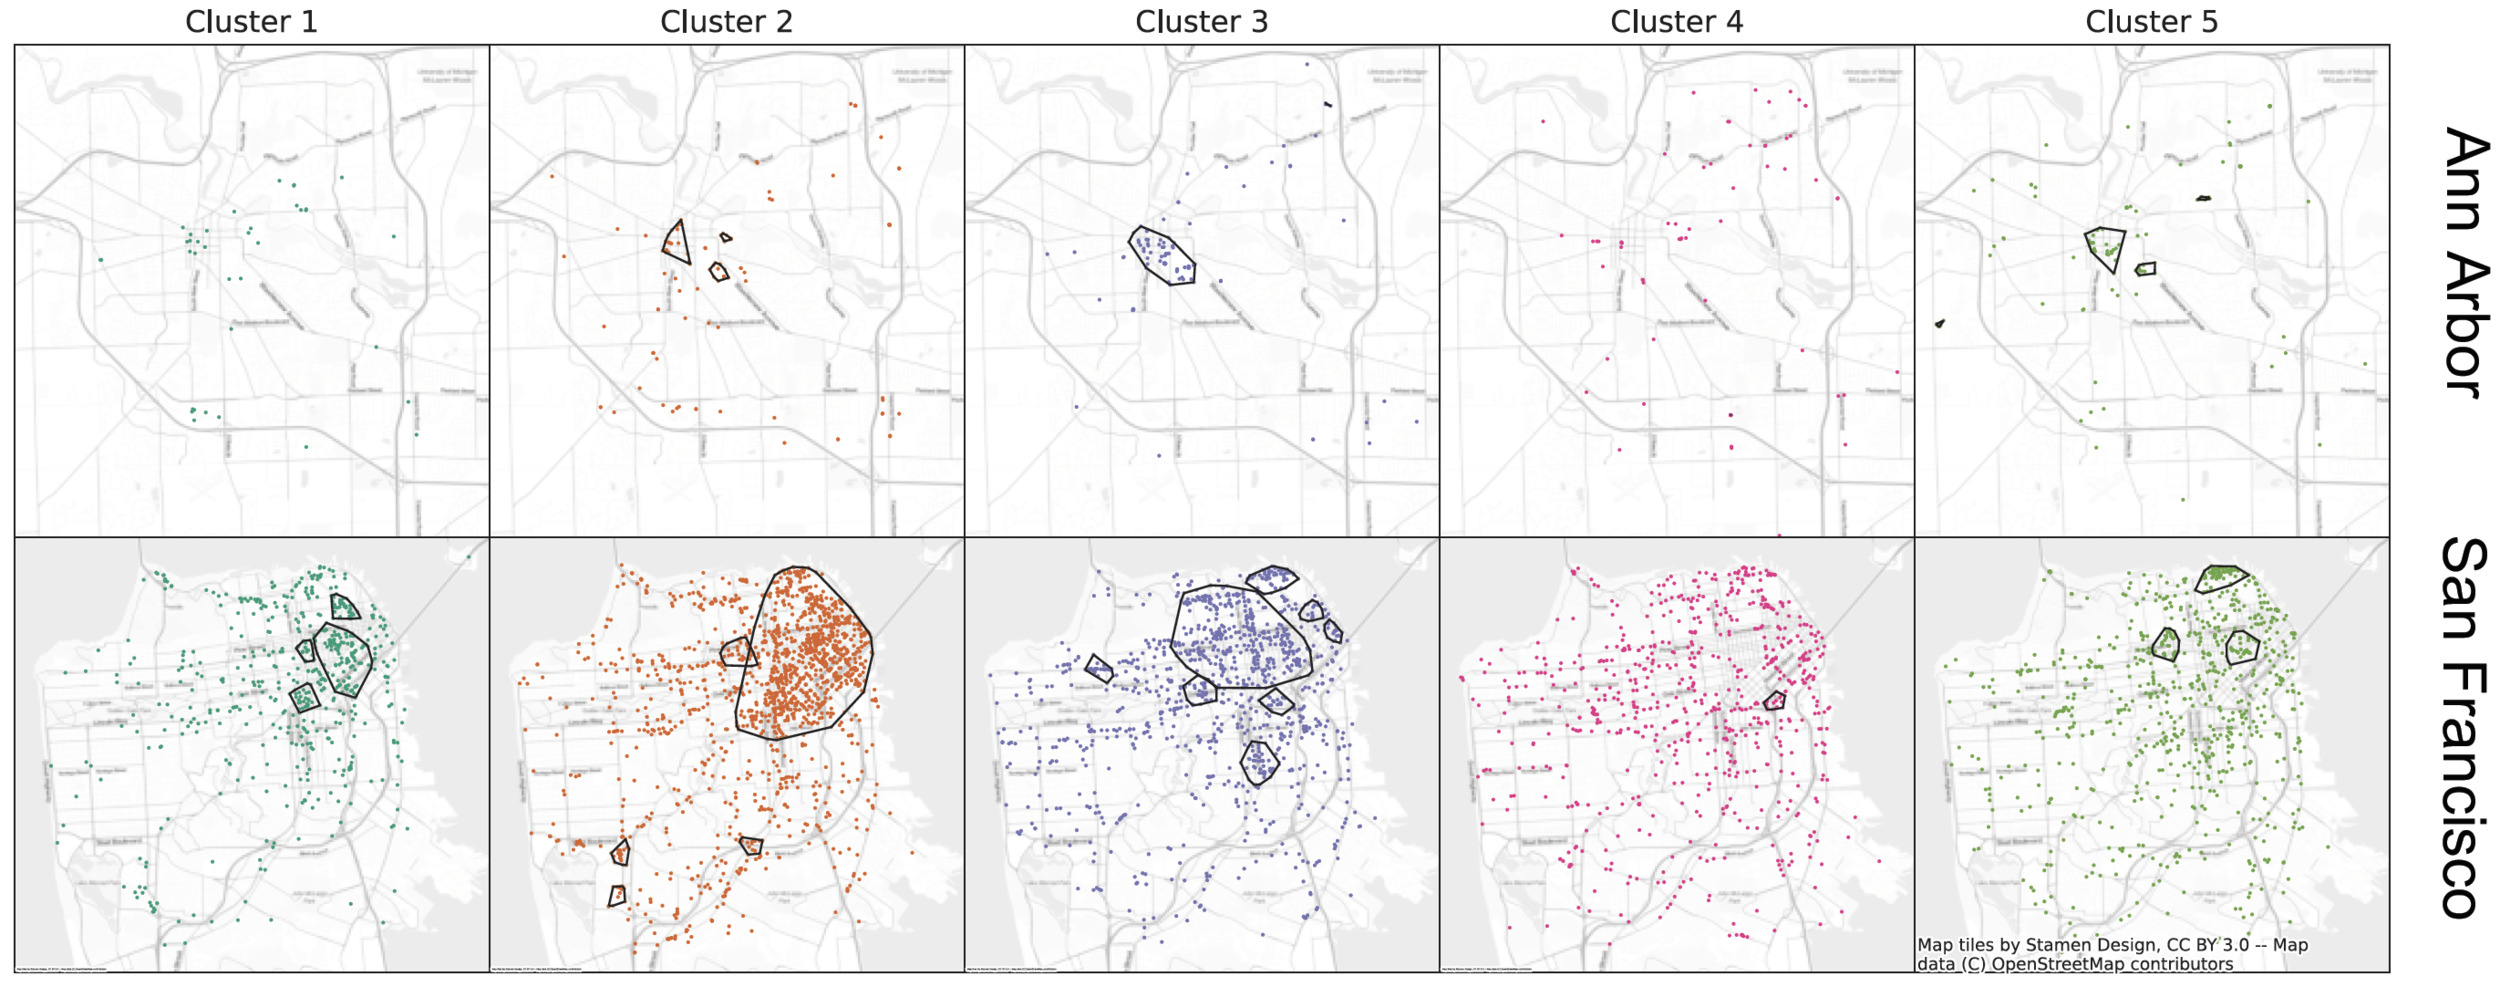
We then explore the geographic distribution of the clusters. Table 2 shows that Cluster 5 (left turns) is more prevalent in Ann Arbor, while Cluster 2 (larger convex hull and fewer turns) is the most common in San Francisco. We do not have a theory that explains these geographic differences, but variations in cruising patterns across multiple cities would be interesting to explore in future work.
Figure 3 plots the end point of each cruising trip. In both cities, most clusters are concentrated in the denser neighborhoods close to downtown where destinations are concentrated and parking availability is likely to be most scarce. The most striking finding from Figure 3 is that Cluster 4 (U-turns) is more evenly distributed throughout each city, the implications of which are discussed below.
Circling for parking is often used as a synonym for cruising for parking. We demonstrate here that most cruising trips do not involve circling. Partly because most drivers find a space relatively quickly, a more typical cruising pattern involves just a few turns. While drivers often perceive that cruising times are long or that parking is hard to find (e.g. Lee, Agdas, and Baker 2017), most cruising trips appear to be less dramatic; repeated circling is the exception rather than the norm.
Our results also call into question the usefulness of a “repeated blocks” measure of cruising, through which analysts identify cars which pass a given point more than once in a defined period of time (Barlow et al. 2018). Repeated blocks are most typical of cruising trips that also involve U-turns (Cluster 4). In some cases, drivers might make a U-turn to take an open parking space on the other side of the street. However, given the more even distribution of these trips throughout the city—they are not just found in high-traffic areas with limited parking availability—such “cruising” trips are unlikely to be related to parking search at all. In these cases, the excess travel that we classify as “cruising” is more likely due to a driver missing a turn or needing to access a driveway from a particular direction of travel.
Acknowledgements
We thank Allen Greenberg of USDOT for supporting earlier work that provides a foundation for the results presented here, and for comments on the draft. All errors and omissions are our own.


