Loading [Contrib]/a11y/accessibility-menu.js
Skip to main content
null
Findings
  • Menu
  • Articles
    • Energy Findings
    • Resilience Findings
    • Safety Findings
    • Transport Findings
    • Urban Findings
    • All
  • For Authors
  • Editorial Board
  • About
  • Blog
  • covid-19
  • search

RSS Feed

Enter the URL below into your favorite RSS reader.

https://findingspress.org/feed
Transport Findings
August 20, 2021 AEST

Determining Optimum Design Density for 20-minute Neighbourhoods

Farjana Shatu, Md. Kamruzzaman,
accessibility20-minute neighbourhoodoptimum population densitycommunity infrastructure
Copyright Logoccby-sa-4.0 • https://doi.org/10.32866/001c.27391
Photo by Weyne Yew on Unsplash
Findings
Shatu, Farjana, and Md. Kamruzzaman. 2021. “Determining Optimum Design Density for 20-Minute Neighbourhoods.” Findings, August. https:/​/​doi.org/​10.32866/​001c.27391.
Save article as...▾
Download all (2)
  • Figure 1. The relationship between population density and types of opportunities
    Download
  • Figure 2. Types of destinations is expected at different distance and density thresholds
    Download

Sorry, something went wrong. Please try again.

If this problem reoccurs, please contact Scholastica Support

Error message:

undefined

View more stats

Abstract

The 20-minute neighbourhood faces a unique challenge: more people are needed to support adequate opportunities to promote living locally whereas more opportunities mean less land for residential use to accommodate more people. This study maps 20-minute neighbourhoods for Melbourne’s statistical areas (SA1) and estimates optimum population density for a 20-minute neighbourhood. The results show that, on an average distance to CBD, 19 different types of opportunities and services can be supported at 36 dwellings/ha (optimum). The study reports a range of planning standards at different combinations of density and distance factors.

1. Questions

20-minute neighbourhood is a recent planning concept aims to support ‘living locally’ — giving people the ability to meet most of their daily needs within a 20-minute (800m) round-trip walk from home, with safe cycling and local transport options (Victoria State Government 2017; The Portland Plan 2012). The concept (or its variants like 15-minutes or 30-minutes) has received wider policy attention recently due to the COVID-19 travel restrictions, and consequent reliance on local opportunities to meet daily needs (Local Government Information Unit 2021; Moreno et al. 2021; Wu et al. 2021). The key criteria for a 20-minute neighbourhood to be successful to support local living are, therefore, the provision of basic opportunities and services locally, and access to quality public transport that connects people to jobs and higher-order services. However, the provision of opportunities required to meet the minimum population threshold to be viable varies between the types of opportunities to be provided. For example, the respective population requirements for a secondary school and a library are 10,000-30,000 and 30,000-60,000 in Australia (Australian Social & Recreation Research Pty Ltd 2009).

Clearly, the more people a 20-minute neighbourhood can accommodate, the greater the variety of opportunities it can support. However, increasing population means more spaces needed to provide some opportunities and services. For example, the standard for the provision of open green spaces is 5m2 per person (Pissourios 2014; Umar 2021). This essentially means that the fixed land area of a 20-minute neighbourhood (considering an 800m radius) needs to be negotiated among competing lands uses. Therefore, the 20-minute neighbourhood concept faces a unique challenge: more people are needed to support adequate opportunities whereas more opportunities mean less land for residential use to accommodate more people. This challenge raises the central question for this research: What is the optimum population density for a 20-minute neighbourhood? However, it is understood that there is no one-size-fits-all standard for density levels (Forsyth, Salomon, and Smead 2017; Haider 2019), and like the ‘optimal city size’ debate in the literature (Alonso 1971; Capello and Camagni 2000), it can be hypothesized that the optimal density depends on the spatial organisation of the neighbourhood within an urban system – i.e. there are determinants of urban location advantages other than population size. This raises the second research question of the study: does the location of the neighbourhood moderate the relationship between density and destination?

2. Methods

The study explores the answer of the research question using Greater Melbourne as a case, which aims to be a ‘City of 20-Minute Neighbourhoods’ by 2050. Statistical Area level 1 (SA1) was used as the basic unit of analysis (10,288 in total with an average size of 97 hectares). An 800m network buffer was drawn from the centroids of each SA1 to make the unit of analysis comparable with the size of a 20-minute neighbourhood. Total residential population within the buffer was calculated by summing population of meshblocks (the smallest census unit) that were proportionately contained within the buffer. Population density within the buffer was calculated by excluding SA1s with a population of 10 persons or fewer due primarily to their non-residential nature (Higgs et al. 2019), which resulted in 9,856 SA1s as the analytical sample. 20 different types of lower-order community infrastructure were selected as the opportunities and services to support local living from Grodach, Kamruzzaman, and Harper (2019). These were mapped and their types were counted within each buffer (Table 1).

Table 1.Number of SA1 with access to different community infrastructures
List Community infrastructure type Sources of data Name of sourced data Number of SA1 having access %
1 Neighbourhood parks DATA VIC Parks and Conservation Reserves 9,144 92.78
2 Local shops Open Street Map Amenity Points 4,816 48.86
3 Local sports facility DATA VIC Vicmap Features of Interest 3,667 37.21
4 Community centre AURIN PSMA 1,232 12.50
5 Childcare centre DATA VIC Vicmap Features of Interest 7,022 71.25
6 Government primary schools DATA VIC 2015 All Schools Listing 2,971 30.14
7 Kindergarten AURIN PSMA 4,806 48.76
8 Medical & allied health services AURIN PSMA 2,557 25.94
9 Post office AURIN PSMA 1,226 12.44
10 Church AURIN PSMA 3,536 35.88
11 Maternal & child health centre DATA VIC Vicmap Features of Interest 561 5.69
12 Catholic primary school DATA VIC 2015 All Schools Listing 1,395 14.15
13 Tennis courts DATA VIC Vicmap Features of Interest 2,092 21.23
14 District/metropolitan park DATA VIC Parks and Conservation Reserves 152 1.54
15 Community health centre DATA VIC Vicmap Features of Interest 107 1.54
16 Government secondary schools DATA VIC 2015 All Schools Listing - Feb 880 8.93
17 Aged care DATA VIC Vicmap Features of Interest 2,221 22.53
18 Bus stop DATA VIC PT. a collection of PTV datasets 9,029 91.61
19 Tram stop DATA VIC PT. a collection of PTV datasets 1,838 18.65
20 Train station DATA VIC PT. a collection of PTV datasets 1,617 16.41

Due to the count nature of the outcome variable, Poison regression models were estimated to identify the effects of population density on the type of opportunities supported within the buffer. A quadratic term of population density was included to test and identify optimum population density (Roback and Legler 2021; Su, Wei, and Zhao 2017). Distance to the Melbourne CBD from each SA1 was included in the model to take into account the effects of spatial organisation (locational advantage) (Hong 2017). An interaction term between density and distance was added in the model to identify the moderating effects of locational advantage on density. In addition, a number of other explanatory factors were also tested including accessibility to jobs, betweenness centrality of SA1, and distance to major activity centre. Although these factors were statistically significant (including the interaction term), they did not improve the explanatory power of the model, and therefore, were not retained in the final model.

3. Findings

Table 2 presents the outcomes of six different Poisson regression models estimated with various combination of explanatory factors. Model 1 confirms that population density has a positive association with the types of opportunities available within the buffer. The effect of quadratic term of density in Model 2 shows an expected negative sign meaning that the positive association is expected up to a certain level and beyond which the effect declines, which also suggests the existence of a density that supports the maximum types of opportunities. Model 3 outlines that there exists an inverse relationship between distance to CBD and the availability of destination types. Models 4, 5, and 6 indicate that the addition of quadratic term for distance and/or the interaction term does not improve the explanatory power of the models and are not considered further to keep the model relatively simple. As a result, Model 3 is considered as the operational model for this study, which explains about 11.3% variations in the outcome variable.

Table 2.Poisson regression analysis results showing the effects of density on destinations
Explanatory factors Model 1 Model 2 Model 3 Model 4 Model 5 Model 6
Density (person/ha) 0.01103* 0.03128* 0.01804* 0.01675* 0.01366* 0.02139*
Squared density (quadratic term) -0.00017* -0.00010* -0.00010* -0.00009* -0.00012*
Distance to CBD (km) -0.01540* -0.02871* -0.03556* -0.01173*
Squared distance to CBD (quadratic term) 0.00025* 0.00032*
Interaction: Density X Distance 0.00014* -0.00017*
Constant 1.49041* 1.08217* 1.70449* 1.87123* 1.97432* 1.63650*
R2 0.058 0.088 0.113 0.115 0.116 0.113
Log likelihood -24561.63 -23770.67 -23135.78 -23067.70 -23061.87 -23118.78
LR Chi2 3025.93* 4607.86* 5877.62* 6013.78* 6025.44* 5911.63*
N 9,856 9,856 9,856 9,856 9,856 9,856

* significant at the 0.05 level

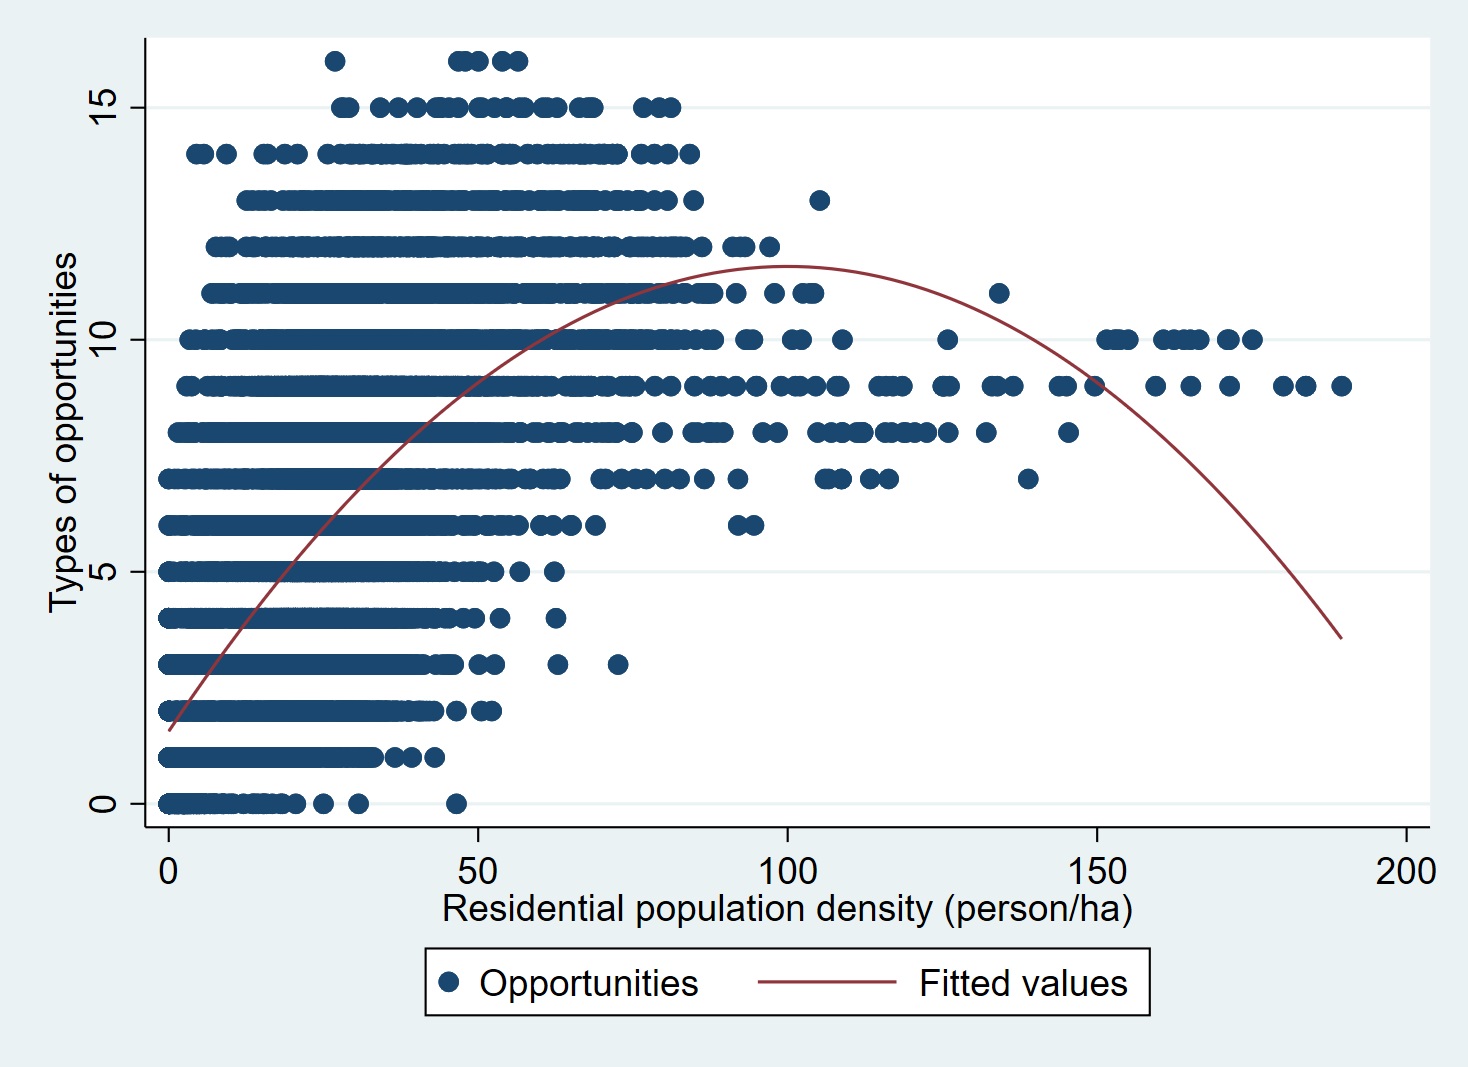
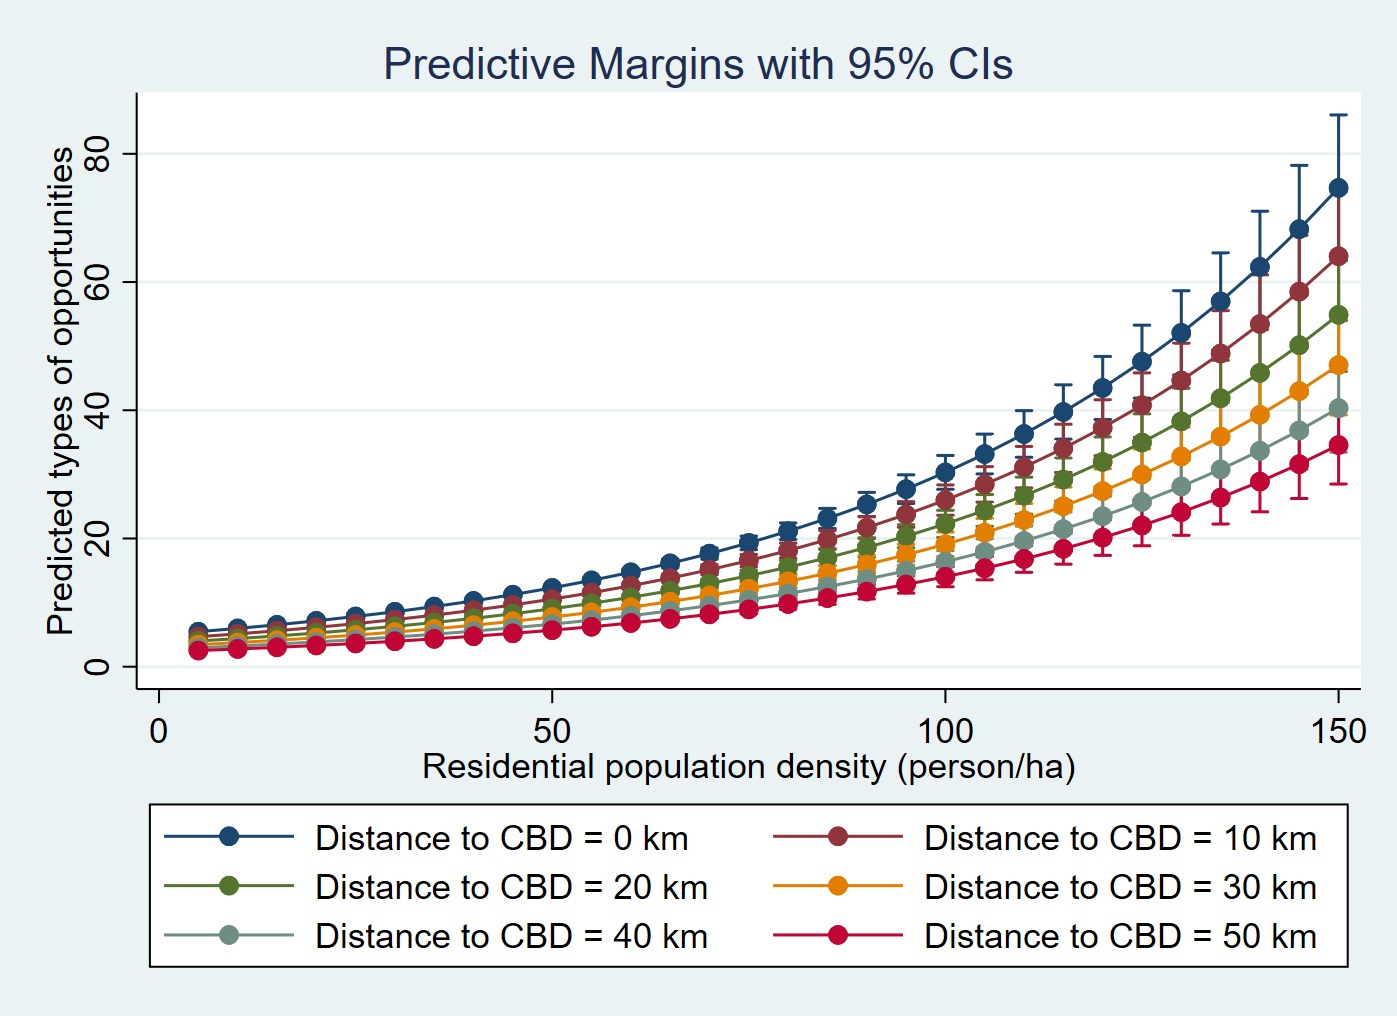
The low explanatory power of the model is expected due to the distribution of opportunities across different density settings (Figure 1). Based on the estimated model, the value for density (92 person/ha ≈ 36 dwellings/ha), at which the maximum number of opportunities exists, was obtained by taking the first derivative (partial) of the regression equation from Model 3. On average, each 20-minute neighbourhood have access to 6.18 opportunity types. However, at the `optimum’ density level, each 20-minute neighbourhood is expected to support 18.9 opportunity types (at the average distance to CBD of 21.6km). Figure 2 shows the expected types of destinations to be supported in different 20-minute neighbourhoods based on their distance and density factors. Clearly, at zero population density, nearly zero types of opportunities are expected to be supported irrespective of the location of the 20-minute neighbourhoods. However, Figure 2 shows that, at 100 persons/ha, the types of opportunities to be supported would be about 30, 26, 22, 19, 16, and 14 if a 20-minute neighbourhood were respectively located 0km, 10km, 20km, 30km, 40km, and 50km away from the CBD.

Figure 1
Figure 1.The relationship between population density and types of opportunities
Figure 2
Figure 2.Types of destinations is expected at different distance and density thresholds

Acknowledgements

We thank the two anonymous reviewers for their insightful comments and suggestions.

Submitted: July 23, 2021 AEST

Accepted: August 13, 2021 AEST

References

Alonso, William. 1971. “The Economics of Urban Size.” Papers of the Regional Science Association 26 (1): 66–83.
Google Scholar
Australian Social & Recreation Research Pty Ltd. 2009. “Guide to Social Infrastructure Planning.” Melbourne: Growth Areas Authority, Department of Planning and Community Development, Wyndham City Council.
Capello, Roberta, and Roberto Camagni. 2000. “Beyond Optimal City Size: An Evaluation of Alternative Urban Growth Patterns.” Urban Studies (Edinburgh, Scotland) 37 (9): 1479–96. https:/​/​doi.org/​10.1080/​00420980020080221.
Google Scholar
Forsyth, A., E. Salomon, and L. Smead. 2017. “Creating Healthy Neighborhoods: Evidence-Based Planning and Design Strategies.” American Planning Association.
Grodach, Carl, Md Kamruzzaman, and Laura Harper. 2019. “20-Minute Neighbourhood - Living Locally Research.” Victorian State Government. https:/​/​www.planning.vic.gov.au/​__data/​assets/​pdf_file/​0023/​450275/​Mambourin-Report-Staging-Community-Infrastructure.pdf.
Haider, Murtaza. 2019. “Diminishing Returns to Density and Public Transit.” Findings. https:/​/​doi.org/​10.32866/​10679.
Google Scholar
Higgs, Carl, Hannah Badland, Koen Simons, Luke D. Knibbs, and Billie Giles-Corti. 2019. “The Urban Liveability Index: Developing a Policy-Relevant Urban Liveability Composite Measure and Evaluating Associations with Transport Mode Choice.” International Journal of Health Geographics 18 (1): 14. https:/​/​doi.org/​10.1186/​s12942-019-0178-8.
Google Scholar
Hong, Jinhyun. 2017. “Non-Linear Influences of the Built Environment on Transportation Emissions Focusing on Densities.” Journal of Transport and Land Use 10 (1): 229–40.
Google Scholar
Local Government Information Unit. 2021. “Perspectives on the 20-Minute Neighbourhood - Progress around the World.” https:/​/​lgiu.org/​perspectives-on-the-20-minute-neighbourhood-progress-around-the-world/​.
Moreno, Carlos, Zaheer Allam, Didier Chabaud, Catherine Gall, and Florent Pratlong. 2021. “Introducing the ‘15-Minute City’: Sustainability, Resilience and Place Identity in Future Post-Pandemic Cities.” Smart Cities 4 (1): 93–111.
Google Scholar
Pissourios, Ioannis. 2014. “Top-down and Bottom-up Urban and Regional Planning: Towards a Framework for the Use of Planning Standards.” European Spatial Research and Policy 21 (1): 83–99.
Google Scholar
Roback, Paul, and Julie Legler. 2021. Beyond Multiple Linear Regression: AppliedGeneralized Linear Models and Multilevel Models in R. CRC Press. https:/​/​bookdown.org/​roback/​bookdown-BeyondMLR/​.
Google Scholar
Su, H., H. Wei, and J. Zhao. 2017. “Density Effect and Optimum Density of the Urban Population in China.” Urban Studies 54 (7): 1760–77. https:/​/​doi.org/​10.1177/​0042098015624839.
Google Scholar
The Portland Plan. 2012. http:/​/​pdxplan.com/​.
Umar, Jimoh Usman. 2021. “Physical Planning Standard of Health Care Facilities in the Rural Communities of Ondo State, Nigeria.” Development in Practice, 1–9. https:/​/​doi.org/​10.1080/​09614524.2020.1860193.
Google Scholar
Victoria State Government. 2017. “Plan Melbourne 2017-2050: Metropolitan Planning Strategy.” Melbourne: Department of Environment, Land, Water and Planning.
Wu, Hao, Paolo Avner, Genevieve Boisjoly, Carlos K. V. Braga, Ahmed El-Geneidy, Jie Huang, Tamara Kerzhner, et al. 2021. “Urban Access across the Globe: An International Comparison of Different Transport Modes.” Npj Urban Sustainability 1 (1): 16. https:/​/​doi.org/​10.1038/​s42949-021-00020-2.
Google Scholar

This website uses cookies

We use cookies to enhance your experience and support COUNTER Metrics for transparent reporting of readership statistics. Cookie data is not sold to third parties or used for marketing purposes.

Powered by Scholastica, the modern academic journal management system