
1. Questions
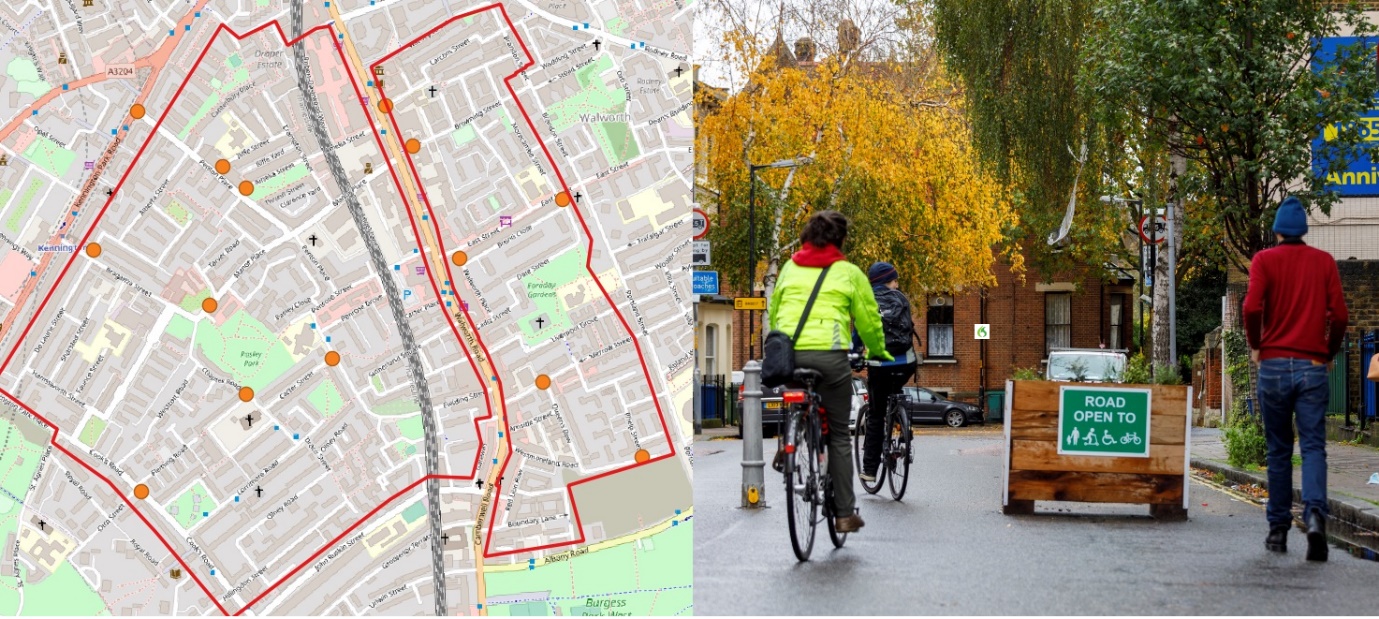
Low Traffic Neighbourhoods (LTNs) aim to reduce volumes of through motor traffic on residential streets with measures including planters, traffic cameras, and lockable bollards. They create areas where all homes can be reached by car but where it is difficult or impossible for drivers to cut through from one side of the area to the other. The aim is to discourage driving and simultaneously to create safer and more pleasant walking and cycling environments. An example of an LTN is provided in Figure 1.
During 2020, LTNs were implemented at pace across London boroughs under Covid-19 emergency legislation, with 4% of the Greater London population living in areas covered by schemes introduced from March to September (Aldred et al., n.d.).[1]
Evidence points to LTNs changing travel patterns, with increases in active travel (walking and/or cycling) and a shift away from cars (Aldred and Goodman 2021). Such changes in travel behaviour may affect the overall number of road traffic injuries and the risk per trip, potentially with differences by travel modes. We have previously examined the impact on injuries of longer-standing LTNs introduced between 2015-2019 as part of the mini-Holland programme in Waltham Forest, Outer London (Laverty, Aldred, and Goodman 2021). This research indicated that inside the LTN areas there was approximately a 70% reduction in absolute injury numbers and also approximately a 70% reduction in risk per trip for walking, cycling and car travel alike. There was no evidence of a change in injuries on LTN boundary roads. It remains unclear, however, whether these findings transfer to the 2020 LTNs, which were implemented more rapidly and with fewer complementary measures, and cover a diverse range of London neighbourhoods.
In this paper we therefore use police injury data to investigate the impacts of the 2020 LTNs on road traffic injuries in London.
.jpeg)
2. Methods
We used police injury data, which gives information on the travel mode and injury severity of road traffic injuries, plus detailed geographical coordinates for the crash location. [2] Our primary outcome was number of injuries of any severity, both in total and by mode of travel. We present secondary analyses examining killed or seriously injured (KSI).
We used information from a range of official sources to map all new modal filters implemented from March-September 2020 in London and still in place at the end of October 2020.[3] Based on these we manually mapped 72 LTNs and surrounding boundary roads (details in Aldred et al., n.d.: see Figures 1 and 2). We aggregated the point locations of all injuries into three mutually-exclusive groups:
-
Injuries inside the LTN, defined as injuries at least 25m inside the LTN boundary.
-
Injuries on LTN boundary roads, defined being located less than 25m from an LTN boundary road.
-
All other injuries elsewhere in London (our comparison group).
We made pre/post comparisons of injury numbers in these LTN groups between October-December 2018 and October-December 2019 (‘pre’) versus October-December 2020 (‘post’). Using Fisher’s exact chi-squared tests we compared trends inside LTNs (group 1) and on boundary roads (group 2) to trends in injuries elsewhere in London (group 3).
_created_in_london_march-september_2020.png)
Following this assessment of changes in absolute injury numbers, we assessed likely changes in injury risk. For this we drew on previous research and monitoring and evaluation reports to estimate changes in levels of walking, cycling, and driving following the implementation of the LTNs (see Supplemental Information 1). We further tested the robustness of our findings through various sensitivity analyses (see Supplemental Information 2).
3. Findings
Inside LTNs, total injury numbers approximately halved after LTN implementation (ratio of 0.51 relative to the rest of London, p<0.001, Table 1). Considering travel modes separately, statistically significant reductions were found for pedestrians (ratio 0.15, p<0.001) and car occupants (ratio 0.37, p=0.02) but not for cyclists (ratio 0.88, p=0.77). By contrast, there was no association between 2020 LTN status and change in injury numbers between 2018 and 2019 (see Supplemental Table S2.1). This lack of any pre-existing favourable trend in the LTN areas strengthens the case for believing that the large injury decrease observed in 2020 was caused by the LTNs, rather than other external factors.
The above analyses do not consider changes in travel patterns, and therefore do not estimate risk to an individual, e.g. risk per trip. While evidence on change in travel patterns in LTNs during these months is limited, it points to more walking and cycling, and less car use, compared to background trends.
Specifically, inside LTNs, survey evidence points to increased duration of walking (+17%) among residents living in 2020 LTNs in Outer London (see Aldred and Goodman 2021, and Supplemental Information 1A). Available monitoring reports from London districts did not assess changes in walking but did record a median change of +69% (N=5 schemes, range +14 to +91%) in cycling inside LTNs in September-December 2020. Background changes were +38% for London in 2020 as a whole and +14% on automatic counters located largely in Central London in September-December 2020 (Supplemental Information 1B). Conversely, these monitoring reports record a median change of -42% (N=14 schemes, range -75% to -20%) in motor vehicle travel inside LTNs in September-December 2020, versus a background change of -13% on London’s largest major roads in those months.[4] It is therefore likely that the effects shown in Table 1 somewhat underestimate improvements in risk per trip for walking and cycling inside an LTN but overestimate improvement for driving, which may show a more modest decrease in risk per trip.
Analyses of injuries on LTN boundary roads identified no changes in absolute injury numbers (e.g. ratio 1.05, p=0.35 for injuries among all travel modes compared with the rest of London). Risk per trip is likely also to have changed little, given that monitoring reports indicate that changes on boundary roads in cycling and motor vehicle traffic were relatively similar to the background trend.[5]
Although small numbers meant limited statistical power, the pattern of findings was similar for Killed and Seriously Injured (KSI), with numbers approximately halving inside LTNs compared to the rest of London but no changes on LTN boundary roads (Supplemental Table S2.2). Our findings were also similar in analyses stratified by A/B vs. local roads and by Inner vs. Outer London, although again some sample sizes were very small (Supplemental Table S2.3). Findings were similar in sensitivity analyses restricted to local authorities that introduced at least one LTN (Supplemental Table S2.4).
In conclusion, LTNs implemented in London in 2020 were associated with a substantial decline in road traffic injuries inside LTN areas during their initial months of implementation, with no changes on boundary roads. The magnitude of the effect compares favourably to other effective road safety interventions e.g. the 23% decline following the implementation of 20 mph speed limits across London in 2000-06 (Grundy et al. 2009). Pedestrians saw a particularly steep decline both in absolute and relative injury risk. This differs from our previous finding that pedestrians, cyclists, and car occupant risk declined to a similar extent in Waltham Forest (Laverty, Aldred, and Goodman 2021). Future follow-up assessment of injury impacts is warranted, once schemes have had more time to ‘bed in’, and once the impacts of the Covid-19 pandemic on travel behaviours subside.
ACKNOWLEDGEMENTS
AL is funded by National Institute of Health Research (NIHR) School for Public Health Research.
Transport for London (TfL) provided access to confirmed 2020 collision data via Collstats in advance of national publication of 2020 road injury data, and data on motor traffic and cycling flows. They had no influence over the content of this paper.
CONFLICT OF INTEREST STATEMENT
Some of these LTNs were funded by the Department for Transport (DfT) via the Active Travel Fund. AG, RA and JF have been awarded DfT funding to evaluate the Active Travel Fund programme as a whole, although this study does not form part of that work. DfT had no input into this article.
Some of these 2020 LTNs had been in the design and consultation phase prior to the Covid-19 pandemic, but many were designed from scratch. This was in response to emergency active travel funding and guidance released by the central UK government, which encouraged local authorities to reallocate road space to walking and cycling through measures such as low traffic neighbourhoods. These measures were implemented under May 2020 emergency legislation that introduced an emergency procedure for making temporary traffic orders.
Available from https://data.gov.uk/dataset/cb7ae6f0-4be6-4935-9277-47e5ce24a11f/road-safety-data for 2018 and 2019, and accessed via the ‘Collstats’ platform for 2020, provided by Transport for London.
One LTN in Lewisham was modified in November 2020 to allow some through traffic on some roads in November 2020. In addition, some central London ‘dining streets’ were only operational for some of the period October-December 2020. Our findings were similar in sensitivity analyses excluding these LTNs. Only around 15-20 new LTNs were introduced in London October-December 2020.
This estimate relates to the Transport for London Road Network (TLRN), London’s Strategic Road network, which accounts for 5% of roads but carries a third of traffic. As outlined in Supplemental Information 1B, it is plausible that traffic may have decreased somewhat less on minor and smaller major roads, i.e. the types of roads that make up the majority of roads inside LTNs and on LTN boundaries.
Specifically, available monitoring reports suggest that cycling levels on LTN boundary roads may have increased somewhat more than the background trend (median +43%, against a plausible range of +14% to +38% in London as a whole), and motor vehicle traffic decreased somewhat less (median -6%, against -13% for London’s largest major roads, although this may overestimate the decrease on smaller roads: see Supplemental Information 1B). These differences are not large enough meaningfully to affect risk estimates in the present analysis.