

1. Questions
Carpooling in the US steadily declined after the oil crisis of the 1970’s (Ferguson 1997), but new technology is hoped to reverse the trend. Services such as Waze Carpool, Carzac, BlaBlaCar and (until recently) Scoop use mobile apps to provide “ridesharing” in a strict sense: “formal or informal shared rides between drivers and passengers with similar origin-destination pairings” (Shaheen and Cohen 2019). Perhaps these apps’ primary job is matching: they join a driver and passengers into a carpool within parameters (schedule, travel time, cost, etc.) sufficiently agreeable that all voluntarily participate. Economists have already developed analytical models of matching and applied them to topics such as agglomerations (Zenou 2009), street-hail taxi service (Fréchette, Lizzeri, and Salz 2019) and the labor market (Diamond 1982). A chief concern in this literature is the role of returns to scale in matching. For example, if an activity has increasing returns to scale in matching, then when more people participate, the quality of matches rises. This can lead to positive feedback, as rising usage improves the customer experience and thus invites higher usage. Intuitively, carpool matching should exhibit such returns to scale: the more people choose to carpool, the more likely that one of my neighbors will have a destination and schedule similar to mine, and the more likely I am to carpool in the future. This possibility has received attention in theoretical studies—e.g., by Lehe and Pandey (2020) and de Palma, Stokkink, and Geroliminis (2020)—but no empirical study has testified to its existence. Hence, this paper asks: Does a real-world dataset provide evidence that the quality of matches rises with the usage of a carpool service?
2. Methods
Our data were provided by Scoop Technologies. Prior to 2021,[1] the firm operated a mobile app for carpooling. The day before traveling, a user would place a trip request specifying their preferred origin, destination, role (passengers or driver), and schedule. Every evening, Scoop used these trip requests to propose matches, and users could accept or reject matches without cost. Passengers paid a small fee to use the service, which would compensate Scoop and also reimburse drivers for gas, tolls, etc. Local governments or employers subsidized many trips. A key motive for many drivers to participate was to use carpool lanes, as well as to network with other employees of a large firm.
The dataset includes average weekly metrics from the first 15-16 weeks of Scoop starting service in seven “markets”. A market might be a city or an employer with a large campus, and all represent distinct spatial regions. To preserve anonymity and trade secrets, Scoop has excluded any information about the seven markets and dates (beyond the fact all seven are in the Bay Area or Seattle, and all data is from before 2020), so they are named as letters A-G. Holiday weeks such as American Thanksgiving are flagged, so we have excluded them from analysis. These exclusions result in 103 observations, each representing data from one week in one market.
We study three metrics:
-
Trip requests: The number of users who requested a trip.
-
Match rate: The fraction of trip requests resulting in a positive match.
-
Detour distance: The difference between the distance a driver travels on their carpool and the distance they would traverse if they drove directly to the destination.
As part of the privacy measures, all metrics are normalized to the highest value observed in a given market. For example, if the actual match rate is 40% in some market for some week, and the highest match rate ever observed for the market is 80%, then the match_rate variable we have is 0.5 (40%/80%) for that week. This normalization makes it impossible to compare absolute scale across markets.
Our hypothesis is that the quality of matches improves with the scale of participation. In the context of the dataset, we interpret this to mean that the match rate should rise with the number of trip requests in a market, and the detour distance should decline. We investigate whether this is so by performing regressions on the dataset. While the indexing and scrubbing limits how much can be gleaned from the data, the results of the regressions can at least be suggestive of matching economies, albeit not definitive evidence.
3. Findings
In what follows, trip_requests, match_rate and detour_distance refer to the normalized trip requests, match rate and detour distance, respectively. We distinguish the two in order to maintain clarity about what the coefficients in the regressions mean.
First we look at the effect of trip_requests on match_rate. Fig. 1 shows a plot of the data with a regression line through each market. Clearly, every market’s match_rate rises with trip_requests.
.jpeg)
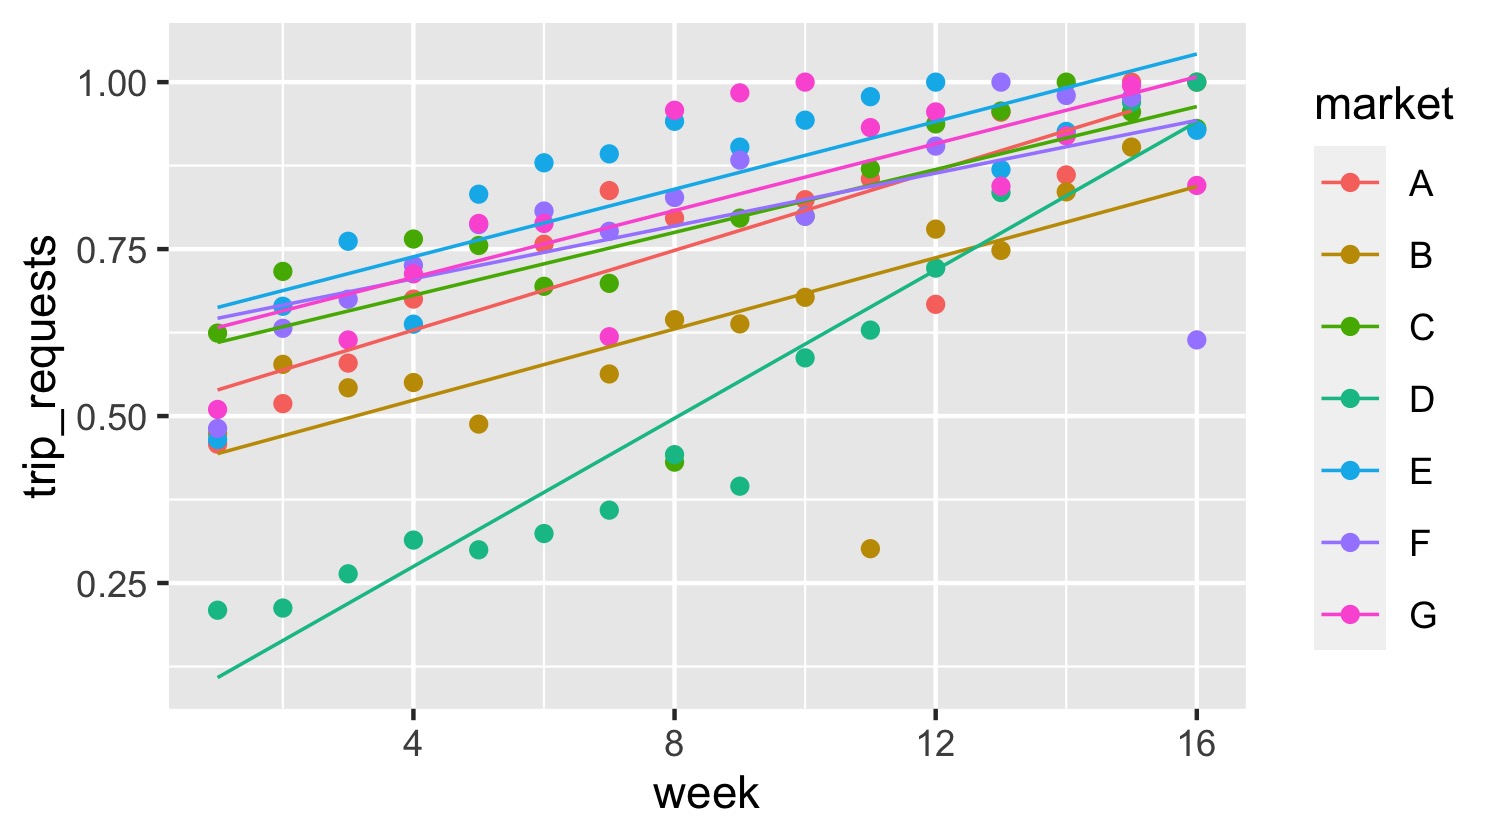
Table 1 shows the results of four regression models for match rate. Model (1) is an OLS regression of match_rate on trip_requests. Model (2) is a two-stage least-squares model with instrumented variables (IV) undertaken to account for obvious endogeneity: if people expect to receive a match good enough to accept, they are more likely to request a trip. Hence, Model (2) uses week of operation (that is, how many weeks since Scoop launched in the market) as an instrument for trip_requests. As Fig. 2 shows, trip_requests rises over time in every market. The coefficient of week in a regression of trip_requests on week is .030 (significant at the 99% level). This suggests that in each market, trip_requests increases by 3% (not compounded) of the maximum value observed per week. Models (3) and (4) are ‘fixed effects’ versions of (1) and (2), respectively, which give each market its own intercept relative to market A (not printed), so that Constant in Table 1 is the intercept for market A. All four models have coefficients on trip_requests that are positive, significant and similarly sized. The ivreg R package (Fox, Kleiber, and Zeileis 2021) used to perform the instrumental variable regressions also runs two tests: one for weak instruments and a Wu-Hausman test for endogeneity. For both IV models, the statistics have negligible p-values, suggesting (i) week is not a weak instrument for trip_requests; and, (ii) trip_requests and match_rate are indeed endogenous, as suspected.
_vs_(excluding_holiday_weeks).jpeg)
The same exercise was performed with detour_distance (the normalized detour distance) as the dependent. Fig. 3 shows detour_distance generally declines with trip_requests. The resulting estimates appear in Table 2. The R2 of this model is lower, but the coefficients on trip_requests are still significant and have the hypothesized negative sign.
.jpeg)
Thus, the results provide evidence that carpool matching exhibits increasing returns to scale. These returns to scale open the door to a positive feedback mechanism, whereby usage and quality reinforce each other. While our results do not explicitly confirm the existence of such a virtuous cycle, they do suggest that efforts and technologies that encourage carpooling could have exponential returns.
Acknowledgements
This research was supported by NSF Grant CMMI-2052337. The authors are grateful to Robert Regue and Scoop for supplying the dataset.
The COVID-19 crisis led Scoop to refocus on a different line of business.