

1. Questions
The criticality of a transport segment indicates the importance of that segment to the overall functionality of the transport system. By identifying critical segments in a transport network, decision makers can prioritize their limited intervention budgets (Jafino, Kwakkel, and Verbraeck 2020; Jenelius, Petersen, and Mattsson 2006). However, such criticality analysis is mainly based on a utilitarian principle, where focus is on measuring the total utility of the transport system for all peoples (Dehghani, Flintsch, and McNeil 2014; Gauthier, Furno, and El Faouzi 2018; Ortega, Martín, and Aparicio 2020). As utilitarian theory is blind to the distribution of costs and benefits among the affected communities, such decisions could amplify existing inequalities (Beyazit 2015; Van Wee and Geurs 2011; Yu et al. 2016) or even perpetuate new forms of disparities (Konow 2003; Pazner and Schmeidler 1978). Scholars have proposed the use of multiple distributive equity principles to perform equity-based transport policy analysis (Martens 2006; Pereira, Schwanen, and Banister 2017). Yet, there is no understanding of how criticality varies by the choice of equity principles in the analysis.
In this study, we perform an equity-based road network criticality analysis for 22 developing countries. We use four different distributive principles to calculate the criticality of the road segments: proportionality[1] (distribution of benefits should maximize overall welfare), equality (equal distribution of benefits for regions, irrespective of the existing inequalities), and two equalization principles (equalize existing inequalities by attributing higher weights to regions that are worse-off) (Jafino 2021). We evaluate how the choice of the distributive principles affects the identification of the critical segments. We find that depending on the principle employed, the set of most critical links changes considerably. This finding suggests that transport authorities must use measures of criticality in accordance with their values (e.g., justice, sustainability, or equity) in the planning-specific context.
2. Methods
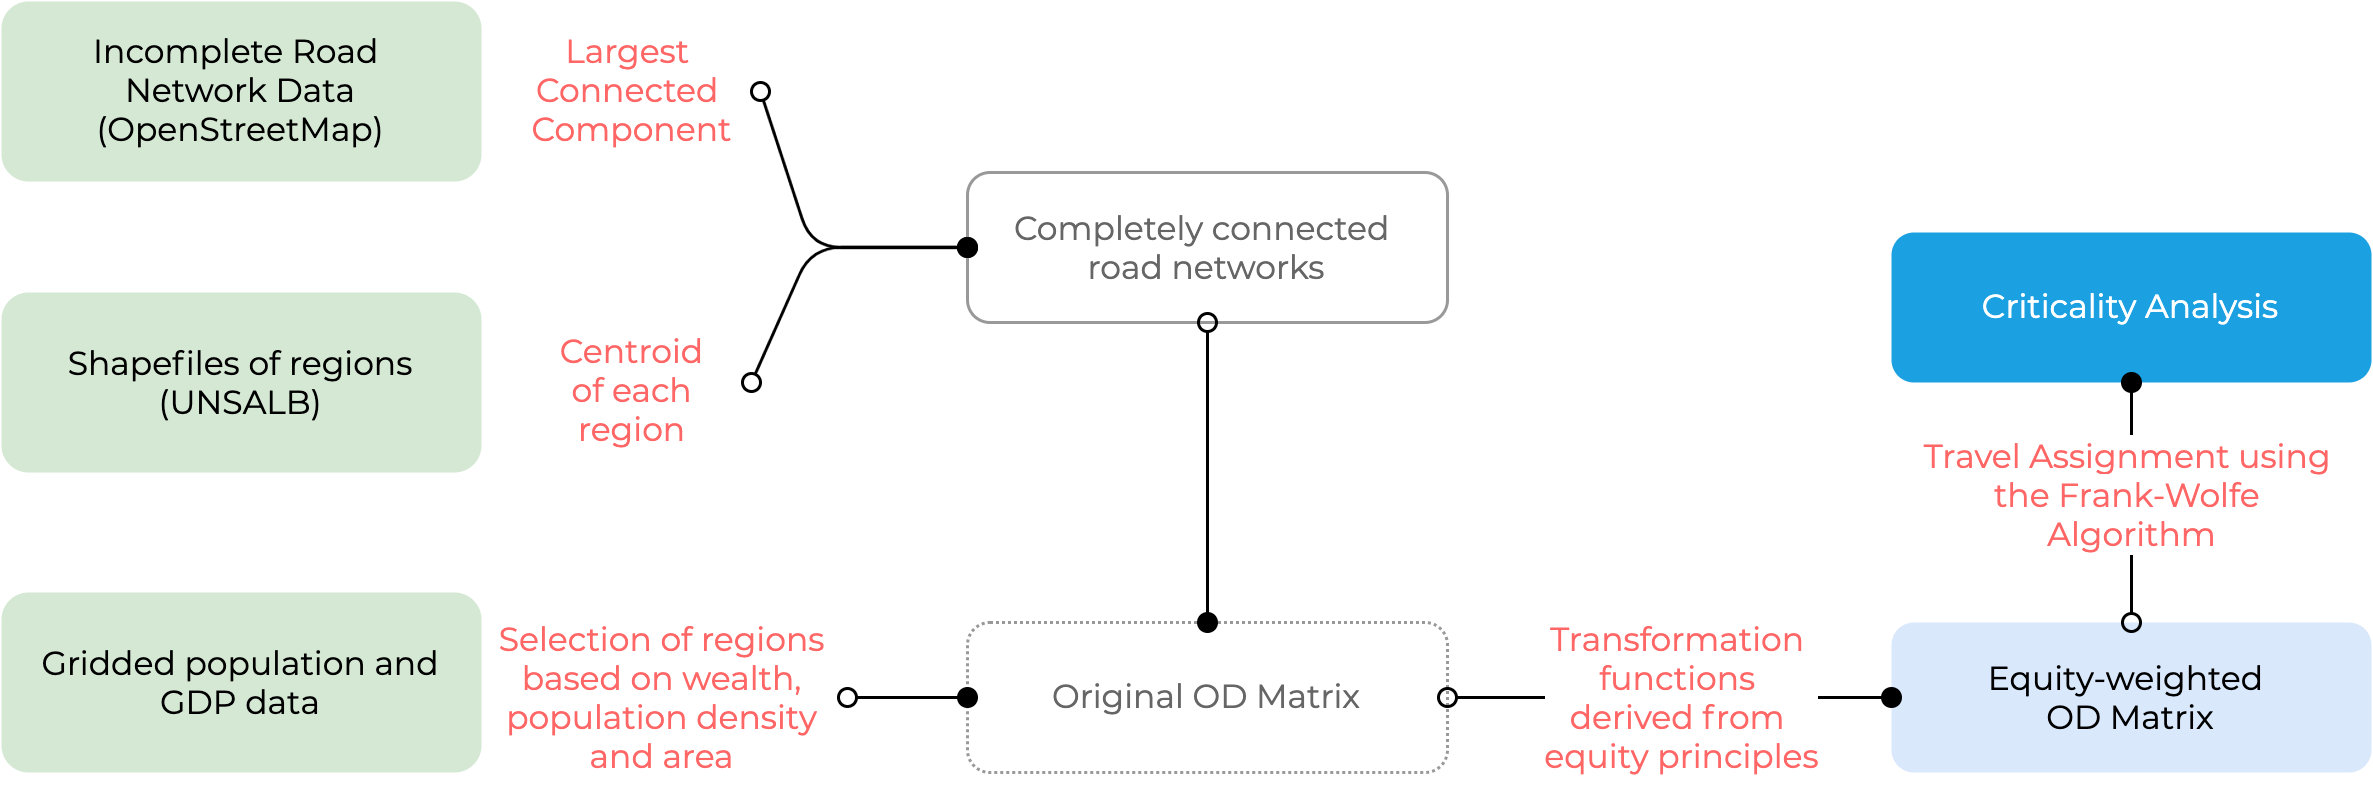
A key step in equity-based transport network criticality analysis is generating an equity-weighted Origin-Destination (OD) matrix: a modified OD matrix that explicitly takes into account certain distributive principles (Jafino 2021). The calculation of this matrix involves two steps. First, a standard OD matrix (De Dios Ortúzar and Willumsen 2011) is calculated based on the population density of each region. Second, the matrix is transformed to reflect equity using four distributive principles previously used in equity-based criticality analysis (Jafino 2021): proportionality, equality, equalization for population density, and equalization for GDP per capita (see Supplementary Information for more details). Using the resulting equity-weighted OD matrices, we applied an all-or-nothing algorithm (De Dios Ortúzar and Willumsen 2011) to assign equity-weighted volume of traffic[2] across the network (Qian 2016). Upon completion of travel assignment, we ranked the links in terms of importance: the larger the volume of travel assigned to a link, the higher the importance of that link.
We defined the origins and destinations within a country as the centroid of each level-2 administrative region (“Unsalb Methodology,” n.d.). To scale our analysis to 22 countries, we included all regions in countries with less than 300 regions in the OD matrix calculations. For countries with more than 300 regions, we used approximately 3 arc-second (92m at the equator) resolution gridded population (Lloyd, Sorichetta, and Tatem 2017) and 5 arc-min resolution (9.2km at the equator) Gross Domestic Product (GDP) (Kummu, Taka, and Guillaume 2018) data to identify the population density and GDP per capita of each region[3]. Subsequently, we selected 300 regions from the 75 most population-dense, 75 wealthiest, 75 poorest, and 75 largest regions. We obtained undirected network data from OpenStreetMaps (OSM) (OpenStreetMap contributors 2017), and assigned travel speeds to each link based on the network edge classification (e.g., primary, secondary, residential) found in OSM (see Table 2 in the Supplementary Information). We defined the cost of traversing an edge as the free flow time it takes to travel the length of the edge. Due to incomplete data availability in OSM (Barrington-Leigh and Millard-Ball 2019), to resolve any disconnected components in the network, we established direct links from the nearest point on the main connected network to region centroids which are not directly connected to the network. Figure 1 shows a simplified overview of the methods, from data collection to modelling and analysis.

For the analysis, we selected 22 countries based on two criteria: (1) Income level, where we only selected Upper middle-income, Lower middle-income and Lower income economies (The World Bank 2020), and (2) Completeness of transportation network on OSM, where we only selected countries with OSM network data exceeding 80% completeness (Barrington-Leigh and Millard-Ball 2019). Key characteristics of the selected countries are shown in Table 3 in the Supplementary Materials.
3. Findings
Figure 2 illustrates the criticality ranking of the road segments across the different equity principles for four selected countries. Here, each line represents a road segment in the network. Several observations can be made. First, across countries, we find contrasting criticality results especially between the proportionality and the population-based equalization principles. In Brazil, for instance, the top 100 most critical segments based on the proportionality principle have been pushed to about ≈ > 80,000 in the population-based rank. Second, the comparison of criticality results from the proportionality and GDP-based equalization principles are more mixed. In Vietnam, the rank of the top 100 most critical segments based on the proportionality principle vary between 25,000-50,000 when looked from the GDP-based equalization principle. On the contrary, in Yemen both the proportionality and the GDP-based equalization principles illuminate many similar segments as critical. Third, the rankings of the most critical segments from the proportionality principle are spread throughout the entire ranking spectrum when looked from the equality principle. The remaining countries’ results are provided in Section 3 of the Supplementary Materials.

For planning purposes, it is also important to understand the changes in the spatial distribution of the critical segments in addition to the changes in their rankings (Knoop et al. 2012; Behbahani et al. 2019). Figure 3 visualizes how far apart the critical segments are in Morocco as identified by the different principles. The most critical segments from the proportionality lens are the roads around Marrakesh, the capital city in the centre of the country, as well as coastal roads nearby Casablanca, another city in the northwest. When looked from the population-based equalization principle, road segments located southwest of the country become critical, as these segments provide connection to the more rural areas around this region. This example emphasizes how the spatial distribution of the most critical links vary across the different equity principles. The remaining visual representations of the 22 countries can be found in Section 4 of the Supplementary Materials.

In terms of the four distributive principles we have used, our findings suggest that depending on how planners incorporate their values into the criticality measurements, very different communities may benefit from interventions. For example, in Yemen (Figure 2), the proportionality and GDP-based equalization principles yield a similar set of critical links, implying that substantial traffic also originates from less wealthy regions. Prioritizing interventions for the most critical links using both measurements will lead to substantive benefits for the same communities. The inverse is true in Vietnam, where communities with more concentrated wealth (higher GDP) have higher inter-region mobility across the country. Here, solely prioritizing links that are critical from a utilitarian (i.e., proportionality) perspective may exacerbate underlying spatial inequalities in the transport network. As shown in the case of Morocco, differences in spatial distribution (Figure 3) of critical segments suggest that interventions within the same administrative governance system may use a combination of measurements to bring both utilitarian and equitable outcomes for communities. Note that if there are socio-economic heterogeneities among neighborhoods within a region, the simplification of using regional centroids as the OD node might affect the findings. Even though the benefits of overall interventions may accrue equitably across regions, within a region any benefit will be utilitarian in nature.
To conclude, we have empirically shown how the choice of distributive principles affects criticality results in 22 countries. Our findings emphasize two important policy implications. First, in doing criticality analysis, we inevitably make choices on the underlying equity principles, either by adopting the standard utilitarian approach (Jafino, Kwakkel, and Verbraeck 2020) or by deliberating the underlying equity principles. Second, we highlight the importance of considering multiple principles together when conducting criticality analysis. The differentiating outcomes suggest that the resulting criticality measurements cannot escape the normative judgements imposed by planners. With the involvement of more actors in the decision-making process, their policy objectives can be captured with different measures. Thus, it is imperative to look at a set of such measurements to balance trade-offs among the group of actors (Franssen 2005). By accounting for multiple principles, our approach could be useful to support decision makers in seeking a set of targeted interventions and avoiding unintended distributional consequences.
The distributive principle of Proportionality is similar to Utilitarianism
Note: Equity-weighted volume is not the actual volume of estimated traffic but a proxy for the importance of a link in the context of the distributive principle.
We summed the population counts for each region; for GDP per capita, we obtained the average GDP per capita of all grid cells overlapping within the administrative region.