Loading [Contrib]/a11y/accessibility-menu.js
Findings
  • Menu
  • Articles
    • Resilience Findings
    • Transport Findings
    • Urban Findings
    • All
  • For Authors
  • Editorial Board
  • About
  • Blog
  • search

    Sorry, something went wrong. Please try your search again.
    ×

    • Articles
    • Blog posts

RSS Feed

Enter the URL below into your favorite RSS reader.

https://findingspress.org/feed
×
Transport Findings
June 16, 2021 AEST

How Stable Are Transport-Related Attitudes over Time?

Laura Mirtich, Matthew Wigginton Conway, Deborah Salon, Peter Kedron, Rishabh Singh Chauhan, Sybil Derrible, Sara Khoeini, Abolfazl (Kouros) Mohammadian, Ehsan Rahimi, Ram Pendyala,
covid-19 transport-related attitudes panel analysis factor analysis attitude stability
Copyright Logoccby-sa-4.0 • https://doi.org/10.32866/001c.24556
Photo by DJ Johnson on Unsplash
Findings
Mirtich, Laura, Matthew Wigginton Conway, Deborah Salon, Peter Kedron, Rishabh Singh Chauhan, Sybil Derrible, Sara Khoeini, Abolfazl (Kouros) Mohammadian, Ehsan Rahimi, and Ram Pendyala. 2021. “How Stable Are Transport-Related Attitudes over Time?” Findings, June. https://doi.org/10.32866/001c.24556.
Save article as...▾
  • PDF
  • XML
  • Citation (BibTeX)
Data Sets/Files (13)
Download all (13)
  • Table 1. Test-retest reliability of individual attitudinal statements
    Download
  • Figure 1. Heatmaps of Wave 1 and Wave 2 responses to two additional statements
    Download
  • Table 2. Summary of Waves 1 and 2 factor scores based on Wave 1 factor analysis
    Download
  • Figure 2. Histogram of changes in score between Wave 1 and Wave 2 for each factor from the Wave 1 factor analysis
    Download
  • Figure 3. Correlations between Wave 1 and Wave 2 scores for each factor from the Wave 1 factor analysis
    Download
  • Table 3. Attitudinal factor stability for different demographic groups
    Download
  • Supplemental Materials
    Download
  • Supplemental: Replication Script
    Download
  • Data for Replication 1-5
    Download
  • Data for Replication 2-5
    Download
  • Data for Replication 3-5
    Download
  • Data for Replication 4-5
    Download
  • Data for Replication 5-5
    Download

Sorry, something went wrong. Please try again.

If this problem reoccurs, please contact Scholastica Support

Error message:

undefined
×

View more stats

Abstract

The utility of attitudes in travel demand forecasting requires predictability. Any attempt to simulate future attitudes, as is done in such models, would be impractical if they were subject to substantial unpredictable variation over time. We investigate the stability of attitudes using waves of the COVID Future survey answered 3.5–11 months apart. Attitudinal statements have moderate stability while factor-analyzed attitudes demonstrate moderately high stability. This stability is consistent across demographic groups. Attitudes about COVID-19 are particularly stable, while those about remote work and communication are more unstable. We conclude that attitudes display enough stability over 6 months to be useful.

1. Questions

Attitudes and preferences are important for modeling travel behavior (Conway et al. 2020). Because of their correlation with relatively stable behaviors (e.g., mode choice), we hypothesize that transport-related attitudes are predictable over time. While some have found this to be the case (van de Coevering, Maat, and Wee 2021), others have reported instability over time frames ranging from one week to two years (Sunkanapalli, Pendyala, and Kuppam 2000; Adams et al. 2013; Thøgersen 2006).

We examine the stability of individual questions as well as factors which represent underlying attitudes indicated by multiple questions. We hypothesize that stability will be higher for factors, since factors are less likely to reflect idiosyncratic responses to individual questions.

2. Methods

Our data come from the first two waves of the COVID Future survey, which were administered in April–October 2020 and November 2020–March 2021 (Chauhan et al. 2021), with individual responses recorded three and a half to eleven months apart. About 50% of responses were recorded between four and six months apart, and another 35% between six and eight months. 8% of responses were recorded under four months apart and 6% were recorded over eight months apart. We used a convenience sample to gather initial responses. This allowed us to quickly begin analyzing data, although the sample was unrepresentative. To achieve a larger, representative sample, we contacted respondents through survey organizations (Data Axle and Qualtrics) using a quota-sampling method. The 2,682 respondents analyzed here are fairly representative, though older, more educated, more likely to be female, and slightly higher income than the population (Table S1). All respondents were from the United States, with 44 of 50 states and Washington, D.C. represented.[1]

The survey included Likert-scaled indicators of travel-related attitudes ranging from environmentalism to opinion on remote work. For each of the 22 attitudinal statements analyzed, we recorded the mean score for each of the two waves of the survey and the mean absolute difference in score, with a one-point difference indicating a one-point shift on a five-point scale. We also reported the percentage of respondents who answered a question identically in both waves of the survey as well as the percentage of respondents whose change in answer between waves was zero or one points. An intraclass correlation coefficient (ICC) is provided for each question. ICC is a correlation coefficient used to measure the similarity of observations between paired waves of data. As is recommended by Koo and Li (2016), a two-way mixed effect, absolute agreement, single rater ICC is calculated.

Factor analysis is commonly used to identify underlying attitudinal constructs (Conway et al. 2020). We performed an exploratory factor analysis of the attitudinal statements to identify six factors from Wave 1 responses (Table S2).

Using the regression method, we estimated factor scores for both Wave 1 and Wave 2 responses. Factor analysis is generally applied to standardized data (Grice 2001). In order to make factor scores directly comparable, we “standardized” the Wave 2 responses using the mean and standard deviation of the Wave 1 data. We also standardized the computed factor scores to have mean 0 and standard deviation 1. Since the Wave 1 data was used for standardization, the mean and standard deviation of Wave 2 factor scores were slightly different from 0 and 1, although close. Due to this standardization, a 1-point change in a factor score can be interpreted as a one-standard deviation change.

In line with the methodology of Adams et al. (2013), we calculated an ICC for the Wave 1 and Wave 2 scores for each attitude, as well as the mean score difference and the mean absolute score difference between the two waves. We also calculated the percentage of respondents whose Wave 2 score was within one standard deviation of their Wave 1 score.

We replicated all factor-level analysis basing the factor analysis on Wave 2 rather than Wave 1 data and found similar results (Table S3).

3. Findings

Travel-related attitudinal statements demonstrate moderate stability (Table 1). The mean absolute difference in score was less than one for all statements. For most statements, only 50-60% of respondents provided exactly the same answers in both waves, which could suggest that responses are not stable. However, about 90% of respondents selected an answer that was the same or adjacent on the Likert scale—for instance, transitioning from strongly disagree to somewhat disagree. These small changes are unlikely to materially affect conclusions, particularly once factor-analyzed.

Table 1.Test-retest reliability of individual attitudinal statements
Mean
Wave 1 Wave 2 Mean absolute difference Percent exactly matching Percent within 1 point ICC
Shutting down businesses to prevent the spread of coronavirus is not worth the economic damage that will result -0.67 -0.44 0.63 56% 87% 0.71
I am concerned that friends or family members will have a severe reaction to the coronavirus if they catch it 1.03 0.94 0.56 57% 90% 0.63
Society is overreacting to the coronavirus -1.05 -1.02 0.45 69% 91% 0.76
If I catch the coronavirus, I am concerned that I will have a severe reaction 0.65 0.52 0.61 55% 88% 0.69
Everyone should just stay home as much as possible until the coronavirus has subsided 1.11 0.98 0.55 59% 90% 0.69
My friends and family expect me to stay at home until the coronavirus subsides 0.42 0.27 0.81 43% 82% 0.54
I am committed to using a less polluting means of transportation (e.g., walking, biking, and public transit) as much as possible 0.29 0.27 0.60 53% 90% 0.69
I am committed to an environmentallyfriendly lifestyle 0.76 0.76 0.43 62% 95% 0.71
I dislike change 0.08 0.08 0.55 57% 90% 0.67
I enjoy spending time with the people I live with 1.23 1.23 0.39 68% 94% 0.65
Apartment living doesn’t provide enough privacy 0.51 0.51 0.70 50% 85% 0.57
Having shops and services within walking distance of my home is important to me 0.49 0.47 0.63 50% 88% 0.70
I like to have a yard at home 1.21 1.22 0.41 66% 94% 0.71
Even if I do not end up buying anything, I still enjoy going to stores and browsing 0.27 0.30 0.69 51% 85% 0.66
In-person shopping is usually a chore for me -0.12 -0.09 0.63 53% 88% 0.69
Online learning is a good alternative to high school- and college-level classroom instruction 0.11 0.01 0.83 43% 79% 0.54
Video calling is a good alternative to inperson business meetings 0.79 0.80 0.67 50% 87% 0.50
Video calling is a good alternative to visiting friends and family 0.18 0.09 0.81 46% 80% 0.56
It is hard to get motivated to work away from the main office -0.33 -0.34 0.73 51% 82% 0.52
I like working from home 0.56 0.52 0.58 58% 86% 0.63
I enjoy the social interaction found at a conventional workplace 0.65 0.66 0.54 56% 92% 0.65
Learning how to use new technologies is often frustrating -0.15 -0.11 0.63 54% 87% 0.69

Koo and Li (2016) suggest ICC cutoffs of 0.5, 0.75, and 0.9 to signify moderate, high, and excellent stability, respectively. All statements have moderate stability, except one with high stability.

Figure 1 illustrates the stability of attitudinal statements by displaying heatmaps for the questions with the highest and lowest ICC values. Darker values indicate higher numbers of respondents associated with a particular cell. Both questions show a clustering of respondents along the bottom left-top right diagonal, which contains the 5 cells associated with the same answer in both waves of the survey.

Figure 1
Figure 1.Heatmaps of Wave 1 and Wave 2 responses to two additional statements

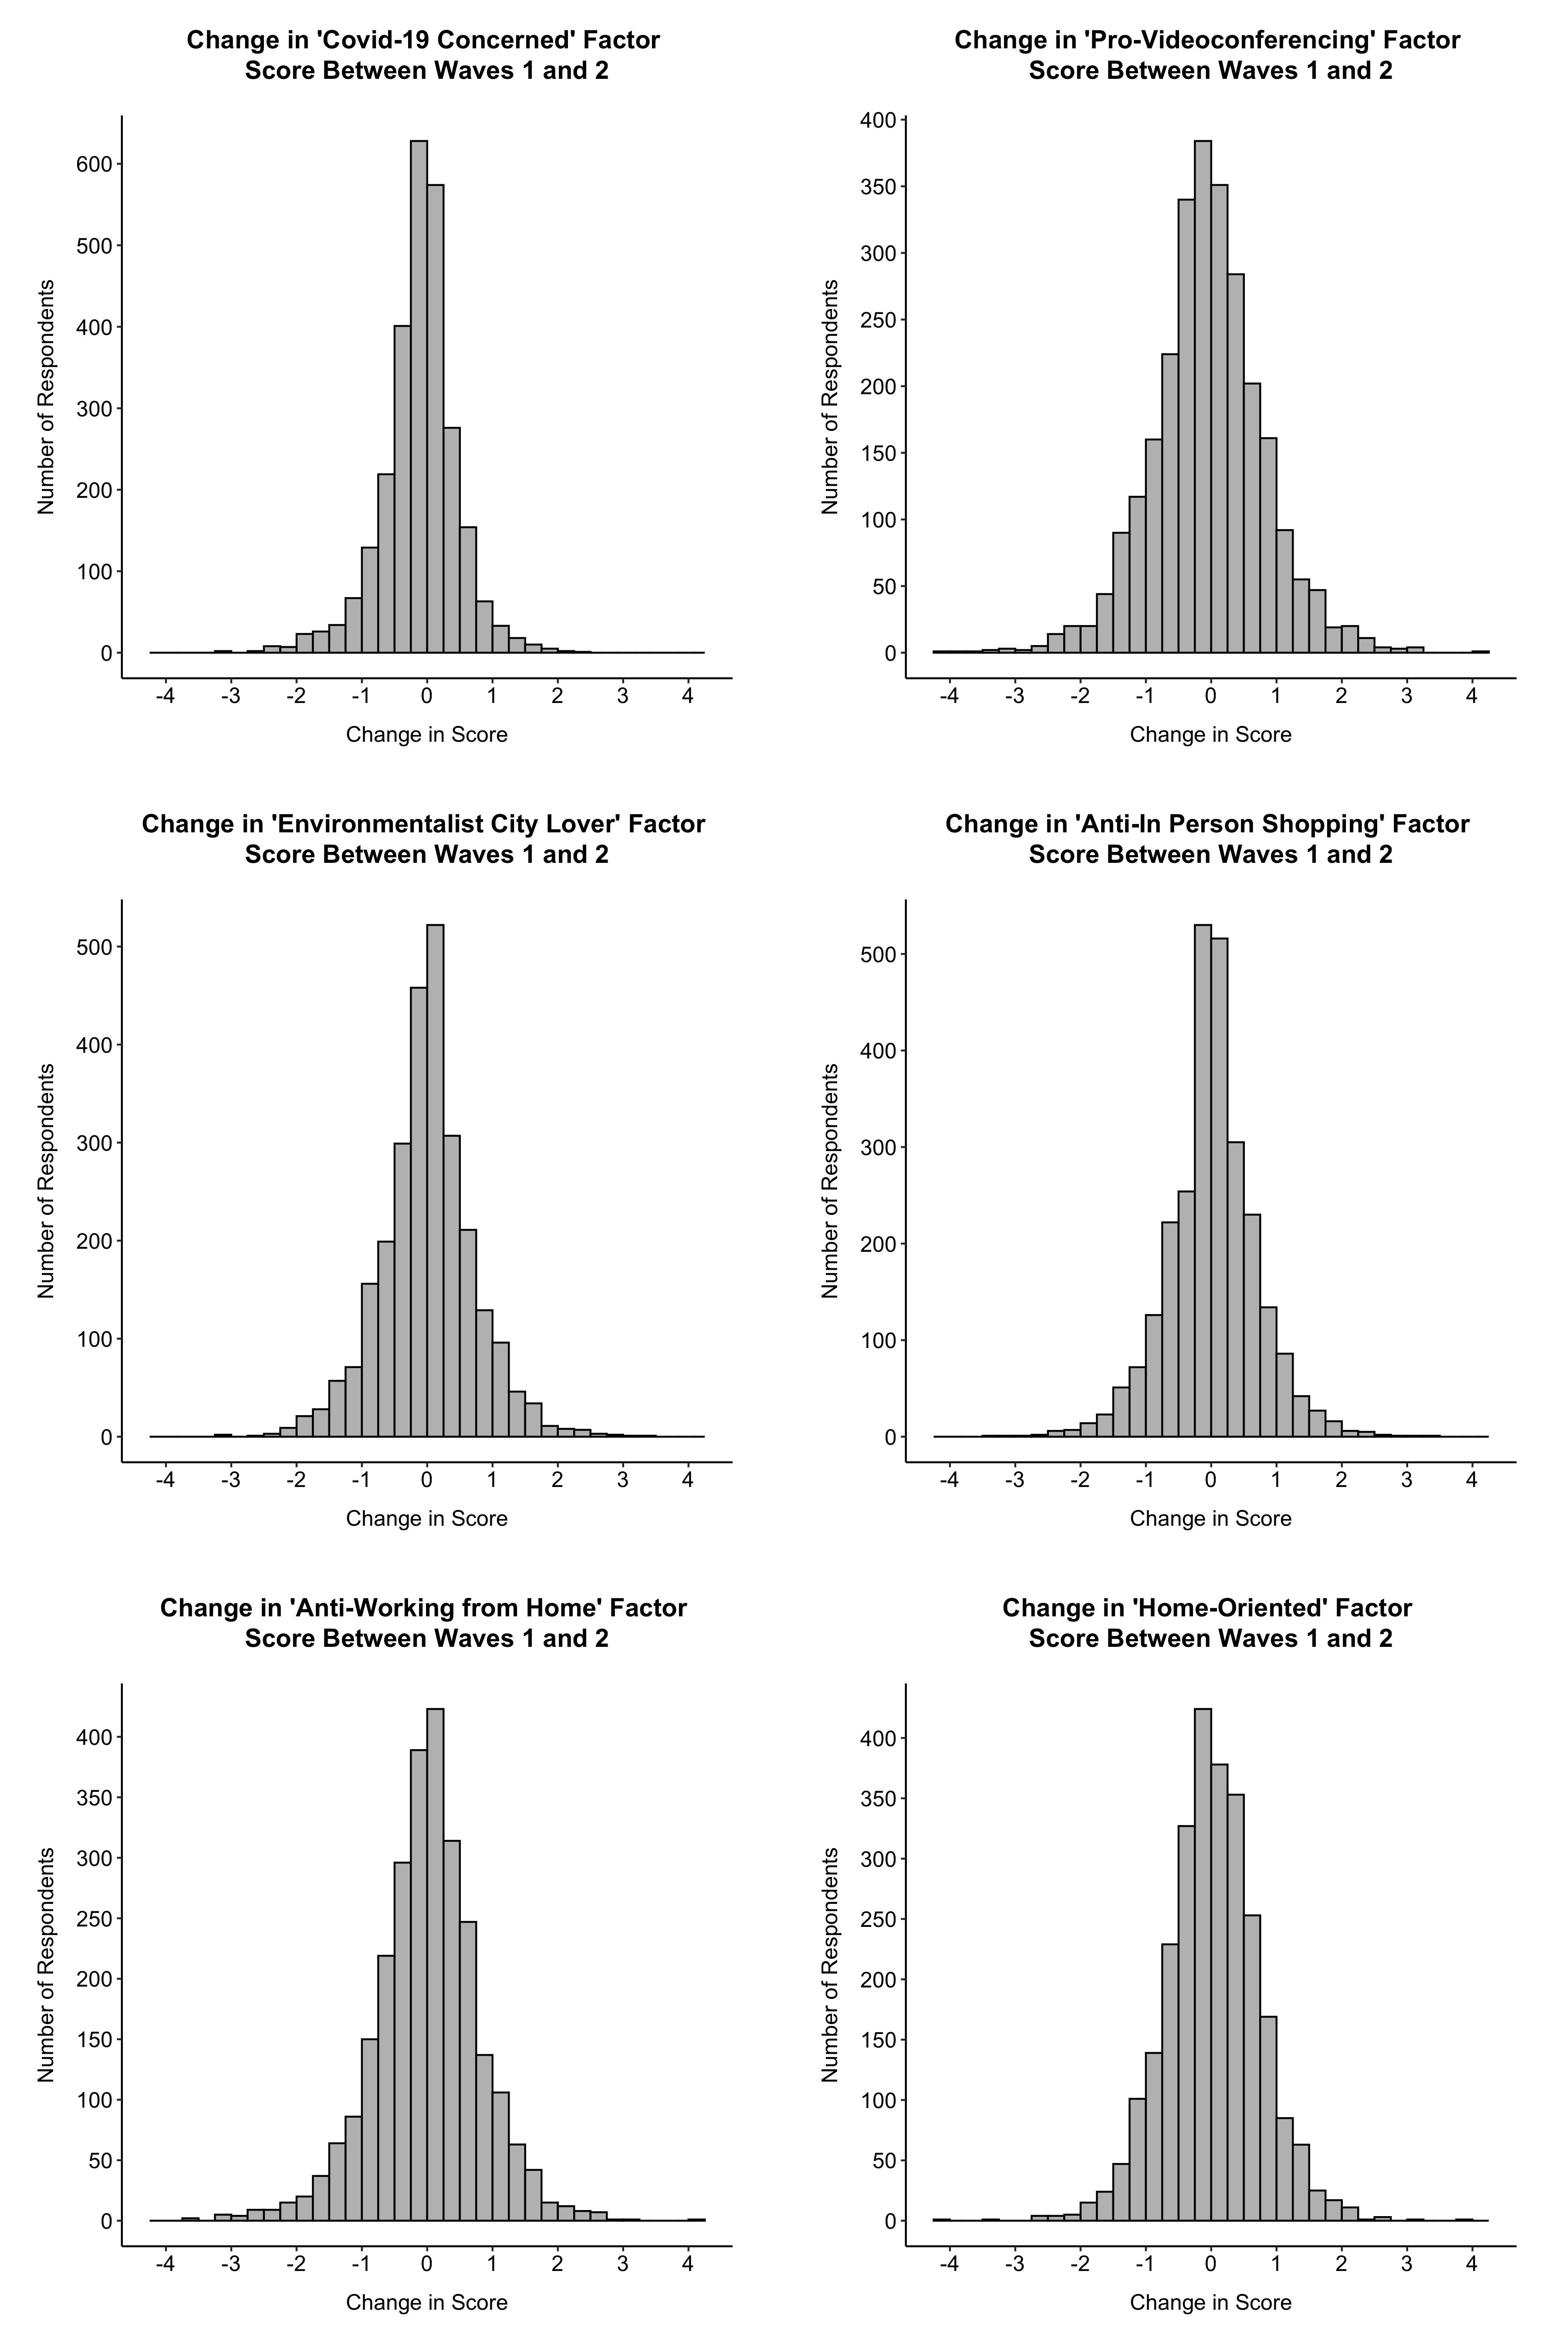
Our analysis shows that factor-analyzed attitudes are fairly stable over time (Table 2). Changes in factor scores are symmetrical around 0, showing no definite trend over time (Figure 2). The mean absolute changes in score are all fractions of a standard deviation. The changes in attitude that did occur were fairly small in magnitude; 79–91% of respondents recorded a change in factor score of less than one standard deviation.

Table 2.Summary of Waves 1 and 2 factor scores based on Wave 1 factor analysis
Mean change
in score
Mean absolute
change in score
Percent
within 1 SD
ICC
Covid-19 concerned -0.11 0.42 91% 0.83
Pro-videoconferencing -0.05 0.64 79% 0.62
Environmentalist city lover 0.01 0.52 85% 0.74
Anti-in-person-shopping 0.01 0.50 86% 0.76
Anti-working from home 0.00 0.60 81% 0.67
Home-oriented 0.02 0.55 85% 0.74
Figure 2
Figure 2.Histogram of changes in score between Wave 1 and Wave 2 for each factor from the Wave 1 factor analysis

The ICC values for factors also demonstrate stability. Using the guidelines recommended by Koo and Li (2016), two attitudes display high stability and four display moderate stability. Attitudinal factors are generally found to be more stable than statements (Adams et al. 2013), which our analysis corroborates. On average, factors had higher ICCs than questions did.

As an additional examination of factor-level stability, respondents’ two Wave 1 and Wave 2 scores for a given factor were plotted (Figure 3). These scatter plots show clustering around the identity line, indicating that most respondents have Wave 2 scores very close to their Wave 1 scores.

Figure 3
Figure 3.Correlations between Wave 1 and Wave 2 scores for each factor from the Wave 1 factor analysis

Some have found that attitude stability is lower for certain demographic groups (Visser and Krosnick 1998). We repeated our factor-level analysis for subsamples of respondents based on age (under 35, 35-64, 65 and older), gender, education level (with/without a bachelor’s degree), and residential location (urban/suburban/rural[2]). We also compared those who took our survey early in the pandemic (June 2020 or earlier) to those who took it later (July 2020 or later). Finally, we compared those who responded to the two waves of the survey less than 4.5 months apart to those who took longer between waves. While we do find that some groups—notably younger people, residents of rural areas, and those surveyed early in the pandemic—demonstrate lower attitudinal stability, all groups still show at least moderate stability (ICC) for all attitudinal factors (Table 3). We also find that respondents recruited through a Qualtrics opinion panel have higher stability than those recruited through direct email or from a convenience sample, possibly because they are regular survey-takers with developed skills in accurate self-assessment and resistance to survey fatigue.

We conclude that transport-related attitudes are fairly stable over four to eleven months and that factors are more stable than questions based on ICCs. Our analyses also suggest that there is varied stability between different attitudes. “Anti-working from home” and “Pro-videoconferencing” are the least stable across the general sample as well as most demographic subgroups, possibly because the pandemic has familiarized people with remote work and virtual communication technologies. Consistent with findings from the field of psychology, increased familiarity may positively or negatively alter respondents’ perceptions (Hatemi 2013; Norton and Frost 2007).

However, respondent’s attitudes about the danger of COVID-19 were the most stable, despite greater familiarity with COVID-19 during the second wave of the survey. This may indicate agreement between learned information about COVID-19 and prior knowledge, concern about COVID-19 reflecting a more stable risk aversion attitude, or mechanism of attitude change that is more complex than familiarity generating more variable attitudes.

The COVID-19 pandemic has resulted in many people experiencing major life changes. Psychological research suggests that such events are associated with attitude change (Hatemi 2013), and this relationship has been found for travel-related attitudes in particular (Janke and Handy 2019). COVID-19 constitutes a major life event for many, so the stability observed here could be unusually low. In fact, some other reviews of the stability of transport-related attitudes find higher question-level ICCs of 0.66 to 0.77 (Molina-Garcia, Castillo, and Sallis 2010), which suggests greater reliability of attitudinal indicators under more typical circumstances. Even in this atypical time, however, attitudes are quite stable.

Table 3.Attitudinal factor stability for different demographic groups
Part A: ICCs
Factor Men (n=951) Women (n=1712) Age <35 (n=421) Age 35-64
(n=1401)
Age ≥ 65
(n=830)
Bachelor's degree (n=1598) No bachelor's degree (n=1082) Qualtrics (n=1649)
Covid-19 concerned 0.83 0.82 0.75 0.84 0.81 0.83 0.81 0.84
Pro-videoconferencing 0.63 0.61 0.58 0.64 0.55 0.64 0.56 0.58
Environmentalist city lover 0.72 0.74 0.68 0.74 0.72 0.73 0.71 0.72
Anti-in person shopping 0.75 0.76 0.68 0.76 0.75 0.75 0.75 0.78
Anti-working from home 0.65 0.67 0.62 0.67 0.65 0.68 0.62 0.66
Home-oriented 0.72 0.74 0.68 0.72 0.73 0.72 0.75 0.75
Factor Urban (n=947) Suburban (n=1541) Rural (n=182) Early respondents (n=345) Late respondents (n=2337) Long gap (n=1593) Short gap (n=1089) All (n=2682)
Covid-19 concerned 0.80 0.83 0.81 0.71 0.83 0.80 0.85 0.83
Pro-videoconferencing 0.65 0.59 0.51 0.58 0.60 0.63 0.59 0.62
Environmentalist city lover 0.73 0.73 0.70 0.65 0.72 0.72 0.73 0.74
Anti-in person shopping 0.75 0.76 0.69 0.65 0.77 0.74 0.79 0.76
Anti-working from home 0.67 0.67 0.58 0.61 0.67 0.66 0.69 0.67
Home-oriented 0.74 0.72 0.64 0.58 0.74 0.72 0.75 0.74
Part B: Percent of Respondents with change in score < 1
Factor Men (n=951) Women (n=1712) Age <35 (n=421) Age 35-64
(n=1401)
Age ≥ 65
(n=830)
Bachelor's degree (n=1598) No bachelor's degree (n=1082) Qualtrics (n=1649)
Covid-19 concerned 90% 93% 91% 93% 91% 92% 91% 93%
Pro-videoconferencing 86% 83% 77% 86% 78% 86% 82% 83%
Environmentalist city lover 88% 88% 77% 88% 88% 89% 86% 88%
Anti-in person shopping 90% 91% 84% 90% 91% 91% 89% 91%
Anti-working from home 88% 90% 75% 89% 86% 89% 85% 88%
Home-oriented 94% 93% 84% 94% 93% 93% 95% 95%
Factor Urban (n=947) Suburban (n=1541) Rural (n=182) Early respondents (n=345) Late respondents (n=2337) Long gap (n=1593) Short gap (n=1089) All (n=2682)
Covid-19 concerned 85% 92% 90% 77% 93% 90% 94% 91%
Pro-videoconferencing 82% 85% 80% 79% 84% 85% 84% 79%
Environmentalist city lover 86% 88% 81% 75% 87% 88% 87% 85%
Anti-in person shopping 87% 91% 88% 82% 91% 89% 93% 86%
Anti-working from home 86% 90% 82% 81% 88% 88% 90% 81%
Home-oriented 91% 93% 89% 83% 94% 93% 95% 85%

Acknowledgements

Conceptualization: LM, MWC, DS; Methodology: LM, MWC, DS, PK; Software: MWC; Validation: LM, MWC; Formal analysis: LM, MWC; Investigation: MWC, DS, SD, KM, ER; Data curation: MWC; Writing - original draft: LM; Writing - review & editing: LM, MWC, DS, PK, SD, A(K)M, SK, RP, ER; Visualization: LM; Project administration: LM; Funding acquisition: DS, SD, KM, RP


  1. The sample did not include any respondents from Alaska, Delaware, Hawaii, Montana, North Dakota, or Wyoming

  2. Areas considered urban have more than 2,213 households per square mile and areas considered suburban have more than 102 households per square mile (Kolko 2015).

Submitted: April 27, 2021 AEST

Accepted: June 04, 2021 AEST

References

Adams, E. J., A. Goodman, S. Sahlqvist, F. C. Bull, and D. Ogilvie. 2013. “Correlates of Walking and Cycling for Transport and Recreation: Factor Structure, Reliability and Behavioural Associations of the Perceptions of the Environment in the Neighbourhood Scale (PENS).” International Journal of Behavioral Nutrition and Physical Activity 10. https://doi.org/10.1186/1479-5868-10-87.
Google Scholar
Chauhan, Rishabh, Matthew W. Conway, Denise Silva, Deborah Salon, Ali Shamshiripour, Ehsan Rahimi, Sara Khoeni, Abolfazl Mohammadian, Sybil Derrible, and Ram Pendyala. 2021. “A Database of Travel-Related Behaviors and Attitudes before, during, and after COVID-19 in the United States.” Scientific Data.
Google Scholar
Coevering, Paul van de, Kees Maat, and Bert Wee. 2021. “Causes and Effects between Attitudes, the Built Environment and Car Kilometres: A Longitudinal Analysis.” Journal of Transport Geography 91: 102982. https://doi.org/10.1016/j.jtrangeo.2021.102982.
Google Scholar
Conway, Matthew W., Laura Mirtich, Deborah Salon, Nathan Harness, Alexis Ross, and Shuyao Hong. 2020. “How Important Are Attitudes in Travel Behavior Models?” In Bridging Transportation Researchers. https://bridgingtransport.org/blog/archive-of-jan-2020-meeting/.
Google Scholar
Grice, J. W. 2001. “Computing and Evaluating Factor Scores.” Psychological Methods 6 (4): 430–50. http://search.proquest.com/docview/72384053?pq-origsite=summon.
Google Scholar
Hatemi, P. K. 2013. “The Influence of Major Life Events on Economic Attitudes in a World of Gene-Environment Interplay.” American Journal of Political Science 57 (4): 987–1007. https://doi.org/10.1111/ajps.12037.
Google Scholar
Janke, J., and S. Handy. 2019. “How Life Course Events Trigger Changes in Bicycling Attitudes and Behavior: Insights into Causality.” Travel Behaviour and Society 16: 31–41. https://doi.org/10.1016/j.tbs.2019.03.004.
Google Scholar
Kolko, J. 2015. “Urban Headwinds, Suburban Tailwinds.” Trulia Research.
Koo, T. K., and M. Y. Li. 2016. “A Guideline of Selecting and Reporting Intraclass Correlation Coefficients for Reliability Research.” Journal of Chiropractic Medicine 15 (2): 155–63. https://doi.org/10.1016/j.jcm.2016.02.012.
Google Scholar
Molina-Garcia, J., I. Castillo, and J. F. Sallis. 2010. “Psychosocial and Environmental Correlates of Active Commuting for University Students.” Preventive Medicine 51: 136–38. https://doi.org/10.1016/j.ypmed.2010.05.009.
Google Scholar
Norton, M. I., and J. H. Frost. 2007. “Less Is More: The Lure of Ambiguity, or Why Familiarity Breeds Contempt.” Journal of Personality and Social Psychology 92 (1): 97–105. https://doi.org/10.1037/0022-3514.92.1.97.
Google Scholar
Sunkanapalli, S., R. M. Pendyala, and A. R. Kuppam. 2000. “Dynamic Analysis of Traveler Attitudes and Perceptions Using Panel Data.” Transportation Research Record 1718: 52–60. https://doi.org/10.3141/1718-07.
Google Scholar
Thøgersen, J. 2006. “Understanding Repetitive Travel Mode Choices in a Stable Context: A Panel Study Approach.” Transportation Research Part A: Policy and Practice 40 (8): 621–38. https://doi.org/10.1016/j.tra.2005.11.004.
Google Scholar
Visser, Penny S., and Jon A. Krosnick. 1998. “Development of Attitude Strength over the Life Cycle: Surge and Decline.” Journal of Personality and Social Psychology 75 (6): 1389–1410. https://doi.org/10.1037/0022-3514.75.6.1389.
Google Scholar

Powered by Scholastica, the modern academic journal management system