

1. Questions
Local business is often attributed an important voice in processes of urban change. Specifically, when weighing the importance of car storage against cycling infrastructure, local business and business associations have garnered a reputation for opposing bike lanes in favor of on-street car storage space. This is somewhat counterintuitive, as numerous studies indicate that local retailers profit from active travel infrastructure (Arancibia et al. 2019).
The reasons for the positioning of local businesses regarding bike lanes have been attributed to an inaccurate perception of the mobility behavior of their customers (Sustrans 2006). We examine the mobility and spending behavior of visitors to two shopping streets in Berlin and compare the findings with traders’ perceptions of customer behavior.
We formulated the following hypotheses, which we test in this study:
H1: Most shoppers travel to the street without a car.
H2: Traders overestimate the proportion of customers that travel to the street by car, and underestimate other modes.
H3: Shopping is local: the distance that shoppers travel to the street is lower than the distance that merchants estimate that their shoppers travel.
H4: Traders’ estimates of shopper travel behavior correlate with their own travel behavior.
H5: Shoppers who travel by car spend more per visit than active transport.
H6: Shoppers who use active transport modes visit more frequently.
2. Methods
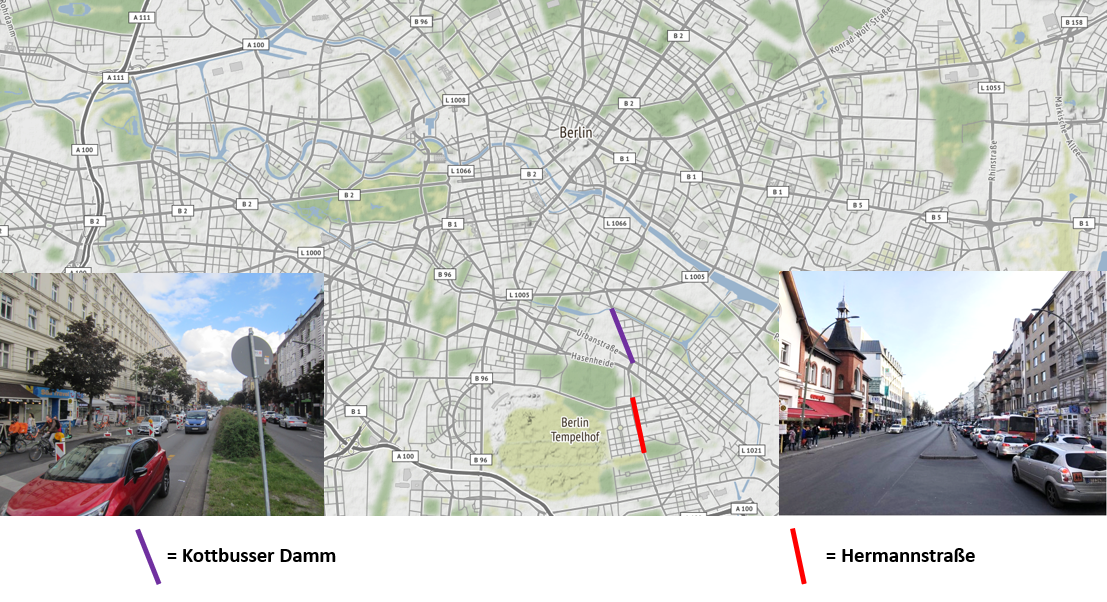
We designed two surveys, one for shoppers and one for local businesses. A 1 km-section of two streets, Kottbusser Damm (KD) and Hermannstrasse (HS) were selected for the study (Figure 1). The streets exhibit a similar urban structure with the exception of a “pop-up bicycle lane” installed on KD shortly before our research.
Potential shoppers were intercepted at random by researchers walking along each side of the streets. The shopper surveys were carried out on different weekdays and different times between 8 am and 8 pm. The majority of intercepted interviewees (73%) had already spent money on the street when we interviewed them. The rest may have intended to make purchases, even if this was not the main reason for their visit. Therefore, we refer to all intercepted interviewees as “shoppers,” even if a minority were potential shoppers.
Researchers approached traders in their shops. Trader surveys were conducted in person, with the exception of 9 completed online. A team of six researchers (including the authors) conducted surveys between June and September 2020. A total of N=2021 shoppers (n=1024 on KD; n=997 on HS) and N=145 traders (n=78 on KD; n=67 on HS) were interviewed.
Both surveys were brief, to ensure high completion rates. The surveys for shoppers included six questions addressing: 1) mode of transport to get to the street; 2) distance from the street to home; 3) the main reason for the visit 4) how much they had already spent on the street on the day of interview 5) how many stores visited; and 6) how often per week they visit the street.
The trader surveys asked interviewees to estimate: 1) the proportion of customers using each transport mode; 2) average customer travel distance; 3) average customer spend per visit. They were also asked 4) what mode of transport they use to get to their business.

3. Findings
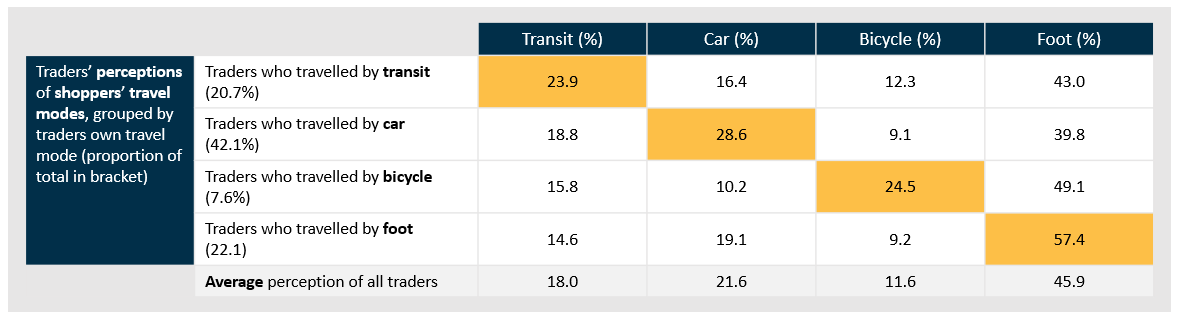
The results show that traders substantially misjudge customer travel modes, underestimating transit and active modes and overestimating automobile use. While only 6.6% of shoppers travelled to the streets by car, on average traders estimated 21.6% of their customers use this mode; a discrepancy of 15% (see Figure 2). Further they underestimate transit, pedestrian, and bicycle travel by 8.1%, 6.2% and 3% respectively. Thus, we confirm H1 and H2.

Table 1 shows trader estimates of shopper transport behavior according to the transport mode of the interviewed trader. The results indicate that transport mode of traders (positively) influences their estimate of the proportion of customers who use the same mode. For example, traders who drive to their business estimated much higher customer car use (28.6%) than traders using other modes, who estimated between 10% and 19%. This tendency is consistently identified across modes, with the exception of traders using transit, who slightly underestimated shopper use of that mode. The car was the mode of choice for 42.1% of merchants; much higher than actual use by shoppers. This, in combination with the observed consensus bias (traders’ transport behavior influences their assumptions about transport behavior of others), suggests an explanation for substantial overestimation of customer car use by interviewed traders. We therefore confirm H4, with a note of caution regarding the underestimation (by 2.2%) of transit by traders who used transit themselves.

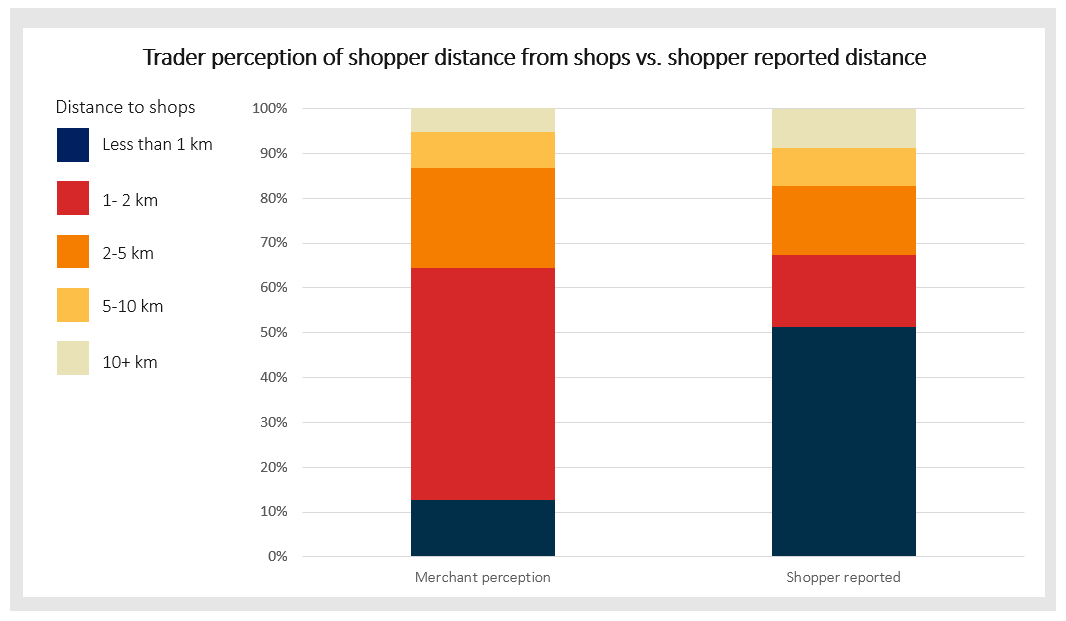
Traders were found to overestimate the distance customers travel to visit their businesses. Our results showed that over half (51.2%) of shoppers lived less than 1 kilometer from the shopping street. In contrast, traders on average estimated that only 12.6% of customers live within this distance (Figure 3). These results confirm H3, demonstrating substantial discrepancy between trader perception of customer travel distance and that reported by shoppers.

Shoppers were asked how much they had spent on that visit to the street until the moment they were interviewed. Real spending is therefore likely higher on average than reflected in our data. On average shoppers who arrived by car spent 23.45€, while cyclists and pedestrians spent 11.98€ and 11.63€, respectively (Table 2). However, drivers represent just 6.58% of the sample and report visiting the streets less frequently than cyclists and pedestrians.
To estimate the relative revenue contribution by mode we calculated a weekly spend based on reported frequency of visit to the street and the representation of the mode in the sample. This assumes that spending behavior will, on average, be replicated at each visit to the street. Mid-point values were applied to the spans and 125€ was assumed for answers of “more than 100€.” Results show that automobile drivers are responsible for the lowest proportion of revenue at 8.7% compared to pedestrians (61%), transit users (16.5%), and cyclists (13.5%). That is, despite spending less than half that of car users per visit, the higher proportion of transit and active transport users combined with greater frequency of visits means these modes contribute the large majority of total revenue (91%). We thus confirm H5 and H6.

Our study method and results are in line with the small but growing body of literature that suggests improved active travel and transit infrastructure is likely to benefit local business (e.g. in North America [Arancibia et al. 2019; Liu and Shi 2020], Britain and Austria [Sustrans 2006], or Australia [Lee and March 2010]). We conducted our survey in summer and early autumn in an exceptional year due to COVID-19. Although infection levels were very low in Germany at the time and transport demand had largely recovered, further research, also over longer time periods and in different sized cities would help to provide a broader evidence base.