
1. Questions
Throughout the Covid-19 pandemic, voters have been justifiably concerned about contracting the virus at in-person polling locations. Accordingly, states and counties across the US raced to provide alternatives to election-day voting. In the November 2020 presidential election, over 100 million voters cast ballots early compared to 47 million in 2016 (McDonald 2021).
Texas is one of only five states that restricted mail-in ballots to voters meeting certain eligibility criteria (Rabinowitz and Mayes 2020). Mail-in ballots could be returned by regular mail or at a secure drop-off location in advance or on election day. As concerns about mail delays grew throughout 2020, all Texas counties planned for at least one drop-off location. Harris County—which contains Houston and is the most populous in the state—planned for 12 locations. Travis County, home to the state’s capital city of Austin, planned for four centrally located drop-off sites.
On October 1, 2020, Texas Governor Greg Abbott issued an executive order limiting drop-off locations to one per county. This order was quickly challenged in court by those seeking to expand ballot access. Ultimately, the Texas Supreme Court ruled in favor of the order in late October 2020.
Changes to voting locations affect access to the polls and voting likelihood (Brady and McNulty 2011; Gimpel and Schuknecht 2003; Haspel and Knotts 2005; Morris and Miller 2021). Consequently, the decision to remove secure drop-off locations risks disenfranchising many Harris and Travis County voters, particularly those without vehicle access. Harris County was most affected because of the substantial change in the spatial distribution of drop-off sites.
We sought to understand the magnitude of changes in access to secure drop-off locations: if a Harris County voter relied on public transit, how did having fewer drop-off locations affect their access relative to drivers? How many Harris County residents were affected by the change? And finally, how did targeting voters in Harris and Travis affect drivers’ access to voting by race and ethnicity statewide?
2. Methods
Accessibility calculations
We calculated shortest-path travel times from population-weighted census block group centroids to the nearest secure ballot drop-off location before and after the executive order. We geocoded drop-off location addresses obtained from the Texas Secretary of State and Texas Democratic Party websites, resolving any discrepancies using county clerk websites. We reviewed archived versions of the Harris and Travis county clerk websites to identify the drop-off locations proposed before the one drop-off location policy was enacted. Our analysis scripts are available on Github.[1]
Auto travel times were estimated statewide assuming a noon October 27, 2020 departure using ESRI’s ArcGIS StreetMap Premium. We calculated average Harris County public transit travel times based on 108 departures randomly selected from within five-minute intervals between 9am and 6pm on the same date using the R package r5r (Pereira et al. 2021) and publicly available General Transit Feed Specification (GTFS) data obtained from https://transitfeeds.com/. Transit travel times were only estimated in block groups where at least one trip could be completed within three hours (including walking time) without walking more than 5 km in the all drop-off location scenario. Block groups that had a feasible transit trip in the all drop-off scenario but not in the one drop-off scenario were assigned a travel time of three hours.
Population measures
We assembled tract-level Harris County vehicle ownership data from the American Community Survey 2014-2018 five-year estimates and obtained eligible voter counts for block groups statewide by race/ethnicity (US Census Bureau 2021). Voters without vehicle access were estimated by applying tract-level shares of zero-vehicle households to block groups. We then summarized population-weighted mean travel times for all eligible voters i) by transit (for those without vehicle access) and by automobile (for those with access) in Harris County and ii) by automobile for all race and ethnicity categories statewide. We did not evaluate changes in transit access statewide due to limitations in publicly available GTFS data.
3. Findings
Figure 1 summarizes driving and public transit travel times to the nearest drop-off location in Harris County before and after the policy change. Accessibility was demonstrably worse for public transit users compared to drivers in all cases—one-way travel times by public transit regularly reached up to three hours while driving times rarely exceeded one hour, even when only one drop-off location was available.
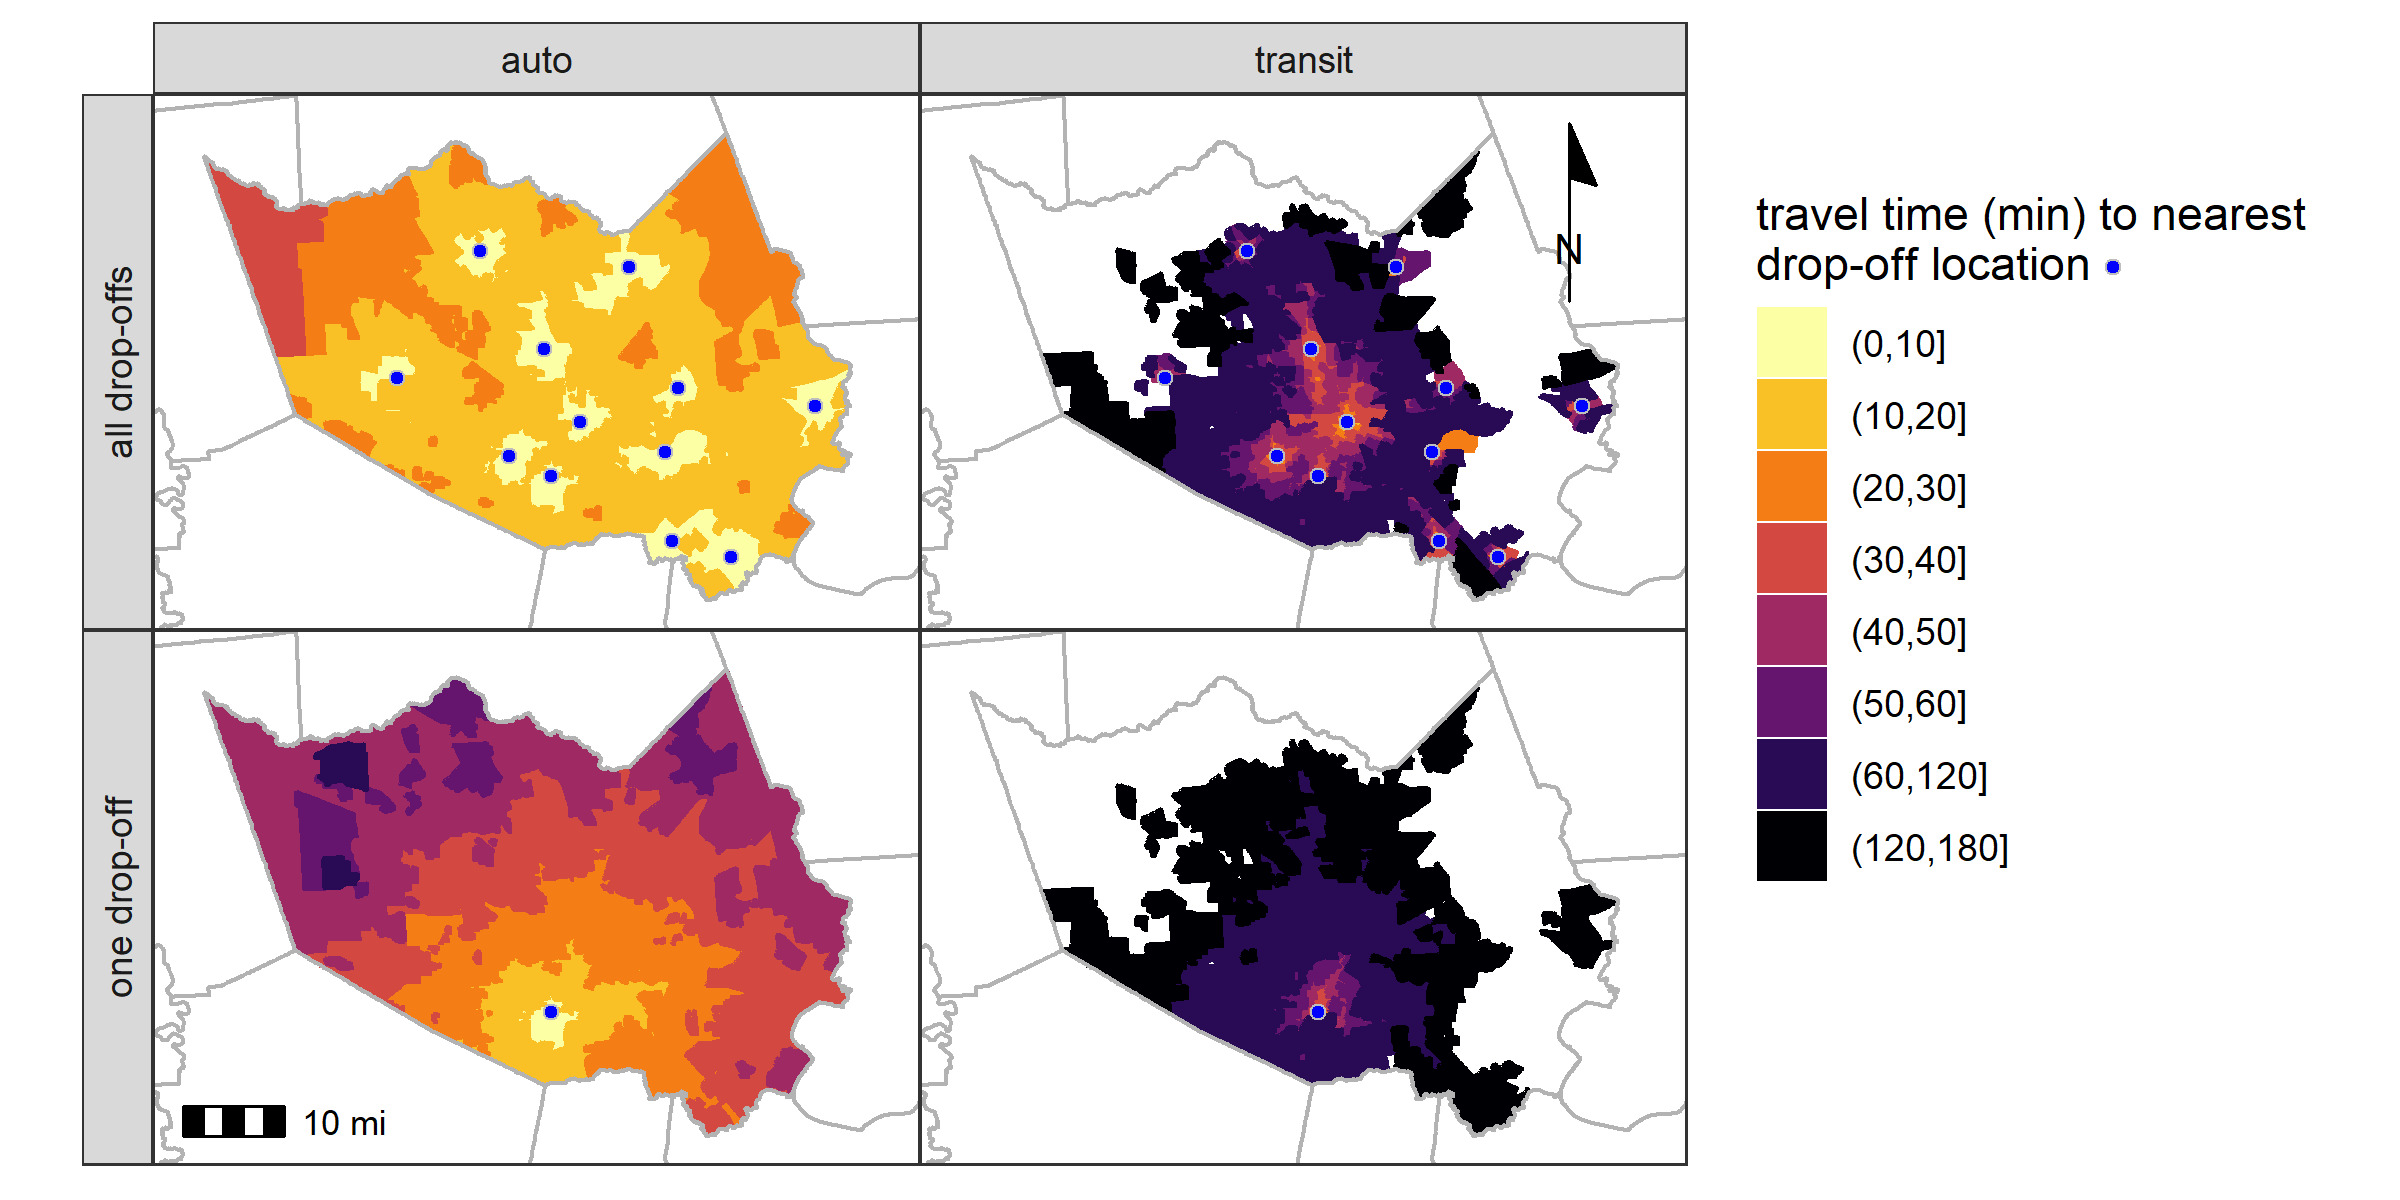
The travel times summarized in Figure 1 can also be assessed using population-weighted averages to evaluate impacts on voters (Table 1). Harris County voters with and without automobile access saw their average travel times worsen substantially with the shift to a one drop-off policy. The impacts of the change on potential transit users compounded the already-long travel times they would have experienced if 12 drop-off locations were available. In fact, the best-case scenario for public transit travel (56 minutes) was worse than the worst case for drivers (32 minutes). For the 143,000 voters without an automobile available, 68,000 would have been able to access their nearest drop-off location within a one-hour transit trip prior to the policy change. This number dropped to 19,000 when the one drop-off location policy was enacted.
Although the one drop-off policy only affected voters in Harris and Travis counties, the substantial number of voters in these counties and their racial/ethnic composition resulted in a noticeable effect on voters statewide. As demonstrated in Table 2, all voters saw automobile travel times increase under the one drop-off policy, but eligible Asian, Black, and Latinx voters experienced greater increases when compared with eligible white voters.
The impact of these differences extends beyond the potential for disenfranchisement. Black and Latinx people have shouldered a disproportionate share of Covid-19 health impacts (Mackey et al. 2020; Millett et al. 2020). Decreasing access to drop-off locations likely pushed more voters to take longer transit trips or to vote in person, each of which brought an elevated risk of exposure to the virus. Removing drop-off locations forced these at-risk populations to choose between exercising their right to vote and protecting their health.
Acknowledgments
The authors thank Seth LaRue for assistance with data preparation.