


1. Questions
The meteoric rise of Airbnb across cities since its introduction in 2008 has disrupted housing markets of major cities around the world including Sydney, Hong Kong, London, New York and Paris (Crommelin et al. 2018). While initial studies of Airbnb examined its links to tourism and the hotel industry (Guttentag 2015; Zervas, Proserpio, and Byers 2017), more recent research has looked at its impact on the housing market (Horn and Merante 2017; Barron, Kung, and Proserpio 2020; Franco and Santos 2021). These studies comprehensively demonstrate the increasing trend in rental and property prices that parallels increasing Airbnb activity. However, these studies have been asymmetrical. What happens when Airbnb activity decreases is relatively unstudied.
The COVID-19 pandemic presents a unique case study of this scenario. The revenue model of international tourism that Airbnb is founded on is under significant pressure with the halting of global travel. Resultingly, it is hypothesised that many of the long-term rentals that were converted to Airbnb’s will be back on the long-term market. We examine Sydney, a global tourist city with 4 million international visitors annually and a strong Airbnb presence of over 23,000 active listings. This study uses the case study of Sydney to ask:
-
How has Airbnb activity changed as a result of the COVID-19 pandemic, and what has the flow on effect been on rental activity?
-
Has a reduction in Airbnb activity effected rental prices?
2. Methods
This study analysed changes in Airbnb and rental activity in Greater Sydney from the second quarter (Apr – Jun) of 2019 and 2020. The NSW Lockdown came into effect on the 30th March 2020 and began easing on the 15th May 2020. Airbnb reservations during this period were refunded. The Airbnb data consisted of a comprehensive list of Airbnb listings in Australia from 2009 to present from AirDNA, containing information about the property type, price, reservations, host, and geolocation of each listing. The rental data was obtained from the Australian Property Monitors, comprising rental sales data monthly, including the property type and location. Finally, the total number of residencies in each postcode was obtained through the NSW Government ‘Property Valuer General’ dataset from 2019, containing the location of all NSW residential properties.
From this data, a measure was constructed to gauge the Airbnb activity in each postcode c for a chosen quarter t by finding the proportion of total residencies that were Airbnb listings:
AbbDensityct=AbbListingsctTotalResidenciesct
From this measure, each postcode was binned into deciles based on ranked in descending order of Airbnb density. The mean Airbnb Density for each decile is summarised in Table 1. Figure 1, visualising the geographic dispersion of the Airbnb activity deciles, illustrates that Airbnb activity is greatest in the city centre and the Eastern (Bondi) and Northern (Manly) beaches, while Sydney’s south and west are less active.

After splitting the postcodes into deciles, data analysis was conducted to examine how Airbnb and subsequently rental activity has changed in high and low Airbnb activity areas. The relationship between changes in Airbnb activity and changes to long term rental stock[1] (LTR) was examined to identify correlation between the two processes. The effect on the price of rental stock was then studied by comparing the changes to median rental prices prior to and following COVID-19 in active and inactive Airbnb neighbourhoods.
3. Findings
Changes from the second quarter of 2019 to 2020 in Airbnb activity, and subsequently LTR supply and prices, were analysed in relation to Airbnb activity. The Airbnb Deciles can be interpreted as a measure of Airbnb activity, with higher deciles indicating more activity, and vice versa for lower deciles.
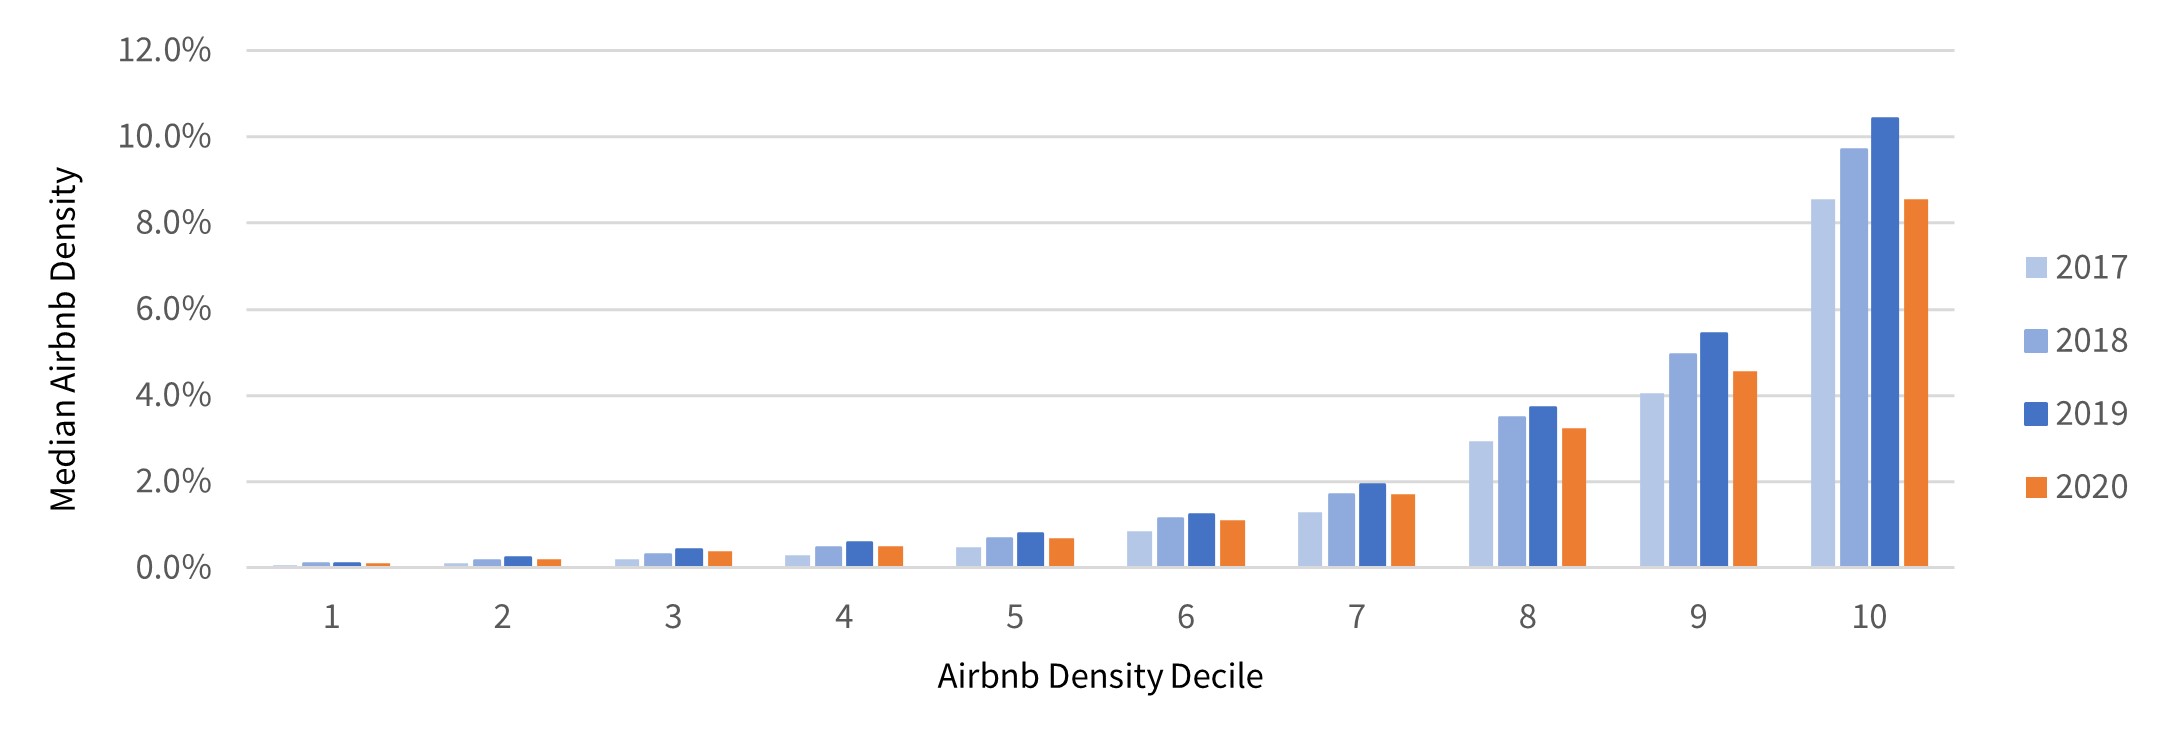
Figure 2(a) analyses changes to Airbnb activity levels to identify the impact of the COVID-19 pandemic on the total of Airbnb’s listings available across Sydney. The decline in Airbnb activity across all Sydney suburbs in 2020 since COVID-19 is evident, in contrary to the increasing trend observed for previous years. The decrease in Airbnb activity is greatest in the most active Airbnb neighbourhoods.
__annual_changes_(2017_q2__2020_q2)_in_airbnb_density_by_airbnb_decile.jpg)
Figure 2(b) and 2(c) compare the percentage change in LTR supply and prices in relation to Airbnb activity. The correlation between reduced Airbnb activity and increasing LTR supply is observable in Figure 2(b), which illustrates the increasing trend in LTR supply with Airbnb activity. Whereas low Airbnb activity areas have experienced a decline in LTR supply during the COVID-19 pandemic, supply for LTR has increased in active Airbnb neighbourhoods. It is theorised that the conversion of Airbnb’s back to LTR, motivated by the greater stability of LTR revenue in the absence of tourism, has driven the reduction in Airbnb listings observed. Hence, an increasing relationship between Airbnb decile and LTR supply is evident.
__boxplot_illustrating___change_(2019_q2__2020_q2)_to_ltr_supply_by_airbnb_decile.jpg)
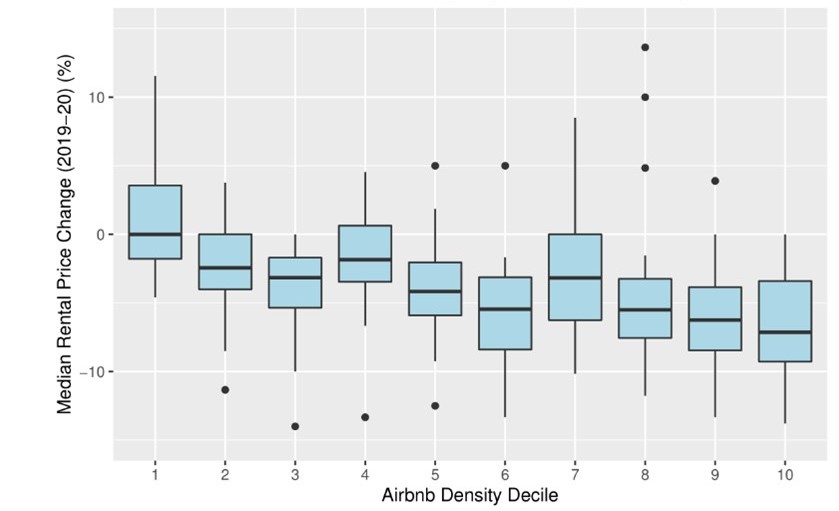
__boxplot_illustrating___change_(2019_q2__2020_q2)_to_ltr_prices_by_airbnb_decile.jpg)
Figure 2(c) identifies a clear decreasing trend in median LTR prices with Airbnb decile. LTR prices have remained relatively stable for low Airbnb activity areas, however prices have declined significantly in the most active Airbnb neighbourhoods (7.1% on average in Airbnb Decile 10). This can be explained by the inverse relationship between rental supply and rental prices (DiPasquale and Wheaton 1992).
The distribution of median rental price changes during the COVID-19 pandemic is illustrated in Figure 3. Rental prices have declined the most in the CBD and Eastern and Northern beaches, whereas rental prices in Sydney’s south and west have remained relatively stable. When compared to Figure 1, there is a clear spatial relationship between high Airbnb activity areas and declining rental prices experienced during the COVID-19 pandemic.
_of_sydney_postcodes.jpg)
In aggregate, these findings present a clear associated impact of declining Airbnb activity and a reduction in rental prices. Whereas previous studies have looked at the effect of increased Airbnb activity on the housing market, this study presents evidence to the symmetrical nature of the Airbnb effect. Future work could look at applying this methodology to other cities to understand if this is a global trend or localised to the Sydney housing market. The implication for policymakers is that the impact of increasing Airbnb activity on housing markets can be potentially reversed, presenting an important consideration in the context of housing affordability which is a challenge facing many global cities. However, while the suspension of global travel due to COVID-19 is foreseeably temporary, the travel landscape has likely forever changed, with predictions of a shift towards smaller cities and domestic tourism (Abril 2021). This implies that the Airbnb effect may not be reversed, merely shifted to new tourist locations. Further studies could examine the implications of intensified domestic tourism on rental stock and housing affordability in coastal and regional tourist hotspots.
Acknowledgment
The authors disclose receipt of the following financial support for the research and authorship of this article: This work has been supported by FrontierSI, a not-for-profit company that exists to deliver major benefits to governments, industry and the community in Australia and New Zealand through the application of spatial information. This research was funded through the Cooperative Research Centre Project – Value Australia.
Long Term Rental stock defined as rental accommodation which has a tenancy agreement of at least 3 months (NSW Government Fair Trading 2020).