
1. Questions
Millennials are increasingly moving from suburbs to higher-density urban centers, a trend attributed to their preference for more ecologically sustainable and livelier settings (Myers 2016). Whether this trend will make this generation happier, however, is unclear. The built environment has been found to influence both subjective well-being (SWB) and mental health (Veenhoven 2002; Galea et al. 2005). Poor-quality urban environments, with deteriorating infrastructure and unkept streets and sidewalks, have been associated with increased odds of experiencing depression, and it has been posited that densely populated areas may amplify stressors (Galea et al. 2005; Eaton 1980). There are indirect and direct pathways through which population density may affect well-being. Direct negative pathways between density and well-being include nuisances such as noise and traffic, while there might be some positive indirect pathways, such as higher social cohesion (O’Campo, Salmon, and Burke 2009).
Overall, evidence linking population density to SWB is ambiguous. While most research in the United States finds a negative relationship between density and happiness, a recent study suggested much of this density-SWB gradient can be attributed to a country-specific racial divide between urban and rural areas (Winters and Li 2016; Florida, Mellander, and Rentfrow 2011; Berry and Okulicz-Kozaryn 2011). Meanwhile, evidence in the European context is ambiguous, with recent studies showing nonsignificant associations between population density and happiness (Cramer, Torgersen, and Kringlen 2004; Mouratidis 2019). A previous study in the Canadian context found differences in SWB across metropolitan regions, but it did not delve into variation within cities and how these related to the built environment (Lu et al. 2015).
This study analyzes the results of a bilingual survey distributed to residents of the Montreal, Quebec, region between October 2019 and January 2020 to assess the relationship between happiness and population density. Happiness was measured through responses to questions on SWB, quality of life (QOL) and health perceptions.
2. Methods
Between October 2019 and January 2020, a bilingual (French and English) online survey was carried out to assess various aspects of the Réseau Express Métropolitain (REM) light-rail project, as well as to collect data on relevant characteristics of the Montreal population. Recruitment was carried out in-person and digitally and resulted in 4,148 completed responses. This study was approved by McGill University’s Research Ethics Board. After a data-cleaning process that considered response times and whether answers to some key questions, such as age, were within a reasonable range, 465 responses were excluded, resulting in a sample size of 3,683 responses. This sample of anonymized data included information on home location, which allowed the survey to be complemented by data from the 2016 census. Census data included population density calculated at the census tract level. Montreal, the second largest metropolitan area in Canada, has an average population density of 4,517 people per square kilometer.
The observed dependent variables were evaluated through the following three questions measuring SWB, QOL, and perceived health respectively: “[T]hinking about your own life and personal circumstances, how satisfied are you with your life as a whole?”; “[H]ow satisfied are you with your standard of living?” and “[H]ow satisfied are you with your health?” Responses ranged from “0 - completely dissatisfied” to “10 – completely satisfied”. Figure 1 depicts the distribution of answers for all three questions, as well as the average population density value for each response level.
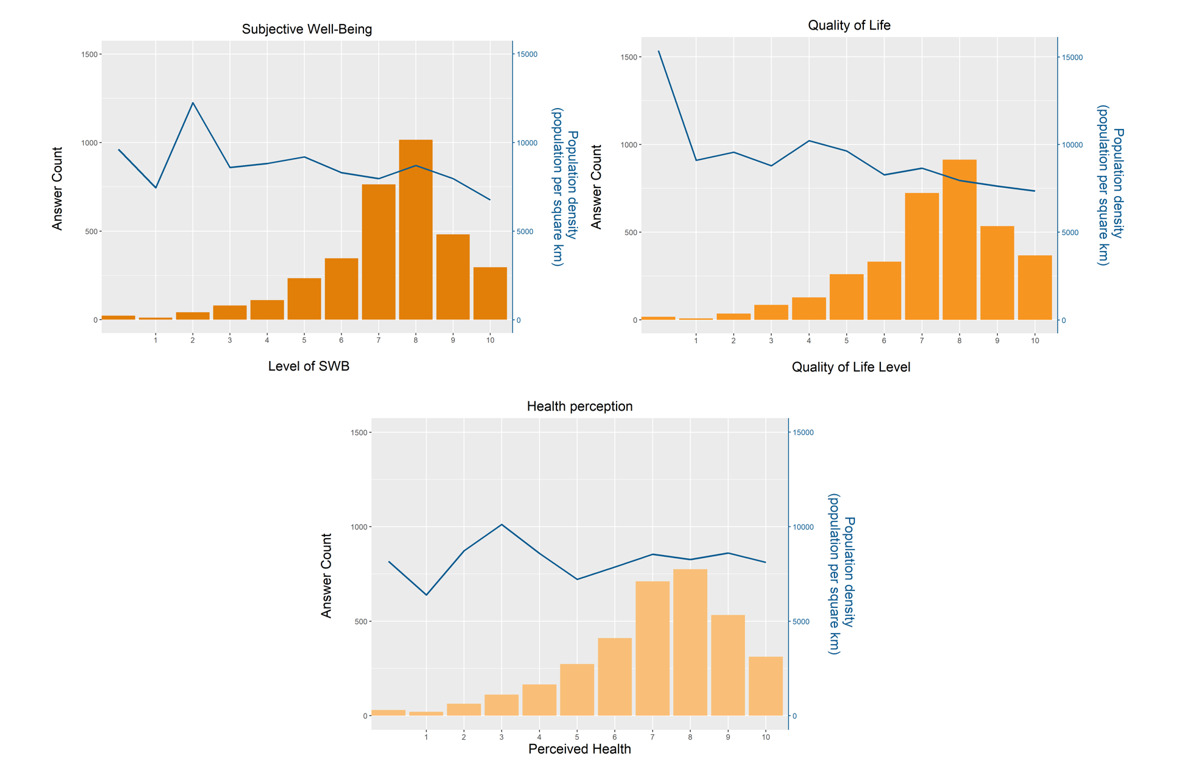
At first glance, lower SWB and QOL grades seem to correspond with higher population densities, but the relationship does not appear to be strong. Since the three indicators were measured with ordinal and discrete scales, a cumulative logit model was found most suitable to assess the relationship between variables. This model was run with the “clm” function of the "ordinal" package in R. Several individual characteristics have been found to play a central role in SWB, and as such were included as control variables (Dolan, Peasgood, and White 2008). These included age, educational attainment, relationship status, gender, and sufficiency of income. For sufficiency of income, survey respondents were asked “[T]o what extent does this annual household income allow you to satisfy your household needs?” The Likert-scale responses were recoded into a binary variable for “insufficient income.”
Health and happiness have been found to have a bi-directional relationship, and correspondingly health status was used as a control variable for subjective wellbeing and quality of life (Veenhoven 2008). To account for self-selection effects, we considered stated reasons for home location choice. Since it has been found that access to walkable green spaces improves health and longevity, proximity to parks was included as one of these variables (Takano, Nakamura, and Watanabe 2002). An additional variable for dwelling type, represented by a binary variable for single-family house, was considered for subjective well-being but was excluded from regressions for quality of life and health perception because it was not statistically significant and reduced the model’s accuracy beyond an acceptable threshold. Furthermore, the variables for population density and insufficient income were found in certain cases to violate the proportional odds assumption, also known as the equal slopes assumption. We addressed this by using clm’s nominal effects parameter to calculate their partial proportional odds, allowing threshold parameters to vary based on the regression variables.
3. Findings
Table 1 shows the results of the three regressions. For the regression coefficients, positive values indicate an increased likelihood of a higher assessment of the dependent variable. In line with findings from other studies carried out in North America, higher population densities were found to correlate with slightly lower assessments of QOL all else being equal (Morris 2019). However, this effect was not found for SWB or perceived health, where the correlation was not generally statistically significant and the direction of effect varied across different response levels.
Factors considered during home location selection were found to correlate with happiness in a statistically significant way. For instance, individuals considering the walking environment of potential homes reported measurably higher SWB, QOL, and perceived health levels. Those prioritizing proximity to green areas in the selection of their home location had higher SWB levels. Other home characteristics, such as home size, proximity to shops and dwelling type, did not have a statistical effect on any of the measured dependent variables. In terms of individual characteristics and their effect on SWB, most findings were consistent with existing literature.
In synthesis, individual characteristics, such as income and relationship status, remain the main explanatory variables for SWB and QOL levels. In terms of built-environment features, results suggest that higher population density does not have a statistically significant effect on SWB or perceived health levels. While quality of life is higher in lower-density areas, the effect appears to be small. Further research should delve into other characteristics of the built environment, including changes in available amenities over time, to understand their influence on subjective wellbeing. Overall, these results are encouraging for those policy makers pushing for compact urban development in North America. Happiness and ecologically sustainable living need not be exclusive.
Acknowledgement
This research was funded by The Canadian Institutes of Health Research (CIHR) and The Natural Sciences and Engineering Research Council of Canada (NSERC) Collaborative Health Research Projects (CHRP) Program (Project numbers CIHR CPG-170602 and CPG-170602 X- 253156, NSERC CHRPJ 549576-20). The authors would like to thank Rania Wasfi and Boer Cui for her help in designing the survey.