
1. Questions
Cities and countries across the world have implemented new active travel infrastructure as part of Covid-19 responses. In London, 72[1] Low Traffic Neighbourhoods (LTNs) were built in March-September 2020, covering around 300,000 people (4% of London’s population) (Aldred et al., n.d.). LTNs use ‘modal filters’[2] to restrict through motor traffic in residential areas, creating areas where all homes can be reached by car but where it is difficult or impossible for drivers to cut through from one side of the area to the other. The aim is to discourage driving and simultaneously to create safer and more pleasant cycling and walking environments. An example of an LTN is provided in Figure 1.
The London Borough of Waltham Forest introduced several LTNs between 2015 and 2019. These were associated with a reduction in street crime, particularly more serious crimes, with no displacement to surrounding areas (Goodman and Aldred 2021). Concerns have been raised, however, that the 2020 LTNs may be associated with less positive outcomes, because these generally lacked the complementary measures (e.g. improved lighting or public realm improvements) that featured in some Waltham Forest LTNs.[3] In addition, some local and national media coverage of LTNs has continued to raise the possibility that reducing levels of on-street motor traffic could make pedestrians more vulnerable to crime.
In this paper we therefore examine the short-term association between the 2020 LTNs and street crime.
2. Methods
We compared October 2020 to February 2021 to the corresponding months in 2018/19 and 2019/20. During these 15 months, the London Metropolitan Police and City of London Police recorded 1,346,187 street crimes in London and assigned each to a Lower Super Output Area (LSOA).[4] We excluded 140,404 street crimes in 139 LSOAs in Central London, as crime rates have fallen substantially in this area because there has been a large decrease in footfall.[5] We also excluded 39,540 crimes in 20 LSOAs in Inner and Outer London which were outliers in terms of a) having unusually high crime rates (average >100/month) in 2018/19 and 2019/20 and b) having seen a large decrease in crime (at least 25% decrease) in 2020/21 relative to the previous two years.[6] This left a sample of 1,166,243 crimes in 4,672 LSOAS in Inner and Outer London.
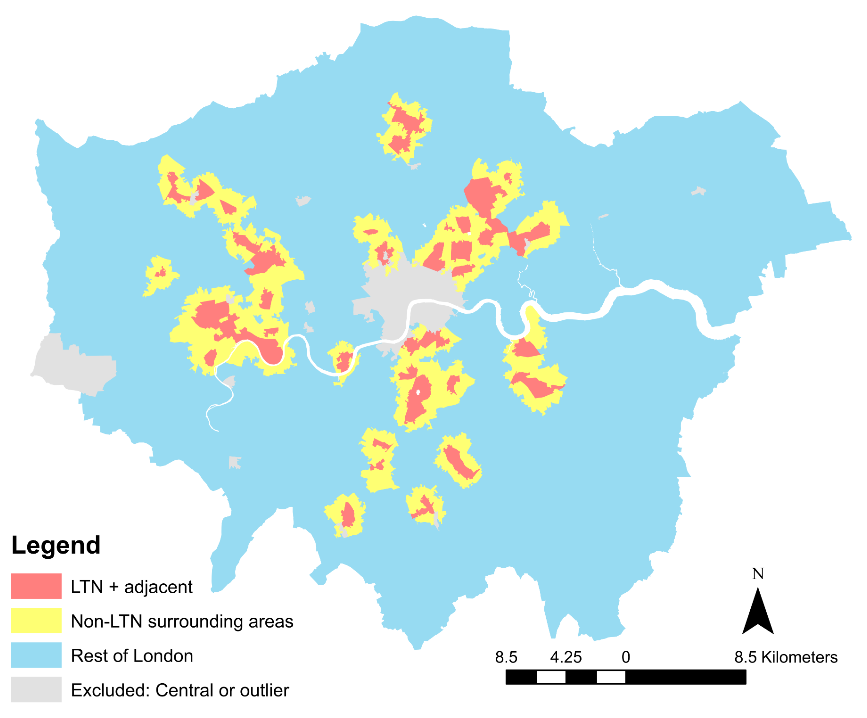
We used information from a range of official sources to map all new modal filters implemented from March-September 2020 in London and still in place at the end of October 2020.[7] Based on these we manually mapped LTNs (details in Aldred et al., n.d.). For this analysis we identified whether each LSOA was partially or wholly inside a 2020 LTN (group A: see Figure 2). We also identified two overlapping comparison groups: (B) LSOAs that did not intersect with an LTN but were in a surrounding area with a boundary <500m from a 2020 LTN, or (C) LSOAs that did not intersect with an LTN and were anywhere in London. For each of the three groups, we compared outcomes between October-February 2018/19+19/20 (pooled) versus October-February 2020/21. We present significance testing comparing LTN areas (A) to the surrounding areas (B) and to the rest of London (C), using chi-squared tests. Note that these three groups were similar in the number of non-local workers relative to the local residential population, providing some reassurance that crime levels would be similarly affected by increased working from home and lockdowns during 2020/21 (see Supplemental Information).
Our primary outcome was the total number of street crimes excluding antisocial behaviour. We chose a priori to examine antisocial behaviour separately because the nature of the crime expanded during the pandemic to include instances of breaking Covid-19 social distancing or lockdown rules. As a secondary outcome we examined the subcategories of crime involving direct attacks against the person, defined as: Violent and Sexual Offences; Robbery; and Public Order and Possession of Weapons. We selected this outcome as capturing types of street crime that may be directed against pedestrians, and that correspond to the concerns most often raised around safety in LTNs.
3. Findings
In Inner and Outer London as a whole, total street crime excluding antisocial behaviour fell by 12% and direct attacks on the person fell by 4%, in October-February 2020/21 relative to the same period in the previous two years. Antisocial behaviour increased by 82%, potentially driven by enforcement of Covid-19 restrictions.
In Inner London, total street crime excluding antisocial behaviour fell by 17% in LTN areas. This showed a trend towards being slightly greater than the decrease observed in the surrounding areas (-15%, p=0.08 for difference) and was also somewhat greater than the decrease in the rest of Inner London (-13%, p<0.001 for difference: see Table 1). For direct attacks against the person, LTN areas were very similar to the surrounding areas (10.3% vs 10.5% declines, p=0.90) and had a somewhat more favourable change than the rest of Inner London (10% vs 6%, p=0.02). Antisocial behaviour showed a similar increase in LTNs versus the rest of Inner London, and a trend towards a slightly greater increase in LTNs than in the surrounding areas. In sensitivity analyses based on the change in the median LSOA, Inner London LTNs were generally similar to the surrounding areas and the rest of London (see Supplemental Information).
In Outer London, total street crime excluding antisocial behaviour fell by 17% in LTN areas, which was greater than the decrease observed in the surrounding areas (-10%, p<0.001 for difference) or the rest of Outer London (-11%, p<0.001 for difference: see Table 2). Direct attacks against the person fell by 8% in LTN areas, whereas they remained unchanged in the surrounding areas and decreased by only 2% in the rest of Outer London. Antisocial behaviour increased to a similar degree in LTNs and in surrounding areas, and increased somewhat less in LTNs than in the rest of Outer London. Similar trends were seen in sensitivity analyses based on the change in the median LSOA (see Supplemental Information).
Areas surrounding LTNs always showed trends more favourable than, or not statistically significantly different from, than the rest of London. There was thus no indication of crime displacement.
In Outer London, the magnitude of the short-term association between LTNs implementation and total street crime is broadly comparable to the 5% relative reduction observed in the first year of Waltham Forest’s LTNs (Goodman and Aldred 2021). The magnitude of the association in Inner London appears to be smaller: it would be valuable to examine why this may be the case if this pattern continues in future follow-up.
In interpreting our findings regarding changes in the total number of direct attacks against the person, it is important to note that the evidence from existing LTNs and the emerging evidence from 2020 LTNs indicates a large increase in walking among LTN residents (Aldred and Goodman 2021). As such, our results may be underestimating LTN benefits when considered in terms of the risk of direct attack per pedestrian.
In summary, numbers of reported crimes in and around new 2020 LTNs have shown changes similar to or more favourable than the wider background trend. Street crime patterns have, however, been substantially perturbed by the pandemic. This means that these analyses of mid-pandemic crime data should be treated with some caution, and that further analysis is warranted once Covid-19 restrictions ease.

_intervention_and_comparison_groups_used_in_our_ana.png)
ACKNOWLEDGEMENTS
AL is funded by National Institute of Health Research (NIHR) School for Public Health Research.
CONFLICT OF INTEREST STATEMENT
Some of these LTNs were funded by the Department for Transport (DfT) via the Active Travel Fund. AG and RA have been awarded DfT funding to evaluate the Active Travel Fund programme as a whole, although this study does not form part of that work. DfT had no input into this article.
This number is calculated based on the number of differently named LTNs across London during this time. It is possible that different methods of counting might come up with a slightly different total number (e.g. some named LTNs might have two segments which could be counted as two separate adjoining LTNs).
A ‘modal filter’ is a bollard, camera gate, planter, or other street feature that restricts motor traffic fully or partially (the latter might involve a camera-controlled bus gate). They are intended to reduce through motor traffic on a neighbourhood’s streets. Pedestrians and cyclists can proceed unrestricted through the modal filter.
In particular, the first Waltham Forest LTN was accompanied by an upgrade to the local street lighting. Improved street lighting does not, however, seem to have been the main mechanism for the observed decrease in crime across the Waltham Forest LTN programme (see Supplemental Information).
Police data available from https://data.police.uk/data/. LSOAs are Census administrative areas designed to contain around 1500 inhabitants each. Crime data are available below the LSOA level mapped to anonymous map points, but analysis of these is currently complicated by marked shifts in crime rates at the micro-level due to the Covid-related social distancing restrictions and lockdowns. These impacts are differential across small spatial scales, impacted by specific closures of local businesses. This creates issues in identification of comparable areas using precise point data. We therefore instead chose this slightly larger Census geography, which averages results out at the micro-level. Our ‘LTN areas’ in this paper therefore represent roads inside or near to LTNs.
Central London defined as the ‘Central Activities Zone’, available at https://data.london.gov.uk/dataset/central_activities_zone . Central London does include some LTNs, and crime in these LTN areas fell more than in the rest of Central London. However, this was driven by the fact that some Central London LTNs are ‘dining streets’ located in non-residential entertainment hotspots like Soho and Leicester Square that have seen a very large decrease in footfall. Our judgement is that footfall has changed so much in Central London that it dwarfs any plausible impact of the LTNs. We have therefore chosen to focus on Inner and Outer London, where residential areas are dominant.
Manual inspection indicated that these corresponded to LSOAs including transport, shopping or entertainment hubs, e.g. Heathrow airport or Westfield shopping centre. These are places that, like Central London, were formerly subject to high levels of street crime, but have had a large decrease in footfall during the pandemic.
One LTN in Lewisham, was modified in November 2020 to allow some through traffic on some roads. In February 2021, further changes were made to a range of LTNs, including modal filters being temporarily removed in Croydon and permanently removed in Sutton. Our findings were very similar in sensitivity analyses excluding these LTNs, or in analyses restricted to the months October–January. Only around 15 new LTNs were introduced in London October 2020 – February 2021, compared to 72 in our study sample.