1. Questions
COVID-19 cases, hospitalizations, and deaths have been disproportionately high among racial and ethnic minorities and older age groups in the United States (CDC 2021a), spotlighting layers of enduring and well-documented health disparities driven by adverse social determinants of health (CDC 2021b). Uneven COVID-19 vaccination rates reflect these inequities; minority individuals have been vaccinated at much lower rates than others in the early months of the vaccine rollout (Ndugga et al. 2021). There are many recognized barriers to health care access in the US, including socioeconomic constraints, health literacy limitations, and a lack of reliable transportation to health-promoting institutions like medical facilities and pharmacies (Wolfe, McDonald, and Holmes 2020). Communities of color and older adults—those over age 65—are some of the populations most affected by transportation barriers to health care (Syed, Gerber, and Sharp 2013).
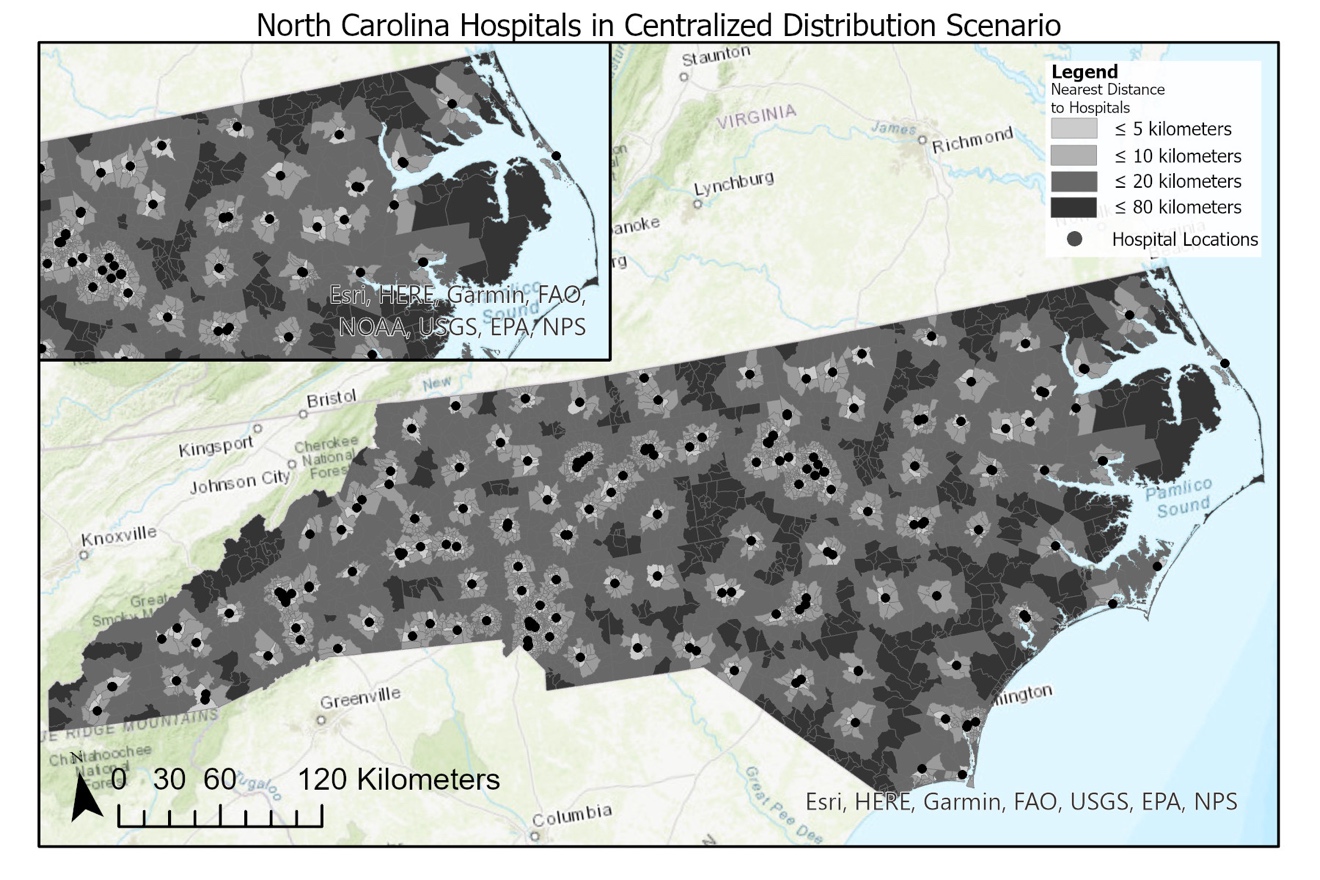
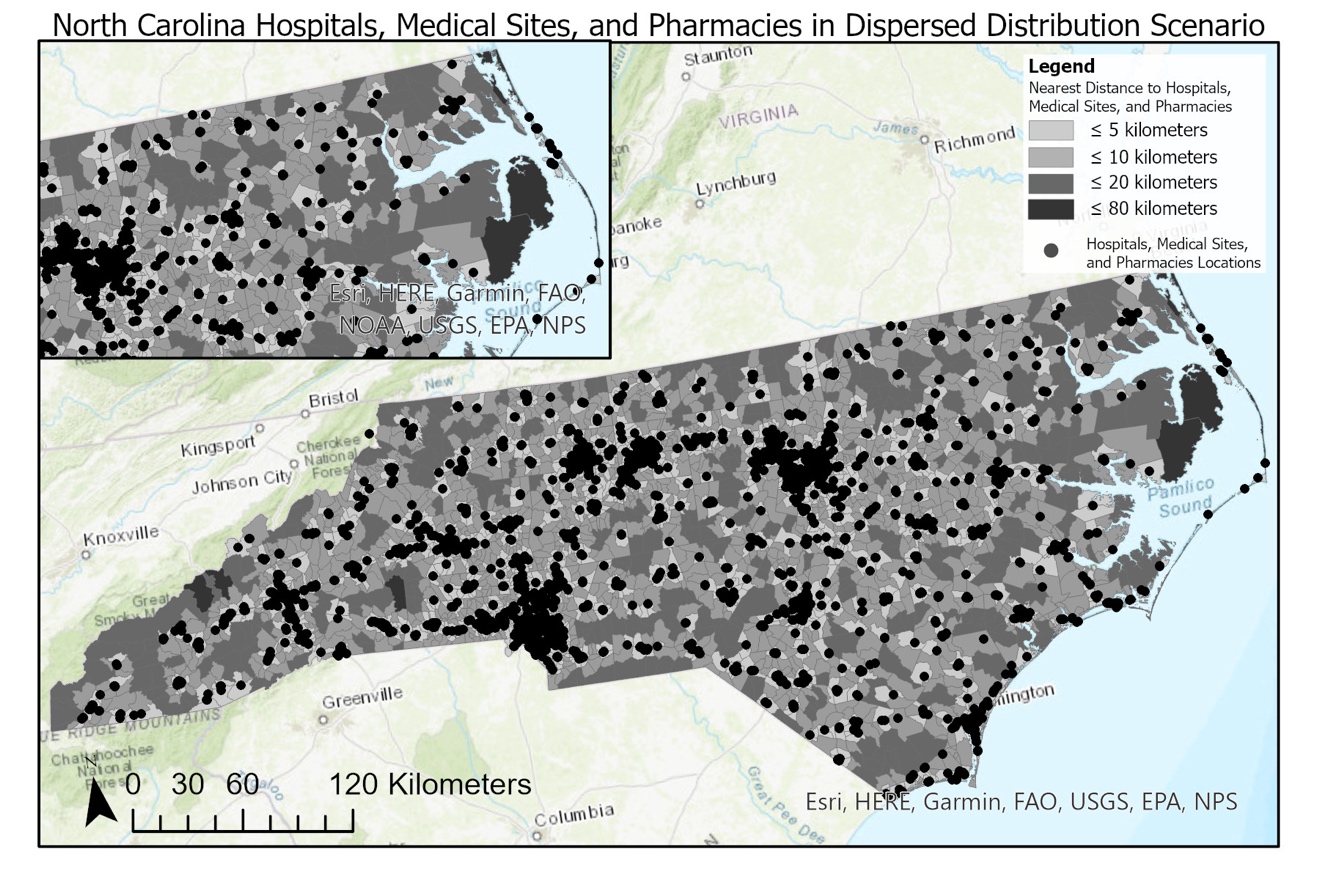
Living near vaccination sites can reduce transportation barriers to getting the COVID-19 vaccine by lowering associated travel time and money costs. Our paper tests how geographic proximity to the vaccine varies across demographic groups when vaccines are distributed in a centralized scenario—only at hospitals, which are most likely to house specialized infrastructure, such as ultra-cold freezers, to store and administer vaccines (Goldhill 2020), and in a dispersed scenario—with the vaccine available at hospitals, medical sites (i.e., community health centers and rural health clinics), and pharmacies.
2. Methods
Our spatial analysis used point data representing locations which might serve as potential vaccination sites in North Carolina. Specifically, we sourced information on the location of hospitals, community health centers, and rural health clinics from Centers for Medicare & Medicaid Services (CMS 2021), and the locations of pharmacies using points-of-interest data from SafeGraph (SafeGraph 2020). All demographic data were derived from 2019 American Community Survey 5-year estimates (US Census Bureau 2021).
We calculated the average distance to potential vaccination sites for the state’s total population and for select demographic groups in centralized and dispersed distribution scenarios. We weighted distances to examine averages for the total population and demographic groups by multiplying the proportion of the state population belonging to these groups and residing in each block group by the block group’s distance to the nearest potential vaccination site (calculated using the Euclidean distance between the block group’s centroid and the nearest site). We summed these weighted distances for all block groups to calculate average distances.
Using data on COVID-19 incidence collected at the county level by the North Carolina Department of Health and Human Services (NCDHHS 2021), we also briefly report results regarding how incidence of COVID-19 in northeastern North Carolina may be associated with access to potential vaccination sites.
3. Findings
3.1. Proximity-Based Access Analysis
In the centralized distribution scenario (Table 1, column 1; Figure 1) we find that, on average, North Carolina residents live 8.93 kilometers (km) from the nearest hospital. In the dispersed distribution scenario (Table 1, column 2; Figure 2), we find that the average distance for the total population to the closest hospital, community health center, rural health clinic, or pharmacy is 3.36 km.
American Indians, non-Hispanic Whites, people age 45 and over, and adults without college degrees live farther than average from potential vaccination sites. Distances are particularly great for American Indians, who live 3.27 km farther from hospitals in the centralized distribution scenario and 1.40 km farther from all potential vaccination sites in the dispersed distribution scenario. While American Indians make up a relatively small percentage of the state’s total population, this group has had more COVID cases per capita than Black and White North Carolinians (Pulliam 2021). We observe relatively little variation in average distance from potential vaccination sites compared to the total population for females, children, and individuals living in households with annual incomes less than $100,000. Adults under age 45, non-Hispanic Blacks, Hispanic people, individuals living in households with annual incomes greater than $100,000, and adults with bachelor’s degrees live closer to potential vaccination sites in both distribution scenarios. We find that zero-vehicle households are located 1.74 km and 0.74 km closer, respectively, to potential vaccination sites in the centralized and dispersed distribution scenarios.
In comparing the two distribution scenarios, the difference between average distances to the nearest potential vaccination site represents the “proximity gain” that different groups experience in the dispersed scenario (Table 1, column 3). Relative to the average change in distance to the nearest potential vaccination site observed for the total population (5.58 km), the difference is 1.33 times larger for American Indians (7.44 km) and between 1.02 and 1.05 times larger for non-Hispanic Whites (5.84 km), people age 45 and over (5.75 km), and adults without college degrees (5.76 km). While members of these groups still tend to live farther from potential vaccination sites in both scenarios, sites are significantly closer for them when expanding to a dispersed distribution scenario.


3.2. Multiple Vulnerability Factors and the COVID-19 Vaccine Rollout
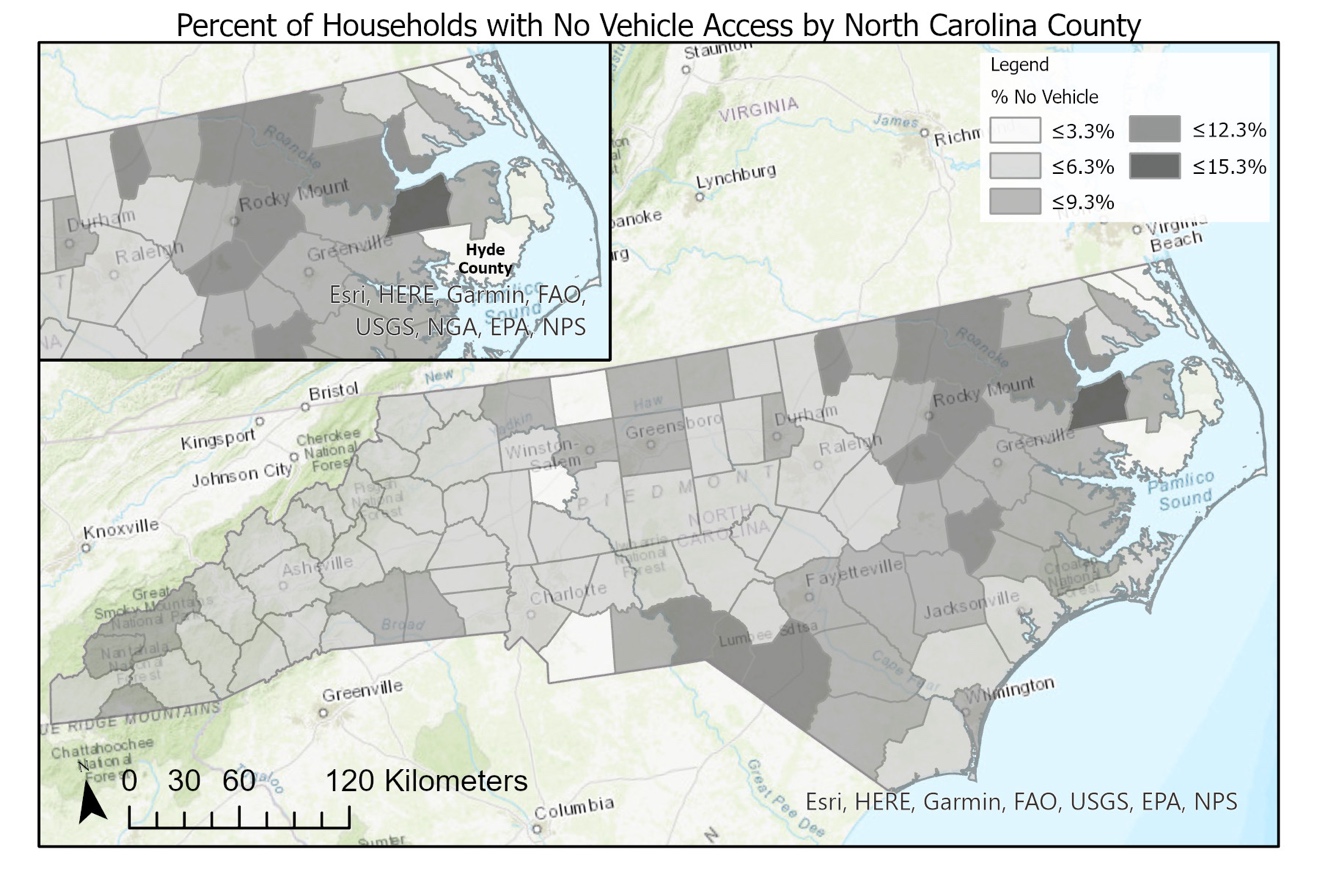
As of February 18, 2021, Hyde County, located in northeastern North Carolina, had the highest number of total COVID-19 cases per capita in the state (1,246 cases per 10,000 residents) (NCDHHS 2021). In Figure 3, we see that Hyde’s surrounding counties have relatively large proportions of zero-vehicle households. We see in Figures 1 and 2 that some block groups in and around Hyde County are located relatively far from potential vaccination sties.
Ensuring equitable vaccine distribution demands considering the multiple vulnerability factors, including socioeconomic disadvantage, transportation disadvantage, and COVID susceptibility, which might disproportionately affect particular demographic groups. Methods used in this paper to identify groups that live farther from potential vaccination sites should be applied elsewhere to understand communities with less proximity-based access to the vaccine. Combined with knowledge of geographies where car access is low and COVID incidence is high, such understanding can inform those involved in the vaccine rollout about how to equitably target resources to address transportation barriers and connect people to the vaccine.
.jpeg)
Acknowledgements
We thank Kai Monast and two anonymous reviewers for their helpful comments. This work was sponsored by a contract from the Southeastern Transportation Research, Innovation, Development and Education Center (STRIDE), a Regional University Transportation Center sponsored by a grant from the US Department of Transportation’s University Transportation Centers Program.