Loading [Contrib]/a11y/accessibility-menu.js
Skip to main content
null
Findings
  • Menu
  • Articles
    • Energy Findings
    • Resilience Findings
    • Safety Findings
    • Transport Findings
    • Urban Findings
    • All
  • For Authors
  • Editorial Board
  • About
  • Blog
  • covid-19
  • search

RSS Feed

Enter the URL below into your favorite RSS reader.

http://localhost:54963/feed
Transport Findings
April 29, 2021 AEST

Accounting for Spatial Heterogeneity Using Crowdsourced Data

Mohammad Anwar Alattar, Caitlin Cottrill, Mark Beecroft,
spatial modellingcyclingactive travelcrowdsourcedosmnxstrava
Copyright Logoccby-sa-4.0 • https://doi.org/10.32866/001c.22495
Photo by Julie Adams on Unsplash
Findings
Alattar, Mohammad Anwar, Caitlin Cottrill, and Mark Beecroft. 2021. “Accounting for Spatial Heterogeneity Using Crowdsourced Data.” Findings, April. https:/​/​doi.org/​10.32866/​001c.22495.
Save article as...▾
Download all (4)
  • Table 1. Summary of Street Network Centralities.
    Download
  • Figure 1. Queen Contiguity.
    Download
  • Figure 2. Moran scatter plot. logACT denotes the logarithm of the number of cycling trips.
    Download
  • Supplementary Information
    Download

Sorry, something went wrong. Please try again.

If this problem reoccurs, please contact Scholastica Support

Error message:

undefined

View more stats

Abstract

Given the numerous benefits of active travel (human-powered transportation), in this paper, we argue that using crowdsourced data and a spatial heterogeneity treatment enhances the predictive performance of data modelling. Using such an approach thus increases the amount of insight that can be obtained to improve active travel decision-making. In particular, we model cyclists’ route choices using data on cycling trips and street network centralities obtained from Strava and OSMnx, respectively. It was found that: i) the number of cyclist trips is spatially clustered; and ii) the spatial error model exhibits a better predictive performance than spatial lag and ordinary least squares models. The results demonstrate the ability of the fine-grained resolution of crowdsourced data to provide more insights on active travel compared to traditional data.

Questions

Human-powered transportation such as walking, cycling and using a wheelchair (known as active travel [AT]) is associated with numerous benefits, such as improving physical and mental well-being. Additionally, AT has demonstrated resilience throughout the COVID-19 pandemic (Teixeira and Lopes 2020). Spatial dependence has been demonstrated for walking (Wei et al. 2016), as well as bicycle and pedestrian injury counts (Narayanamoorthy, Paleti, and Bhat 2013; P. Chen and Shen 2016). We believe cycling is no exception, thus accounting for spatial heterogeneity is essential to improve the cycling model interpretation.

Previous AT-related studies have primarily employed traditional data sources such as cordon counts and non-spatial regression model techniques such as the Poisson (Hong, McArthur, and Livingston 2020; C. Chen et al. 2020), mixed logit (Kang and Fricker 2013; Lind, Honey-Rosés, and Corbera 2020), negative binomial (NB) (C. Chen et al. 2020; Raihan et al. 2019) and ordinary least squares (OLS) (Hong, McArthur, and Stewart 2020; Boss et al. 2018) models. However, the ubiquity of information and communications technology has enabled users to generate data that include the three Vs (volume, velocity and variety) as well as fine spatial granularity, denoted as crowdsourced datasets (Ali et al. 2016). This type of data can incorporate the spatial component of AT, which has previously been deemed as inadequate in studies using traditional data sources.

Building on previous work where we spatially modelled cyclists’ route choices in the City of Glasgow (Alattar, Cottrill, and Beecroft 2021), here we aim to identify the contribution of crowdsourced datasets to improve data modeling performance via the following objectives:

  1. To examine the spatial dependence of cycling within the study area; and

  2. to compare three regressive models, namely, the OLS, spatial lag model (SLM) and spatial error model (SEM).

Methods

We employ two types of crowdsourced datasets in this work: i) the Strava 2018 dataset, containing the number of cycling trips on each street intersection (CCT), which is obtained from Strava app users who record, track and share their physical activities; and ii) a dataset generated using the python toolkit OSMnx to obtain the Glasgow street network from the collaborative worldwide mapping project OpenStreetMap (Boeing 2017). Moreover, street network centralities (degree [DC], betweenness [BC], closeness [CC], and eigenvector [EC]) are quantified, as explained in Table 1.

Table 1
Table 1.Summary of Street Network Centralities.

Source: Alattar, Cottrill, and Beecroft (2021).

The QGIS NNJoin plugin (version 3.4.14-Madeira) was used to prepare the data, allowing for the integration of CCT with the street network centralities. The variables were then logarithmically transformed with GeoDa (version 1.14.0) to reduce data skewness. Thiessen polygons were created around each Strava intersection point to determine neighboring intersections using Queen’s contiguity matrix. Thiessen polygons define the boundary of each intersection by allocating the surrounding location to the closet intersection (Yamada 2016). Figure 1 presents the results of such an exercise, where the neighboring intersections for each intersection are defined based on the shared corners and edges of the Thiessen polygons.

Figure 1
Figure 1.Queen Contiguity.

Source: Alattar, Cottrill, and Beecroft (2021).

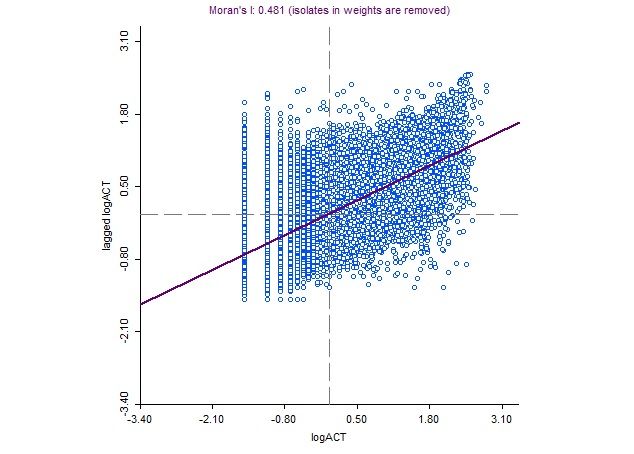
We assess the spatial dependence of cycling using Univariate Moran’s I analysis, where values close to +1 (-1) indicate 100% spatial clustering (dispersion) and values close to 0 indicate spatial independence. We then implement the OLS model by setting CCT as the dependent variable and the street network centralities as the independent variables. We perform multicollinearity analysis and residual diagnostics for heteroskedasticity and spatial dependence to examine the adequacy of OLS. This is followed by the implementation of SLM and SEM to incorporate lag coefficients. More specifically, the SLM lag coefficient (ρ) is introduced by the dependent variable spatial dependence while the SEM lag coefficient (λ) is introduced by the residuals’ spatial dependence. All analyses were conducted using GeoDa, with the exception of the variance inflation factor (VIF), which was calculated using R.

Findings

Cycling is observed to be significantly spatially autocorrelated (Moran’s I = 0.481, P-value < 0.05), whereby locations with a high (or low) number of cycling trips tend to cluster. Figure 2 presents the logarithm of the number of cycling trips.The following underlying factors may influence this spatial variation: i) proximity to cycling infrastructure and amenities, which encourage individuals to cycle (Lee, Won, and Ko 2015); ii) area affluence, for example Glasgow cycling propensity is more pronounced in affluent populations (Muirie 2017); and iii) safety, where Jacobsen (2015) referred to “safety-in-numbers”, a term encompassing the inclination of cyclists to cycle (as they feel safer) in places where cycling is prevalent.

Figure 2
Figure 2.Moran scatter plot. logACT denotes the logarithm of the number of cycling trips.

The mean of VIF was 1.06, indicating the absence of multicollinearity among the independent variables (no excessive redundancy). Table 2 reports the results of OLS, SLM and SEM for 12,354 observations, with LogCCT as the dependent variable and the logarithm of the street network centralities as the independent variables. OLS determined a significant weak positive correlation between LogCCT and the independent variables. However, the presence of residual heteroskedasticity and spatial dependence violate two key assumption of OLS. In particular, OLS assumes homoskedasticity (as opposed to heteroskedasticity), which occurs when there is a constant error term variance. The significance of both Breusch-Pagan and Koenker-Bassett tests indicate heteroskedasticity (Rosenthal 2017). Furthermore, OLS assumes the spatial independence of the residuals, which according to Moran’s I and the Lagrange Multiplier, is found to be statistically significant (Anselin 2013). These violations suggest the inadequacy of OLS, and the need to instead fit spatial models.

Table 2.OLS, SLM and SEM results.
OLS (R2 = 0.165, LogL = -12909.8, AIC = 25829.7, SC = 2586.8)
Variable Coefficient Standard Error t-Statistic P-Value
Constant 3.132 0.284 11.017 < 0.001
LogDC -0.497 0.059 -8.325 < 0.001
LogEC 0.018 0.001 11.309 < 0.001
LogCC 1.052 0.090 11.648 < 0.001
LogBC 0.311 0.007 41.440 < 0.001
Residuals Diagnostics
Heteroskedasticity Test DF Value P-Value
Breusch-Pagan 4 248.308 < 0.001
Koenker-Bassett 4 321.329 < 0.001
Spatial Dependence Test MI/DF Value P-value
Moran's I (error) 0.442 63.003 < 0.001
LM (lag) 1 3510.905 < 0.001
Robust LM (lag) 1 45.251 < 0.001
LM (error) 1 3961.258 < 0.001
Robust LM (error) 1 495.604 < 0.001
LM (SARMA) 2 4006.509 < 0.001
SLM (R2 = 0.408, LogL = -11274.4, AIC = 22560.8, SC = 22,605.4)
Variable Coefficient Standard Error z-Value P-Value
ρ 0.488 0.007 63.825 < 0.001
Constant 1.835 0.240 7.623 < 0.001
LogDC - 0.191 0.050 -3.813 < 0.001
LogEC 0.008 0.001 6.008 < 0.001
LogCC 0.389 0.076 5.085 < 0.001
LogBC 0.240 0.006 36.950 < 0.001
SEM (R2 = 0.43, LogL = -11110.43, AIC = 22230.9, SC = 22,268)
Variable Coefficient Standard Error z-Value P-Value
λ 0.553 0.007 71.111 < 0.001
Constant 4.536 0.354 12.8 < 0.001
LogDC -0.155 0.059 -2.618 < 0.001
LogEC 0.020 0.002 7.257 < 0.01
LogCC 1.155 0.155 7.402 < 0.001
LogBC 0.289 0.007 37.937 < 0.001

OLS = ordinary least squares; SLM = spatial lag model; SEM = spatial error model; DF = degree of freedom; MI = Moran’s Index; LM = Lagrange Multiplier; ρ = SLM lag coefficient; λ = SEM lag coefficient; LogL = Log likelihood; AIC = Akaike info criterion; SC = Schwarz criterion.

The SEM (R2 = 0.43) exhibits a moderate goodness-of-fit and greater value compared to that of SLM (R2 = 0.408) and OLS (R2 = 0.165). Additional model selection criteria (LogL, AIC and SC) reveal the ability of SEM to better explain CCT compared to SLM and OLS. Greater values of R2 and LogL and lower values of AIC and SC indicate a better fit. To verify these findings, we have applied a bootstrapping approach, where we preform similar analyses on Glasgow City Centre (with 1,711 observations). The results of this process echo our findings with slightly better performance (see Supplemental Information). Thus, accounting for the spillover effect of the dependent variable results in the formation of a more accurate model. The reader is referred to Alattar, Cottrill, and Beecroft (2021) for a detailed interpretation of the model.

Thus, we can conclude that, based on the spatial dependance of OLS residuals and the model selection criteria, in some cases the inadequacy of OLS can be remedied by adopting spatial models. Crowdsourced data supports the implementation of such a robust method given its fine spatiotemporal resolution. In addition to the street network centrality indices, the implementation of SEM was able to account for the inherent spatial variation. This work indicates the potential of high spatial resolution crowdsourced data to model numerous AT applications, which can consequently result in more informed interventions.


Acknowledgments

The authors would like to acknowledge the following data source:

Strava Inc. Economic and Social Research Council. Strava Metro data - Scotland, Glasgow, Manchester, Tyne and Wear [data collection]. University of Glasgow - Urban Big Data Centre.

Submitted: March 31, 2021 AEST

Accepted: April 22, 2021 AEST

References

Alattar, Mohammad Anwar, Caitlin Cottrill, and Mark Beecroft. 2021. “Modelling Cyclists’ Route Choice Using Strava and OSMnx: A Case Study of the City of Glasgow.” Transportation Research Interdisciplinary Perspectives 9:100301.
Google Scholar
Ali, Anwaar, Junaid Qadir, Raihan ur Rasool, Arjuna Sathiaseelan, Andrej Zwitter, and Jon Crowcroft. 2016. “Big Data for Development: Applications and Techniques.” Big Data Analytics 1 (1): 1–24.
Google Scholar
Anselin, Luc. 2013. Spatial Econometrics: Methods and Models. Vol. 4. Springer Science & Business Media.
Google Scholar
Boeing, Geoff. 2017. “OSMnx: New Methods for Acquiring, Constructing, Analyzing, and Visualizing Complex Street Networks.” Computers, Environment and Urban Systems 65 (September):126–39. https:/​/​doi.org/​10.1016/​j.compenvurbsys.2017.05.004.
Google Scholar
Boss, Darren, Trisalyn Nelson, Meghan Winters, and Colin J. Ferster. 2018. “Using Crowdsourced Data to Monitor Change in Spatial Patterns of Bicycle Ridership.” Journal of Transport & Health 9 (June):226–33. https:/​/​doi.org/​10.1016/​j.jth.2018.02.008.
Google Scholar
Chen, Chen, Haizhong Wang, Josh Roll, Krista Nordback, and Yinhai Wang. 2020. “Using Bicycle App Data to Develop Safety Performance Functions (SPFs) for Bicyclists at Intersections: A Generic Framework.” Transportation Research Part A: Policy and Practice 132:1034–52.
Google Scholar
Chen, Peng, and Qing Shen. 2016. “Built Environment Effects on Cyclist Injury Severity in Automobile-Involved Bicycle Crashes.” Accident Analysis \& Prevention 86:239–46.
Google Scholar
Hong, Jinhyun, David Philip McArthur, and Mark Livingston. 2020. “The Evaluation of Large Cycling Infrastructure Investments in Glasgow Using Crowdsourced Cycle Data.” Transportation 47 (6): 2859–72.
Google Scholar
Hong, Jinhyun, David Philip McArthur, and Joanna L Stewart. 2020. “Can Providing Safe Cycling Infrastructure Encourage People to Cycle More When It Rains? The Use of Crowdsourced Cycling Data (Strava).” Transportation Research Part A: Policy and Practice 133:109–21.
Google Scholar
Jacobsen, Peter L. 2015. “Safety in Numbers: More Walkers and Bicyclists, Safer Walking and Bicycling.” Injury Prevention 21 (4): 271–75.
Google Scholar
Kang, Lei, and Jon D Fricker. 2013. “Bicyclist Commuters’ Choice of on-Street versus off-Street Route Segments.” Transportation 40 (5): 887–902.
Google Scholar
Lee, Kyung Hwan, Dong Hyuk Won, and Eun Jeong Ko. 2015. “The Multiple Impacts of the Neighbourhood Environment on the Use of Public Bicycles by Residents: An Empirical Study of Changwon in Korea.” International Journal of Urban Sciences 19 (2): 224–37.
Google Scholar
Lind, Adam, Jordi Honey-Rosés, and Esteve Corbera. 2020. “Rule Compliance and Desire Lines in Barcelona’s Cycling Network.” Transportation Letters, 1–10.
Google Scholar
Muirie, Jill. 2017. “Active Travel in Glasgow: What We’ve Learned so Far.” WWW Document. 2017. https:/​/​www.gcph.co.uk/​assets/​0000/​6007/​Active_travel_synthesis_final.pdf.
Narayanamoorthy, Sriram, Rajesh Paleti, and Chandra R Bhat. 2013. “On Accommodating Spatial Dependence in Bicycle and Pedestrian Injury Counts by Severity Level.” Transportation Research Part B: Methodological 55:245–64.
Google Scholar
Raihan, Md Asif, Priyanka Alluri, Wensong Wu, and Albert Gan. 2019. “Estimation of Bicycle Crash Modification Factors (CMFs) on Urban Facilities Using Zero Inflated Negative Binomial Models.” Accident Analysis & Prevention 123:303–13.
Google Scholar
Rosenthal, Sonny. 2017. “Regression Analysis, Linear.” The International Encyclopedia of Communication Research Methods, 1–15.
Google Scholar
Teixeira, João Filipe, and Miguel Lopes. 2020. “The Link between Bike Sharing and Subway Use during the COVID-19 Pandemic: The Case-Study of New York’s Citi Bike.” Transportation Research Interdisciplinary Perspectives 6 (July):100166. https:/​/​doi.org/​10.1016/​j.trip.2020.100166.
Google Scholar
Wei, Yehua Dennis, Weiye Xiao, Ming Wen, and Ran Wei. 2016. “Walkability, Land Use and Physical Activity.” Sustainability 8 (1): 65.
Google Scholar
Yamada, Ikuho. 2016. “Thiessen Polygons.” International Encyclopedia of Geography: People, the Earth, Environment and Technology: People, the Earth, Environment and Technology, 1–6.
Google Scholar

This website uses cookies

We use cookies to enhance your experience and support COUNTER Metrics for transparent reporting of readership statistics. Cookie data is not sold to third parties or used for marketing purposes.

Powered by Scholastica, the modern academic journal management system