Loading [Contrib]/a11y/accessibility-menu.js
Skip to main content
null
Findings
  • Menu
  • Articles
    • Energy Findings
    • Resilience Findings
    • Safety Findings
    • Transport Findings
    • Urban Findings
    • All
  • For Authors
  • Editorial Board
  • About
  • Blog
  • covid-19
  • search

RSS Feed

Enter the URL below into your favorite RSS reader.

http://localhost:25822/feed
Transport Findings
April 17, 2021 AEST

Estimates of the Carbon Impacts of Commute Travel Restrictions due to COVID-19 in the UK

Kadambari Lokesh, Greg Marsden,
mobile phone datapandemiccovid-19carboncommuting
Copyright Logoccby-sa-4.0 • https://doi.org/10.32866/001c.21574
Photo by Gary Butterfield on Unsplash
Findings
Lokesh, Kadambari, and Greg Marsden. 2021. “Estimates of the Carbon Impacts of Commute Travel Restrictions Due to COVID-19 in the UK.” Findings, April. https:/​/​doi.org/​10.32866/​001c.21574.
Save article as...▾
Download all (2)
  • Figure 1: Approach for the estimation of CO2 emissions by mode for commute trips
    Download
  • Figure 2: CO2 changes from variations in commute patterns across the UK (presented as percentage changes); Analysis period: Feb 2020- June 2020; O2 data for February used as baseline.
    Download

Sorry, something went wrong. Please try again.

If this problem reoccurs, please contact Scholastica Support

Error message:

undefined

View more stats

Abstract

This paper explores the carbon impacts of the reductions in commute travel which resulted from restrictions placed on the general population in the UK. The article uses anonymised and aggregated mobile data for the period February 2020 to June 2020 to understand how commute trips changed spatially. This has been linked to journey length and emissions data to produce estimates of the consequent reductions in CO2 (an average range of 17-60%). At a local level, the key factors that contributed to substantial CO2 reductions were high car ownership, paired with the prevalence of specific industrial employment types that could readily transition from a desk-based work to virtual working.

Questions

This paper explores the carbon impacts of the travel restrictions placed on the general population in the UK as a result of Covid-19 pandemic. Specifically, it focusses on commute journeys where the advice from the Government was to work from home, if possible (GOV.UK 2020). The article uses anonymised and aggregated data from O2, a major mobile network provider, between Feb-2020 to Jun-2020 to understand how commute trips fluctuated. This is of relevance to the broader climate crisis which requires deep cuts in emissions from significant demand reduction measures over the next two decades (Brand, Anable, and Morton 2019). Our research question is:

What impact did the COVID-19 “work from home if you can” policy have on the commute patterns and CO2 emissions?

Methods

Anonymised and aggregated mobile data insights for Feb-2020 to Jun-2020, from O2 mobile, was used to evaluate the spatial variations in commute journeys. O2 connects with 23 million devices in the UK (25% market-share)[1] offering movement insights, when connecting with the mobile network. Daily estimates of numbers of commute journeys were provided for each of 375 Local Authority Districts (LADs) based on analysis of the durations of phone locations away from home which matched a commute pattern.[2] Analysis of monthly commute data from the National Travel Survey [NTS0504] shows that the number of commute trips per day in Feb-2020 was similar to other months in the dataset, prior to the lockdown (Office of National Statistics 2020b). Therefore, the data for February was treated as the “pre-lockdown” baseline. Lockdown began on 23rd March[3] in the UK and so April to June were considered “during-lockdown”.

To convert journey reductions into a CO2eq, it was necessary to assign estimates of journey length (by region) and mode split to each local authority. The NTS data, however, allows for differentiation at a regional level and only for pre-lockdown scenario. Similar data was sourced from the Scottish Transport Statistics (Transport Scotland Analytical Services 2018), Welsh Travel statistics (Welsh Government Statistics and Research 2019) and the Northern Ireland Transport Statistics (Northern Ireland Statistics and Research Agency 2020) for UK-wide coverage. Regional figures, assigned to the local authorities, within that region, are shown in Table 1.

Table 1:Percentage mode share for commute journeys only (pre-lockdown), average trip lengths and CO2 emission factors
Region of workplace1 Commute Modal split (%)2
Car Bicycle Bus / coach All rail Walk Average trip length by car (miles)3
North East 78 2 6 3 9 9
Tyne and Wear 73 3 10 6 7 -
Rest of North East 83 0 3 4 11 -
North West 76 2 7 4 9 8
Greater Manchester 71 3 9 7 9 -
Merseyside 71 2 9 5 11 -
Rest of North West 82 2 4 2 9 -
Yorkshire and The Humber 75 4 7 3 10 7.5
South Yorkshire 74 3 8 0 11 -
West Yorkshire 75 2 8 4 8 -
Rest of Yorkshire and The Humber 74 7 5 0 12 -
East Midlands 79 3 4 1 11 10
West Midlands 80 2 6 3 8 8
West Midlands (met. county) 75 1 10 5 8 -
Rest of West Midlands 85 2 2 0 9 -
East of England 78 4 3 3 10 12
London 27 5 12 46 9 7
Central London 8 5 7 71 6 -
Rest of Inner London 20 5 14 47 11 -
Outer London 55 3 16 15 10 -
South East 74 4 5 5 11 11
South West 75 4 4 2 13 8
England 67 4 7 11 10 -
Wales4 80 3 4 3 9 9
Scotland5 70 3 9 5 11 12
Northern Ireland6 74 1 3 2 20 11
Great Britain 68 3 7 7.8 10 -
Average trip length by mode7 (miles) Please see column 3 3.3 5.1 32.3 0.7 -
Average Carbon Factors by mode8 (gCO2 eq/passenger km) 148.2 0 25.1 12.7 0 -

Notes
1 This excludes all those in employment that live in Great Britain but work outside of it and includes all those in employment that live in Northern Ireland and work in Great Britain.
2 Source: Labour Force survey, “Statistical Dataset: Modal Comparisons (TSGB01)” 2019 [Table: TSGB0109]
3 Refers to average trip length by car only. Source: Average Trip Length by region and purpose, Office of National Statistics 2020b [Table: NTS9912]
4 Source: Welsh Government Statistics and Research 2019
5 Source: Transport Scotland Analytical Services 2018
6 Source: Northern Ireland Statistics and Research Agency 2020
7 Refers to Average trip lengths for commute by modes other than by car; Source: Labour force survey (“Statistical Dataset: Modal Comparisons (TSGB01)” 2019) [Table: TSGB0103]
8 Source: UK Government GHG conversion factors for passenger vehicles (Department for Environment, Food and Rural Affairs 2020)

There are a few shortcomings to the data and assumptions we have adopted. It is neither possible to estimate the actual monthly mode share reductions for commute, over the lockdown period, nor is it, to determine the extent to which the public transport (PT) levels reduced, by month and locality. We have attempted to allow for the impacts of these uncertainties through a scenario analysis described further below. Other factors such as increased unemployment or people being furloughed were excluded and so the estimates must be seen as upper bounds of CO2 reduction.

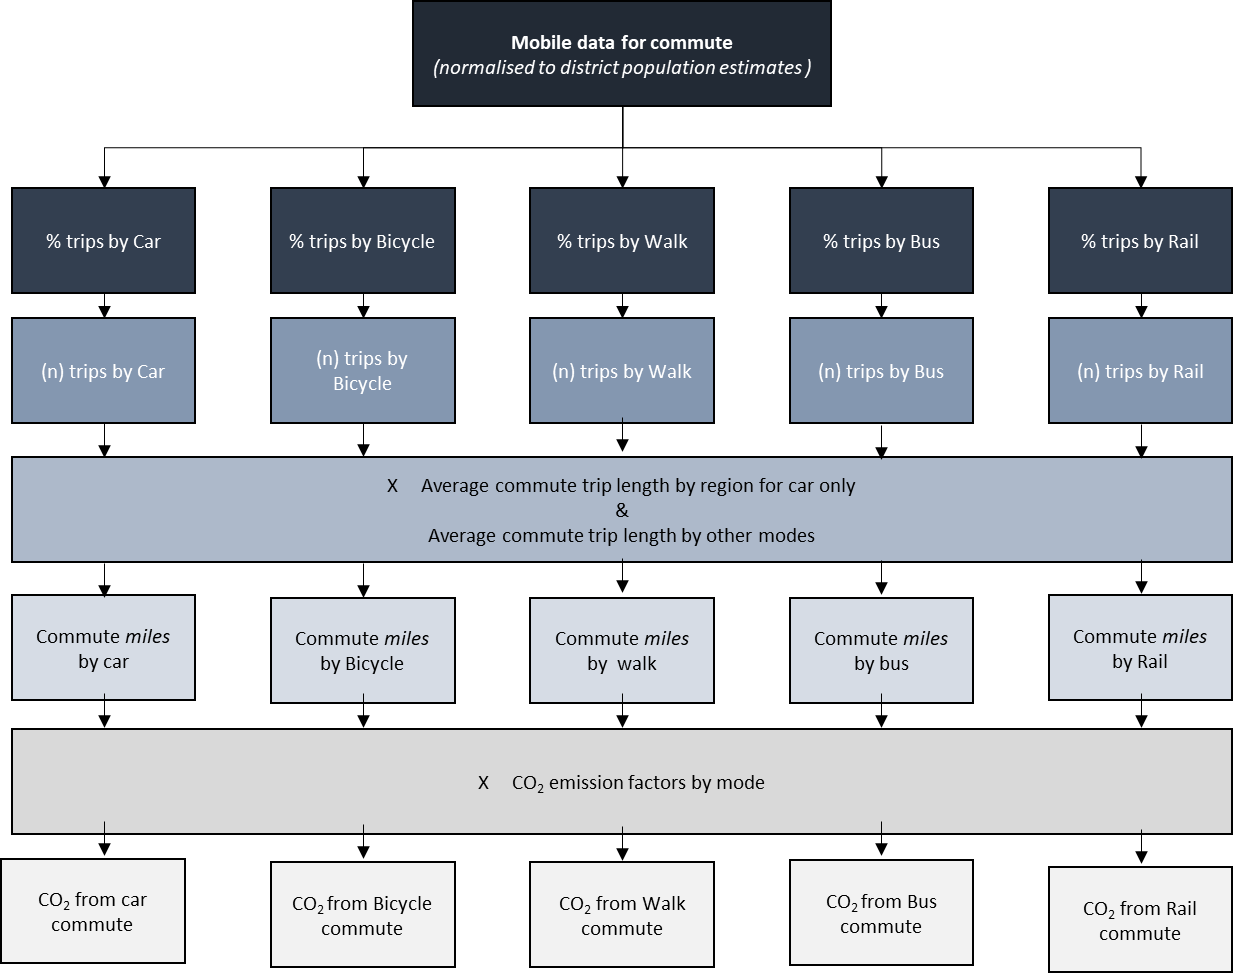
The district-level mobile data was first normalised to each of the 375 districts using the population estimates from UK census (Office for National Statistics, National Records of Scotland, and Northern Ireland Statistics and Research Agency 2017). The districts were then grouped into the NTS-geographic regions (shown in Table 1) and the commute journeys were differentiated into the NTS-modal shares. Upon splitting the trips, two other parameters were factored into commute CO2 estimation (Figure 1): the average trip lengths by car/ other modes and modal emission factors.

Figure 1
Figure 1:Approach for the estimation of CO2 emissions by mode for commute trips

Monthly commute CO2 emissions were estimated for each of the local authorities across the UK, between Feb-2020 and Jun-2020. February emissions were set as reference and the monthly percentage changes in CO2 emissions, between Apr-2020 and Jun-2020, were estimated for “during lockdown”.

To deal with the uncertainties in the estimated emissions, a 2 x 2 matrix was created which allows for variations in the commute mode shares and the amount of public transport that may have operated, before and after the lockdown. For clarity, the two mode share assumptions were: Scenario-a: “Pre-lockdown” mode share pattern retained; Scenario-b: “During-lockdown” estimated mode share patterns (details in “Notes and Assumptions” in Table 2). Considering the potential for emissions from PT, it is assumed that the emissions from commuters who usually travelled by PT (in “pre-lockdown” settings) would be saved “during-lockdown” as the services reduced (Scenario-c). Alternatively, Scenario-d included emissions assuming that services may still have operated “during-lockdown”.

Table 2:Estimation of monthly CO2 emissions applying “pre-lockdown” and “during-lockdown” modal distribution, followed by a sensitivity study encompassing the impacts of modal shares variations and fluctuations in public transport services and usage
Parameters Scenario-a: “Pre-lockdown” mode-share settings1 Scenario-b: “During-lockdown” mode share settings2
Mode of travel Car Bus Rail Car Bus Rail
Emission factors (gCO2eq/passenger km travelled) 148.3 25.1 12.7 148.3 25.1 12.7
CO2 emission (Feb) (baseline) (kT) 388.9 56.8 22.3 - - -
CO2 emission (Mar)3(kT) 363.7 3.5 15.9 420.2 1.9 4.3
Monthly commute CO2eq estimate6 CO2 emission (Apr) (kT) 95.6 0.91 4.16 110.4 0.5 1.1
CO2 emission (May) (kT) 137.5 1.31 6.0 158.9 0.70 1.6
CO2 emission (Jun) (kT) 168.5 1.60 7.3 194.7 0.9 1.8
3- months total (kT) 401.6 3.8 17.5 463.9 2.0 4.7
Scenario c: 3-month total for all modes if PT emissions saved (kT) 422.9 470.7
Scenario-d: 3-month total for all modes no PT emissions saved (kT) 480.7 4 543 5

Notes and Assumptions for the scenarios
1 Mode shares were assumed to be in line with the pre-lockdown modal split of 68% for cars; 7% for buses; 10% for rail and 15% for other modes (Please see Table 1) (motorised travel make up 85% of total commute mode distribution; at 100%, the split will be 80% for cars, 8.23% for buses and 11.8% for rail;)
2 “During-lockdown” commute trips were acquired by applying DfTs (March-June) average mode reductions (57% for cars; 80% for buses and 90% for rail); motorised commute modes - Car: from 80% to 92.4%; Bus: from 8.23% to 4.4%; rail: from 11.8% to 3.1%)
3 March commute estimates (383kT and 426 kTCO2eq) were excluded from the 3-month total estimates since the travel restrictions had not perfectly set in until the last week of the month (23rd March) leading for these CO2 estimates to be misleading for our assumed scenarios.
4 Emissions in scenario (a-d) represents 3-month total CO2 emissions for all modes, in the “pre-lockdown” setting, taking into account the baseline PT emissions (Feb), allowing for the assumption that all PT services were operational, despite the fall in PT commute.
5 Emissions in scenario (b-d) represents 3-month total CO2 emissions for all modes, from the “during lockdown” commute setting, taking into account the baseline PT emissions (Feb), following PT operations mentioned in point 4.
6 Working days and School/National Holidays in 2020 by month: February (20, 5) March (23, 3), April (22, 7), May (21, 10), June (22, 4)

Findings

The anticipated baseline emissions determined for February 2020 (before lockdown) within this study, was 1422kT CO2. A validation of our baseline monthly commute CO2 emissions estimate for February, against another national estimate for monthly commute emissions, is within 5%.[4] Overall, the range of emissions, reported in this sensitivity analysis, correspond to just 30-38% of an equivalent 3-monthly pre-lockdown baseline emissions (1422kT estimated from February figures). Relative to overall magnitude of the reduction, the impact of mode share variations between the scenarios are relatively small. Assuming the mode share to be more car-oriented in lockdown, in line with national average mode use, estimates results in emissions which are 47.8kT to 62.3kT higher over the three months (or 3.4% - 4.4% of the anticipated baseline). Whether or not reductions in public transport translated into savings in public transport emissions, made a difference of 57.8-72kT or 4-5% of the anticipated baseline.

Figure 2 represents the monthly fluctuations in district-level emissions of commute carbon (representing scenario pair a-d), for Mar-2020 to Jun-2020. Commute traffic increased in the starting weeks of March than normal (20-25%) which is most likely to be in preparation for the looming lockdown. A sharp drop then occurred from precautionary local closures of businesses, in advance of the 23rd March lockdown. However, the highest levels of commute carbon reduction, were observed in May 2020, in the range of -40 to -78%. Applying a scaling factor based on the number of workdays to account for potential commute in a standard month, across March to June, led our calculated monthly commute emissions to be ±5% that of our baseline estimates (1500kTCO2eq /month).

Figure 2
Figure 2:CO2 changes from variations in commute patterns across the UK (presented as percentage changes); Analysis period: Feb 2020- June 2020; O2 data for February used as baseline.

A matching of the travel adaptation and carbon reduction data was then made with district-level data on the density of certain industrial sectors that could successfully adapt to operate virtually and their associated car-ownership patterns. For this assessment, the 375 LADs were grouped into quintiles based on the percentage of commute emission reductions they demonstrated (Table 3). The openly available MOT (annual vehicle test) dataset[5] was used to estimate the proportion of the car fleet held by households in each quintile (Department for Transport 2020). As for employment type, the UK labour statistics demonstrated that of the 30-45% employed in professional, associate professional/ technical occupation, roughly 91.1% and 86.1% worked from home during the lockdown (Office of National Statistics 2020a). Sectors that followed this pattern also include information/ communication and scientific/ technical activities (of whom 79% and 45% worked remotely). Table 3 shows how the percentages of industry type compare across the quintiles.

Table 3:Comparison and analysis of contribution of car ownership and employment types on the overall commute carbon emissions within the different districts.
Classification1 Percent CO2 reduction Proportion of UK car fleet 2 Proportions of population in the specified type3 of employment and industry type
Top Quintile 68 to 78% 38.4% 40.3%
Second Quintile 56 to 67% 21.8% 23.4%
Third Quintile 37 to 50% 16.9% 16.1%
Fourth Quintile 24 to 34% 13.8% 12.7%
Lower Quintile 1 to 24% 8.9% 7.4%

Note:
1 Corresponds to the classification of 375 districts into five Quintiles based on the percentage of district-level commute carbon reductions, observed over the analysis period.
2 Source: Personal communication, 2019
3 Corresponds to the total number of employed persons in technical, professional, associate professional roles within each quintile.

The top 20% districts for CO2 emission reduction (avg. of 68% to 78%) were those with the highest proportion of specific industry roles which could be worked from home and held the highest proportion of the UK fleet, thus reinforcing the effects of commute carbon reduction over the lockdown period (Table 3).

Future work should address the extent to which forced behavioural shifts can become embedded in the commute demand reduction and wider decarbonisation policies. There will be a need to explore what this means for different places, once a more nuanced understanding of the post-pandemic mode-shift behaviours begin to take shape.


Acknowledgement

This project has received funding from EPSRC under grant agreement EP/S032002/1 and EP/R035288/1. This project has also received data courtesy of O2. The article is the responsibility of the authors and does not imply endorsement by the funders.


  1. The trip data used in this study covers changes implied by only the N of 23 million devices that connect to the O2 network and not the entire population

  2. Commutes are estimated from regular home and non-home pairings with extended durations. A minimum of 10 people moving between an OD-pair is required to classify as a commute journey, to protect the anonymity of users.

  3. A majority of the LADs (roughly 60% of the 375 LADs) have shown a relative spike in commute trips in the first two weeks of the March 2020 (supplemented by higher no. of working days), compared to their daily estimated equivalents in February 2020 (baseline month) (please see figure 2) .

  4. These estimates were drawn from averaging the daily emissions relative to their equivalent in Feb-2020. our CO2 estimates could be validated through a comparison with publicly reported figures for commute emission. It is estimated that the UK’s annual commute carbon amounts to 18 billion kgCO2eq, which breaks down to roughly 1500 kTCO2eq per month (Mobilityways 2021)

  5. MOT dataset provides district-level information including the total numbers of vehicles by make/model and fuel type.

Submitted: January 14, 2021 AEST

Accepted: April 07, 2021 AEST

References

Brand, Christian, Jillian Anable, and Craig Morton. 2019. “Lifestyle, Efficiency and Limits: Modelling Transport Energy and Emissions Using a Socio-Technical Approach.” Energy Efficiency 12 (1): 187–207. https:/​/​doi.org/​10.1007/​s12053-018-9678-9.
Google Scholar
Department for Environment, Food and Rural Affairs. 2020. “Emission Factors Detailed by Source and Fuel - Defra, UK.” London: Department for Environment, Food and Rural Affairs (Defra). https:/​/​naei.beis.gov.uk/​data/​ef-all.
Department for Transport. 2020. “Anonymised MOT Tests and Results.” May 20, 2020. https:/​/​data.gov.uk/​dataset/​e3939ef8-30c7-4ca8-9c7c-ad9475cc9b2f/​anonymised-mot-tests-and-results.
GOV.UK. 2020. “Staying at Home and Away from Others (Social Distancing).” GOV.UK. 2020. https:/​/​www.gov.uk/​government/​publications/​full-guidance-on-staying-at-home-and-away-from-others/​full-guidance-on-staying-at-home-and-away-from-others.
Mobilityways. 2021. “Mobilityways – Zero Carbon Commuting.” https:/​/​www.mobilityways.co.uk/​.
Northern Ireland Statistics and Research Agency. 2020. “Northern Ireland Transport Statistics 2019-2020.” Travel and Transport. Department for Infrastructure, Analysis,Statistics and Research Branch. http:/​/​www.infrastructure-ni.gov.uk/​articles/​northern-ireland-transport-statistics.
Office for National Statistics, National Records of Scotland, and Northern Ireland Statistics and Research Agency. 2017. “2011 Census Aggegate Data.” UK Data Service. https:/​/​doi.org/​10.5257/​CENSUS/​AGGREGATE-2011-2.
Office of National Statistics. 2020a. “Coronavirus and Homeworking in the UK - Office for National Statistics.” https:/​/​www.ons.gov.uk/​employmentandlabourmarket/​peopleinwork/​employmentandemployeetypes/​bulletins/​coronavirusandhomeworkingintheuk/​april2020.
———. 2020b. “When People Travel.” GOV.UK. https:/​/​www.gov.uk/​government/​statistical-data-sets/​nts05-trips.
“Statistical Dataset: Modal Comparisons (TSGB01).” 2019. GOV.UK. 2019. https:/​/​www.gov.uk/​government/​statistical-data-sets/​tsgb01-modal-comparisons.
Transport Scotland Analytical Services. 2018. “Scottish Transport Statistics.” Statistics Release 37. Scotland, UK: Transport Scotland.
Welsh Government Statistics and Research. 2019. “Welsh Transport Statistics: Road Traffic:2018.” Research and Statistics. Road Transport and Statistics. 2019. https:/​/​gov.wales/​road-traffic-2018-html#section-30647.

This website uses cookies

We use cookies to enhance your experience and support COUNTER Metrics for transparent reporting of readership statistics. Cookie data is not sold to third parties or used for marketing purposes.

Powered by Scholastica, the modern academic journal management system