Loading [Contrib]/a11y/accessibility-menu.js
Skip to main content
null
Findings
  • Menu
  • Articles
    • Energy Findings
    • Resilience Findings
    • Safety Findings
    • Transport Findings
    • Urban Findings
    • All
  • For Authors
  • Editorial Board
  • About
  • Blog
  • covid-19
  • search

RSS Feed

Enter the URL below into your favorite RSS reader.

https://findingspress.org/feed
Transport Findings
March 17, 2021 AEST

The Impact of Low Traffic Neighbourhoods on Active Travel, Car Use, and Perceptions of Local Environment during the COVID-19 Pandemic

Rachel Aldred, Anna Goodman,
walkingcyclingactive travelcar uselow traffic neighbourhoodcovid-19
Copyright Logoccby-sa-4.0 • https://doi.org/10.32866/001c.21390
Photo by Tim J on Unsplash
Findings
Aldred, Rachel, and Anna Goodman. 2021. “The Impact of Low Traffic Neighbourhoods on Active Travel, Car Use, and Perceptions of Local Environment during the COVID-19 Pandemic.” Findings, March. https:/​/​doi.org/​10.32866/​001c.21390.
Save article as...▾
Download all (3)
  • Figure 1: Outer London boroughs, with location of emergency (black) and mini-Holland (red) LTNs, and other mini-Holland active travel interventions (yellow) complete by end of September 2020
    Download
  • Figure 2: Association between duration of living in an intervention area and impacts on duration of travelling by different modes in the past-week, Waves 1-3
    Download
  • Supplemental Information
    Download

Sorry, something went wrong. Please try again.

If this problem reoccurs, please contact Scholastica Support

Error message:

undefined

View more stats

Abstract

We use longitudinal survey data to compare the impacts of ‘emergency’ low traffic neighbourhoods (LTNs), set up during Covid-19, to the impacts of longer-standing LTNs. While sample sizes are small, both types of LTNs had similar increases in active travel and similar improvements in perceptions of the local environment for cycling (but no change in perceptions of most other aspects of the local environment). Car use tended to decrease. This similarity suggests the emergency LTNs may bring benefits similar to longer-standing LTNs despite their lower budgets and shorter planning periods. We also found that the active travel impacts of the long-standing LTNs grew larger over time, suggesting the emergency LTNs may likewise see larger effects in the future.

Questions

‘Low Traffic Neighbourhoods’ (LTNs) are area-based interventions that use ‘modal filters’ (planters, bollards, or camera gates) to remove through motor traffic from residential streets. During 2020 they were implemented across London boroughs as emergency measures, with 4% of the Greater London population covered by schemes introduced from March to September (Aldred et al. 2021).

We have already examined the impact of longer-standing LTNs introduced between 2015-2019 as part of the mini-Holland programme in Waltham Forest, Outer London. We found these ‘mini-Holland LTNs’ were associated with more active travel, reduced car ownership, lower road injury risk, and reduced street crime (Aldred and Goodman 2020; Goodman, Urban, and Aldred 2020; Goodman and Aldred 2021).

The newer ‘emergency LTNs’ use the same traffic reduction principles as the mini-Holland LTNs. However, they have been designed and implemented rapidly; used low-cost temporary measures; and are less likely to (yet) be accompanied by desirable additional measures such as junction improvements, greening, and cycle infrastructure. This creates uncertainty about whether they will have the same impacts as the longer-standing schemes. Rapid evidence on this is valuable as later in 2021 boroughs will decide whether to make schemes permanent.

In this paper we therefore use an established longitudinal survey to examine the impacts of the 2020 emergency LTNs, with respect to travel behaviour and area perceptions. We further compare these effects with those observed pre-pandemic in the mini-Holland LTNs.

Methods

The People and Places study is a longitudinal study treating the mini-Hollands programme of active travel investment in Outer London as a ‘natural experiment’. Data here covers baseline (May/June 2016), three pre-pandemic follow-up Waves (May/June 2017-2019), and a fourth follow-up during the pandemic (September/October 2020). Participants (adults resident in Outer London) were recruited via random household cluster sampling and recruitment from two Transport for London customer databases, with response rates of ~1-2% (Aldred, Croft, and Goodman 2019). We constructed survey weights for each Wave to allow for differences in sample composition between the survey sources (see Supplemental Information 1). Participants provided demographic and social-economic information, filled in a past-week travel diary with minutes of walking, cycling, and car use, and answered questions about their perception of their local area. Exploratory factor analysis was used to group the ‘healthy streets’ area perception questions into cycling perceptions, non-cycling perceptions, and a combined set of general perceptions.

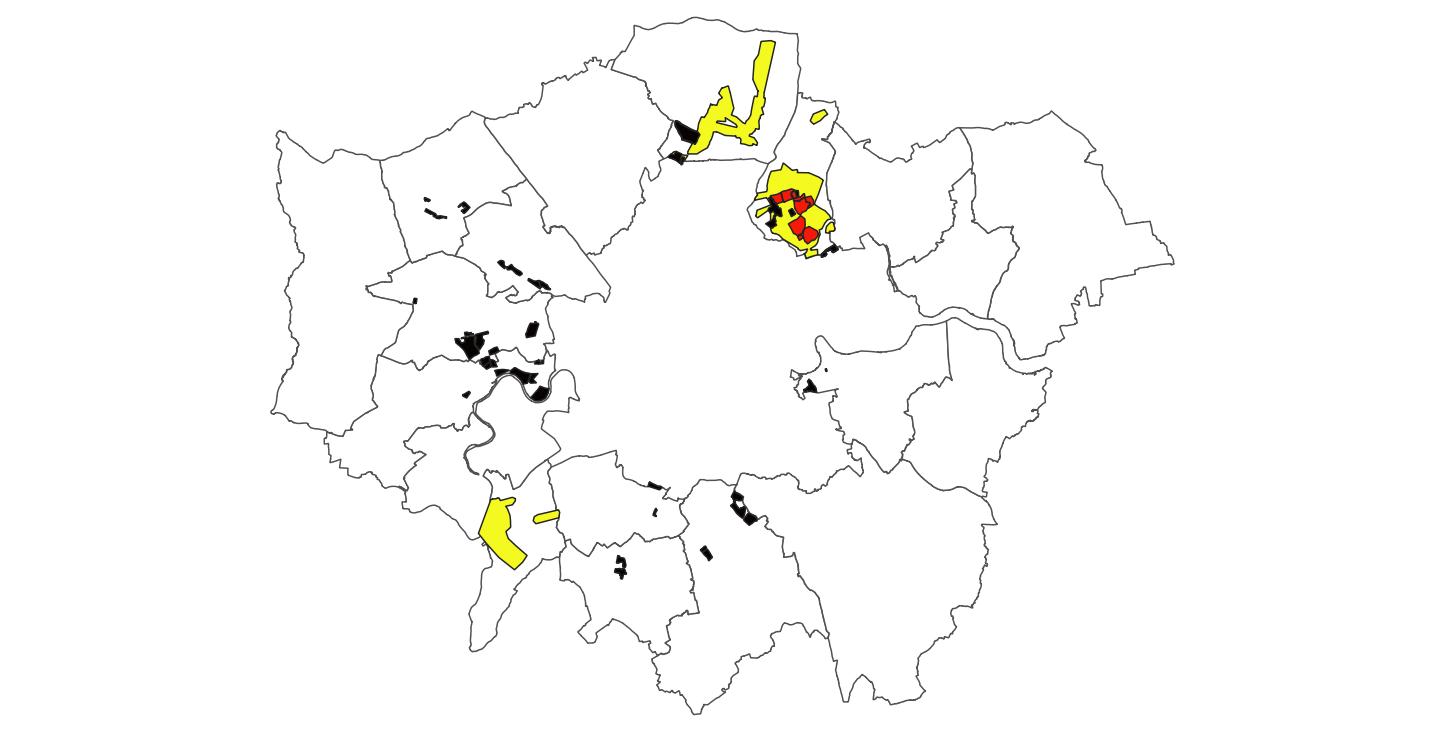
In each follow-up Wave we identified participants living in: (i) 2020 emergency LTNs (built between March and September 2020, i.e. only applicable in Wave 4), (ii) mini-Holland LTNs (built pre-2020, applicable Waves 1-4), and (iii) non-LTN areas that stakeholders identified as getting other substantial active travel interventions as part of the mini-Holland programme. Figure 1 shows the areas of Outer London covered by LTNs and other active travel infrastructure as the end of September 2020. Our control group was Outer London residents living in areas not (yet) receiving these interventions.[1]

Figure 1
Figure 1:Outer London boroughs, with location of emergency (black) and mini-Holland (red) LTNs, and other mini-Holland active travel interventions (yellow) complete by end of September 2020

Out of 3435 participants who participated in the baseline survey, 2309 participated in at least one follow-up Wave. We excluded N=16 individuals who moved into or out of a mini-Holland borough before providing follow-up data (and we excluded follow-up Waves for individuals who subsequently moved); N=46 with insufficiently accurate address information; and N=37 with missing data on sociodemographic characteristics. This left a sample of 2210 participants across Waves 1-4, of whom 1406 provided travel data in Wave 4 and 1429 provided local area perception data. See Supplemental Information Table 2.1 for participants’ baseline characteristics.

We used Poisson regression with robust standard errors for binary outcomes (Zou 2004), because many of our binary outcomes are common. We used linear regression for our continuous outcomes. For analyses combining Waves 1-3 we used multi-level modelling, with survey responses clustered within participants. Our primary exposure of interest was type of area. All regression analyses adjusted for the corresponding measure at baseline, with baseline measures of past-week travel entered as linear terms, alongside quadratic terms if statistically significant. We also adjusted for car ownership at baseline, and for other demographic and socio-economic characteristics as measured at follow-up. For further details on our analysis methods see Aldred, Croft, and Goodman (2019).

Findings

Table 1 indicates relatively similar impacts on total past-week active travel for emergency and mini-Holland LTNs, with point estimates of +58 minutes/week in the emergency LTNs and +69 minutes/week for the mini-Holland LTNs.[2] However, the confidence intervals were very wide due to small sample sizes (N=65 and N=61), and the effects only borderline statistically significant (0.03≤p<0.07). The balance of walking and cycling differed; split around equally in mini-Holland LTNs but with only walking showing an increase in the newer LTNs. However, there is substantial uncertainty because of small sample sizes. Table 1 also shows trends towards reduced car use in the emergency LTNs, although again these are only weakly statistically significant (0.04≤p<0.05).

Table 1:Past week travel behaviour in relation to intervention status in Wave 4: adjusted rate ratios/regression coefficients (95% confidence interval)
Domain Outcome Control group Emergency LTN Mini-Holland LTN Other active travel infrastructure
No. observations 1030 65 61 250
Past-week cycling % Doing any past-week cycling 1 1.21 (0.86, 1.71) 1.61 (1.22, 2.13)** 1.13 (0.88, 1.45)
Minutes of cycling in past week 0 -4.2 (-24.6, 16.2) 27.1 (-1.2, 55.4)† 4.3 (-7.7, 16.4)
Past-week walking % Doing any past-week walking 1 1.05 (0.94, 1.16) 1.02 (0.93, 1.13) 1.01 (0.95, 1.08)
Minutes of walking in past week 0 60.9 (5.4, 116.4)* 35.7 (-20.8, 92.2) 20.1 (-8.1, 48.3)
Past-week active travel % Doing any active travel in past week 1 1.05 (0.96, 1.15) 1.01 (0.91, 1.11) 1.03 (0.98, 1.09)
% Doing 140+ minutes active travel in past week 1 1.28 (1.10, 1.49)** 1.15 (0.97, 1.36) 1.13 (1.03, 1.25)*
Minutes of active travel in past week 0 58.4 (-4.0, 120.9)† 69.4 (6.2, 132.7)* 23.8 (-6.7, 54.2)
Past-week car travel % with any car travel in past week 1 0.81 (0.66, 0.99)* 0.93 (0.76, 1.13) 1.04 (0.96, 1.12)
Minutes of car travel in past week 0 -43.7 (-87.0, -0.4)* -18.1 (-59.0, 22.9) -23.4 (-45.4, -1.5)*

†p<0.10, *p<0.05, **p<0.01, ***p<0.001, for difference from the reference group. LTN = low traffic neighbourhood, Analyses adjust for the baseline measure of the outcome in question and for gender, age, ethnicity, disability, household type, employment type, the baseline number of cars in the household, and (in Wave 4) whether the participant was working from home more than usual and the reported impact of Covid-19 on their total travel volume.

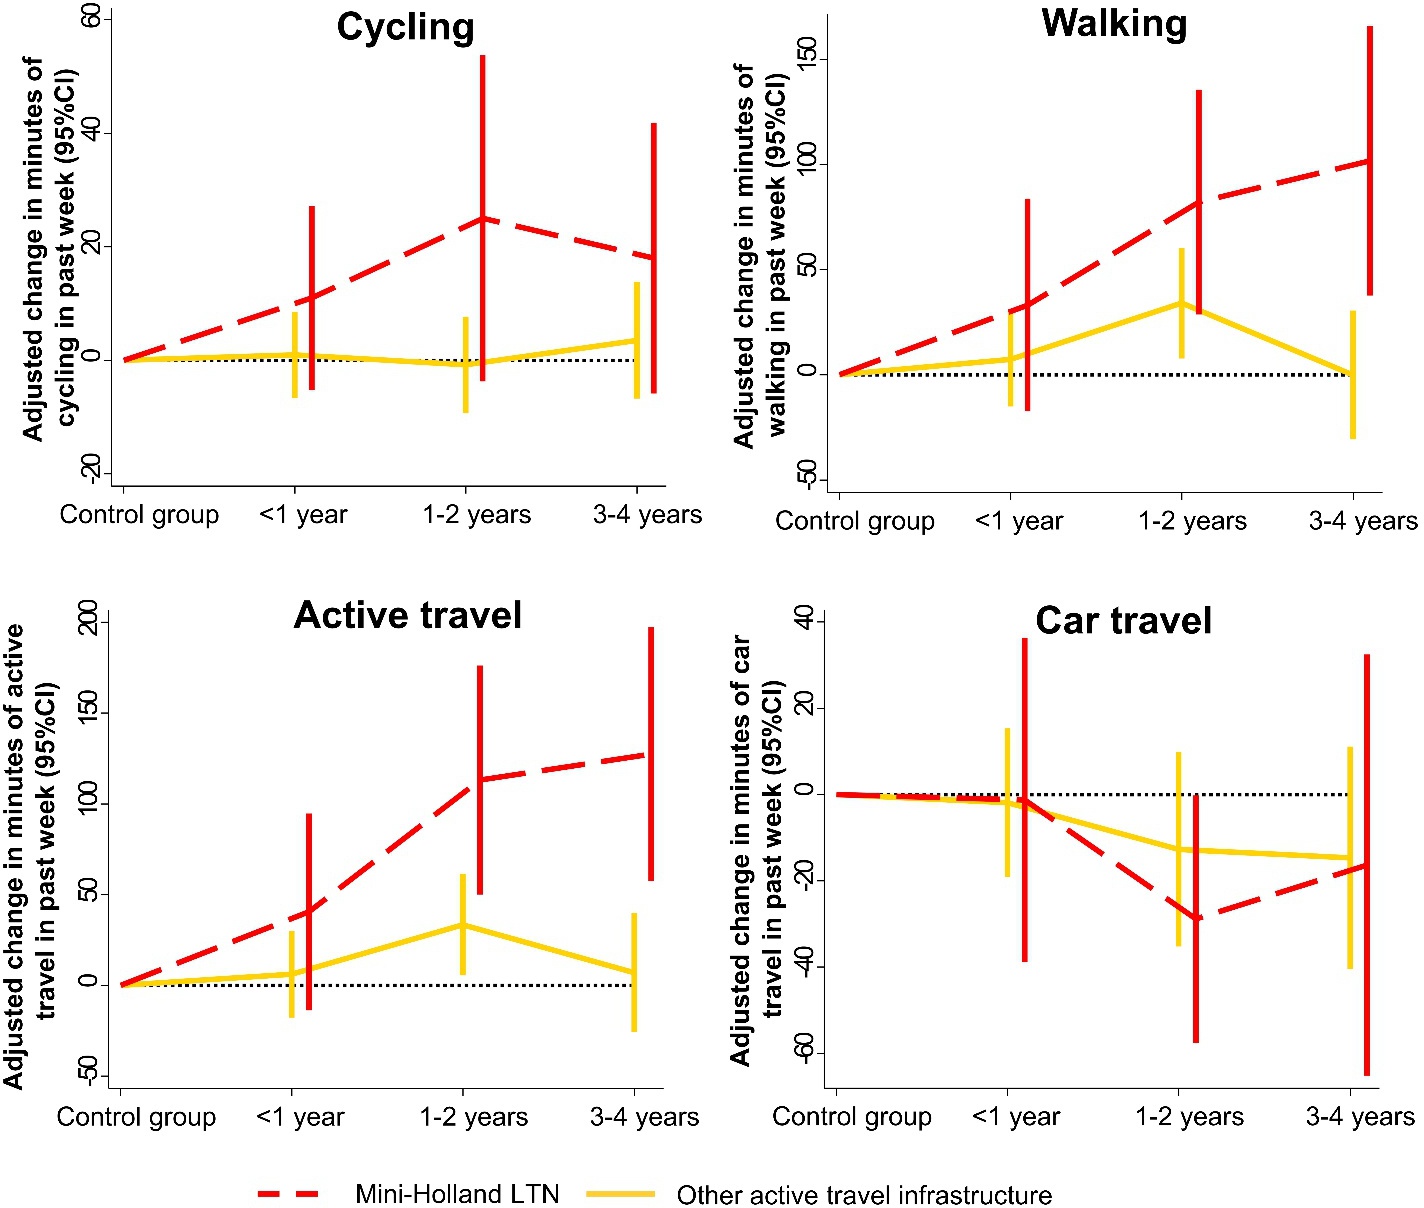
Analyses of Waves 1-3 of our data indicated that impacts on minutes of cycling, walking, and driving were smaller in the first year than thereafter in the mini-Holland LTNs (Figure 2, Supplemental Information Table 2.3). Thus, the effects seen in the emergency LTNs may likewise increase over time, although this should not be assumed given the emergency LTNs generally lack complementary measures such as cycle tracks and junction improvements.

Figure 2
Figure 2:Association between duration of living in an intervention area and impacts on duration of travelling by different modes in the past-week, Waves 1-3

See Supplemental Information Table 2:3 for a tabulation of these results, and also equivalent results for other outcomes presented in Table 1

Perceptions of the local environment showed similar trends in all three intervention groups, with large positive impacts on cycling items (Table 2). There was no evidence of an effect on most of the non-cycling items, although statistically significant improvements were seen for ‘stop and talk to other people’ in both emergency and mini-Holland LTNs. This is interesting given that most of the increase in active travel at any Wave was made up of walking, yet the interventions were generally perceived as having more impact on the cycling environment. This apparent discrepancy would be a useful focus for future research.

In conclusion, the low-cost, rapidly-implemented emergency LTNs are associated with increased walking, possibly reduced car driving, and improved perceptions of the local cycling environment. Encouragingly, these early results are similar to or greater than those observed during the first year of the mini-Holland LTNs. Further research is needed to study LTNs with larger sample sizes and schemes outside Outer London, and could also include qualitative research on resident experiences.

Table 2:Perceptions of the local environment in relation to intervention status in Wave 4: adjusted rate ratios/regression coefficients (95% confidence interval)
Domain Outcome Control group Emergency LTN Mini-Holland LTN Other active travel infrastructure
No. observations 1,049 66 62 252
‘Healthy streets’ scores Cycling perception score (4 items) 0 0.43 (0.25, 0.61)*** 0.53 (0.38, 0.68)*** 0.40 (0.31, 0.50)***
Non-cycling perception score (10 items) 0 0.00 (-0.11, 0.12) 0.07 (-0.06, 0.20) 0.02 (-0.04, 0.09)
General perception score (14 items) 0 0.12 (0.00, 0.24)† 0.18 (0.07, 0.30)** 0.12 (0.06, 0.18)***
% favourable for individual ‘healthy streets’ items Traffic safety, cycling [c] [r] 1 1.90 (1.36, 2.65)*** 2.32 (1.74, 3.11)*** 1.66 (1.35, 2.05)***
Safety for an 8-year-old, cycling [c] 1 1.61 (0.97, 2.68)† 1.95 (1.23, 3.10)** 1.53 (1.15, 2.04)**
Lanes, routes or paths, cycling [c] 1 1.70 (1.49, 1.93)*** 1.90 (1.71, 2.11)*** 1.76 (1.62, 1.93)***
Pleasant area, cycling [c] 1 1.74 (1.33, 2.28)*** 1.93 (1.54, 2.43)*** 1.54 (1.30, 1.82)***
Traffic safety, walking [nc] [r] 1 1.14 (0.97, 1.33) 0.99 (0.81, 1.20) 1.08 (0.98, 1.19)
Safety for an 8-year-old, walking [nc] 1 1.12 (0.74, 1.71) 1.44 (1.01, 2.05)* 1.11 (0.88, 1.40)
Good quality pavements, walking [nc] 1 0.90 (0.69, 1.17) 0.92 (0.71, 1.20) 0.97 (0.85, 1.11)
Pleasant area, walking [nc] 1 1.07 (0.91, 1.25) 0.94 (0.77, 1.14) 0.97 (0.88, 1.07)
Places to go locally, walking [nc] 1 1.03 (0.91, 1.16) 1.17 (1.10, 1.26)*** 1.01 (0.95, 1.08)
Safe crossing points, walking [nc] 1 1.19 (0.99, 1.43)† 1.01 (0.81, 1.27) 1.02 (0.90, 1.15)
Places to stop and rest [nc] 1 1.06 (0.79, 1.42) 0.96 (0.70, 1.32) 1.04 (0.88, 1.22)
Sufficient shade and shelter [nc] 1 0.92 (0.59, 1.43) 0.90 (0.57, 1.45) 0.81 (0.63, 1.05)
Crime-related safety [nc] [r] 1 1.00 (0.76, 1.30) 0.89 (0.67, 1.18) 1.00 (0.87, 1.14)
Air pollution from motor traffic [nc] [r] 1 0.67 (0.36, 1.24) 0.65 (0.34, 1.24) 0.97 (0.74, 1.28)
Stop and talk to other people 1 1.48 (1.16, 1.88)** 1.29 (1.01, 1.66)* 0.91 (0.76, 1.08)

†p<0.10, *p<0.05, **p<0.01, ***p<0.001, for difference from the reference group. LTN = low traffic neighbourhood, Analyses adjust for the baseline measure of the outcome in question and for gender, age, ethnicity, disability, household type, employment type, and the baseline number of cars in the household. ‘% favourable’ = ‘Tend to agree’ / ‘Strongly agree’ for positively worded items, ‘Tend to disagree’ / ‘Strongly disagree’ for negatively worded items. Negatively worded icons are marked [r] and are reverse coded in the healthy streets scores. Items marked [c] are part of the cycling perception score, items marked [nc] are part of the non-cycling perception score. The item ‘Stop and talk to other people’ is not part of either of these scores, nor of the general perception score.


Funding Acknowledgement

The People and Places study was funded by Transport for London (TfL), who also funded the mini-Holland scheme. The emergency LTNs were funded by the Department for Transport (DfT) via the Active Travel Fund. AG and RA have been awarded DfT funding to evaluate the Active Travel Fund programme as a whole, although this study does not form part of that work. Neither TfL nor DfT had any input into this article.


  1. Note that little other active travel infrastructure was built in the rest of Outer London during 2016-2019, as the mini-Holland programme was the main funding stream for such activity in this time period.

  2. For the mini-Holland LTNs, this is smaller than the estimates in our previous analyses (Aldred and Goodman 2020), or for Waves 1-3 combined (Supplemental Information Table 2.2). This may reflect effect sizes being attenuated by the substantial noise introduced by the ways in which Covid-19 has disrupted travel patterns and reduced total travel volumes for walking and driving.

Submitted: February 07, 2021 AEST

Accepted: March 05, 2021 AEST

References

Aldred, Rachel, Joseph Croft, and Anna Goodman. 2019. “Impacts of an Active Travel Intervention with a Cycling Focus in a Suburban Context: One-Year Findings from an Evaluation of London’s in-Progress Mini-Hollands Programme.” Transportation Research Part A: Policy and Practice 123 (May):147–69. https:/​/​doi.org/​10.1016/​j.tra.2018.05.018.
Google Scholar
Aldred, Rachel, and Anna Goodman. 2020. “Low Traffic Neighbourhoods, Car Use, and Active Travel: Evidence from the People and Places Survey of Outer London Active Travel Interventions.” Findings, September. https:/​/​doi.org/​10.32866/​001c.17128.
Google Scholar
Aldred, Rachel, Ersilia Verlinghieri, Megan Sharkey, Irena Itova, and Anna Goodman. 2021. “Equity in New Active Travel Infrastructure: A Spatial Analysis of London’s New Low Traffic Neighbourhoods.” https:/​/​doi.org/​10.31235/​osf.io/​q87fu.
Google Scholar
Goodman, Anna, and Rachel Aldred. 2021. “The Impact of Introducing a Low Traffic Neighbourhood on Street Crime, in Waltham Forest, London.” Findings, February. https:/​/​doi.org/​10.32866/​001c.19414.
Google Scholar
Goodman, Anna, Scott Urban, and Rachel Aldred. 2020. “The Impact of Low Traffic Neighbourhoods and Other Active Travel Interventions on Vehicle Ownership: Findings from the Outer London Mini-Holland Programme.” Findings, December. https:/​/​doi.org/​10.32866/​001c.18200.
Google Scholar
Zou, G. 2004. “A Modified Poisson Regression Approach to Prospective Studies with Binary Data.” American Journal of Epidemiology 159 (7): 702–6. https:/​/​doi.org/​10.1093/​aje/​kwh090.
Google Scholar

This website uses cookies

We use cookies to enhance your experience and support COUNTER Metrics for transparent reporting of readership statistics. Cookie data is not sold to third parties or used for marketing purposes.

Powered by Scholastica, the modern academic journal management system