

Questions
Level 5 automation for autonomous vehicles (according to SAE International 2019 classification) is an ambitious objective. Safety and reliability are required within those automation systems. Promises of longitudinal control include a significant reduction of the inter-vehicular response times, increasing capacity. For human-driven cars, the reaction time (including perception, decision, and action) is about 1.2 s (with a standard deviation of 0.3 s) according to literature (see for example Schakel, van Arem, and Netten 2010, which agrees with earlier references). A surrogate for human eyes, brain and legs via an automated system comprising precise sensors, rapid computers, and reliable actuators would be the best way to reduce current response times. Two main types of automated longitudinal control exist:
-
Adaptive Cruise Control. The vehicle measures distance and estimates speed concerning its immediate leader, adapting its speed to the current situation. The controller acts locally, meaning that in a platoon the vehicle reacts to vehicle immediately in front of it. Therefore, in ACC platooning experiments, the response time of the ACC vehicle number in the platoon compared to the leader vehicle 0 (we name this response time will likely be about times larger than the response time of any vehicle compared to its immediate leader
-
Cooperative Adaptive Cruise Control. The platoon setting in this condition adds information to the local control by communicating information (speed, inter-distances) from preceding vehicles in the platoon towards vehicle Therefore, whatever is the position of the vehicle inside the platoon, the transmission of the speed change information should be almost the same, leading to the independence of to the value of
We analyse data collected during two groups of experiments presented in Tiernan et al. (2017). The experiments involve platoons of five successive vehicles driving in ACC or CACC mode.[1] This provides the first answers to the following questions: (1) what are the observed values of response times inside a platoon made of ACC vehicles? And (2) are the response times to a leader speed change in a CACC platoon and the position inside the platoon independent?
Methods
Data sets provided by U.S. Department of Transportation (2018) report platooning experiments of five vehicles driving in the same lane, with the platoon leader 0 applying scenarios of consecutive plateau of speeds 0, 20 or 26 m/s. Each experiment lasts 6 to 12 minutes with about five leader’s speed changes in each. The first group of experiments, conducted in 2016, presents a lot of missing data. The second group of platooning experiments, performed in 2018, only includes the CACC mode. We aim to analyse the response time of the follower vehicle to a speed change of the leader.
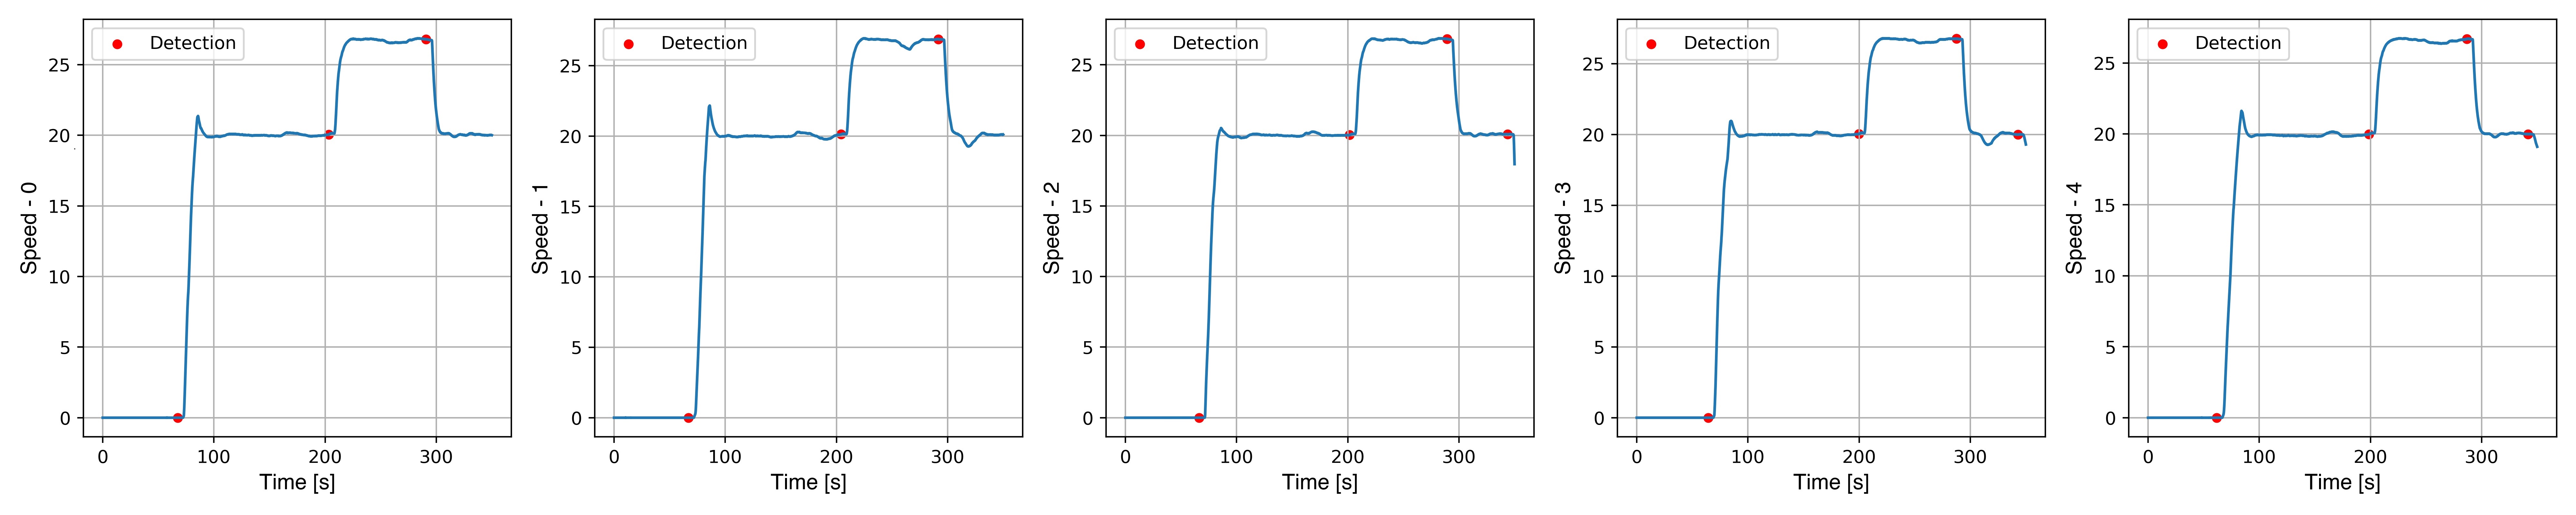
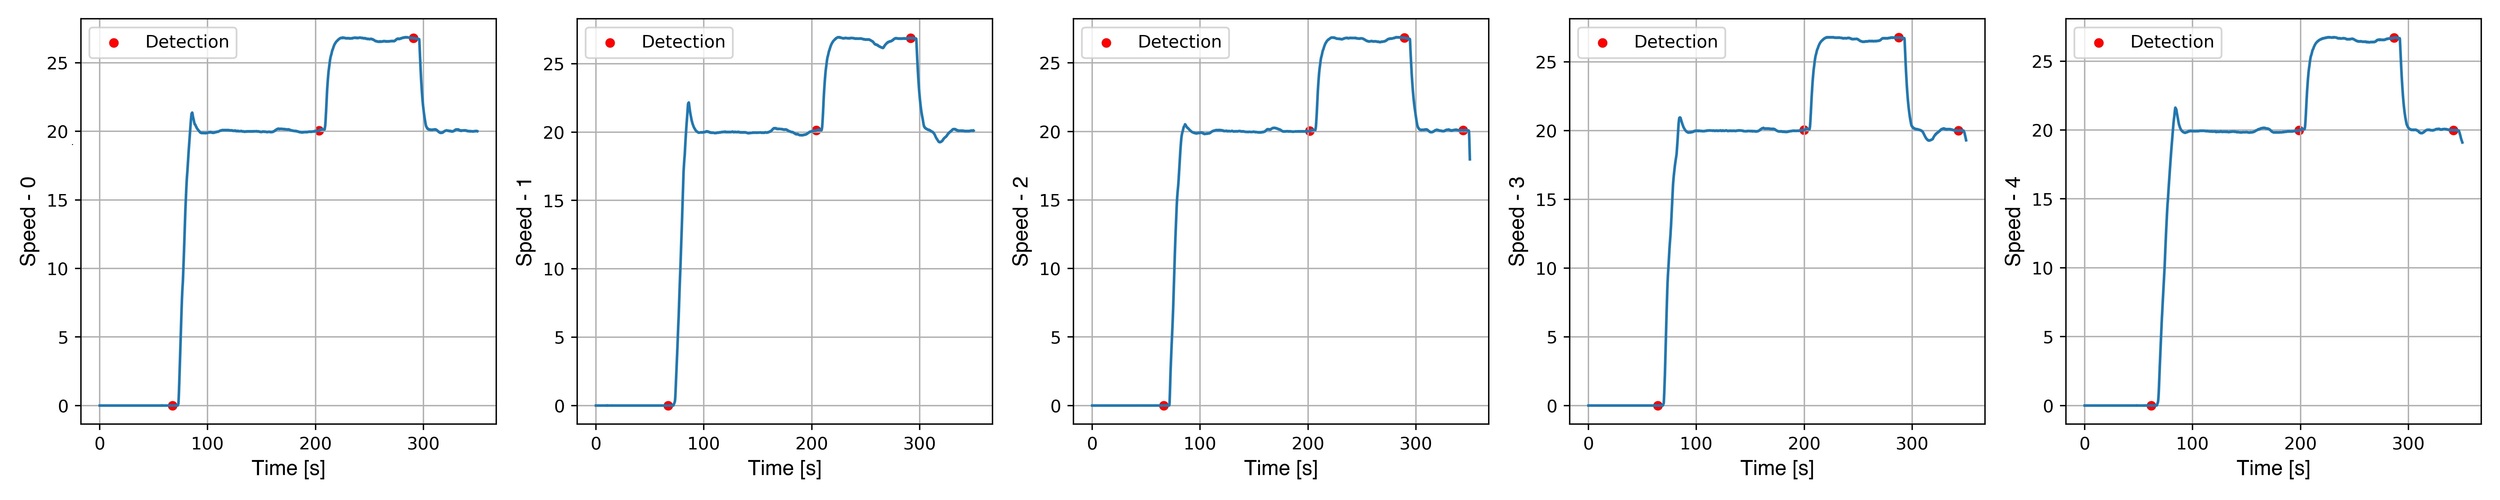
Based on the vehicle’s speed profile and the setting time when speed changes, we examine if such speed changes surpass a threshold given by the total variance of the vehicle’s acceleration. With this detection method, we identify the instants at which speed transitions occur (see Figure 1). Thus, by comparing the speed change instants of two successive vehicles, we compute response times.[2]
We have considered the 2016 ACC and the 2018 CACC data sets. In the ACC case, we obtained a sample of 4 platoon experiments and identified 7 platoon leader’s speed changes. We thus identified 28 events of speed changes leading, after the rejection of 4 outliers (out of the interval [0; 7.7] s), to a group of 24 events, all treated independently. For the CACC case, the change in speed profile allowed our detection method to identify 9 speed transitions for vehicles 0 to 4 of the platoon.
Findings
Values of the ACC response times of all followers to their immediate leader’s speed changes are displayed in figure 2. We observe a mean value of 2.78 s and a standard deviation of 1.61 s. Compared to other findings, this is twice the mean value of human drivers’ reaction times (see Schakel, van Arem, and Netten 2010; Ranjitkar et al. 2003). Compared with other ACC experiments, our observations are significantly larger than the ones presented in previous papers:
-
Makridis et al. (2020) reports values twice lower, with different experimental settings,
-
The recent results presented in Li et al. (2020) are 1 s lower, with a similar measurement method, when the CACC is set to maximal headways.

This claims for further data analysis, in particular to scrutinize the influence of cars’ automation heterogeneity (Gunter et al. 2020).
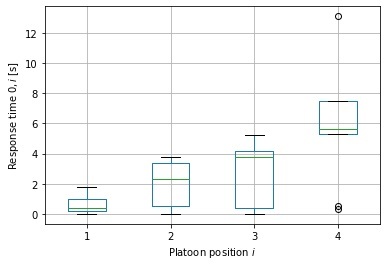
For the CACC case, the response times of the vehicles with respect to speed changes of the platoon leader are displayed in figure 3. For the first vehicle, as expected, we do observe much shorter reaction times compared to what was observed in the ACC case, similarly to Milanés and Shladover (2014). This is not the case for the vehicle in position 4. The answer to our second research question is therefore certainly not “yes”, figure 3 showing a dependence of the response time with the vehicle position. From this, we can suspect a partial inefficiency of the communication layer.
To summarize, even though our analysis suffers from a low sample size, the first results suggest that ACC times are not significantly shorter or at least comparable to the one of human-driven cars. Connectivity remains an aspect for further study since connectivity loss may be the explanation of unexpected delays degrading the response time in CACC platoon mode.
Acknowledgements
The authors thank warmly the Volpe laboratory team (Tim Tiernan, Nicholas Richardson, Philip Azeredo, Wassim G Najm, and Taylor Lochrane) for their work, for making their data accessible, and for their responsiveness to our technical questions. Warm thanks are also due to the reviewers for their careful reading and comments.
These experiments were realized in the Volpe Center test track. Each Cadillac SRX vehicle was equipped with the CARMA system and was driven by a professional driver. The data collection procedure was identical for each platoon experiment. Data available here: http://doi.org/10.21949/1504485.
Code for reproduction of results available at: https://github.com/aladinoster/vrt_analysis