Loading [Contrib]/a11y/accessibility-menu.js
Findings
  • Menu
  • Articles
    • Resilience Findings
    • Transport Findings
    • Urban Findings
    • All
  • For Authors
  • Editorial Board
  • About
  • Blog
  • search

    Sorry, something went wrong. Please try your search again.
    ×

    • Articles
    • Blog posts

RSS Feed

Enter the URL below into your favorite RSS reader.

https://findingspress.org/feed
×
Transport Findings
January 26, 2021 AEST

Changes in the Pattern of Bikeshare Usage due to the COVID-19 Pandemic

Haoyun Wang, Robert Noland,
bikeshare trip patterns covid-19
Copyright Logoccby-sa-4.0 • https://doi.org/10.32866/001c.18728
Photo by Colin Blenis on Unsplash
Findings
Wang, Haoyun, and Robert Noland. 2021. “Changes in the Pattern of Bikeshare Usage Due to the COVID-19 Pandemic.” Findings, January. https://doi.org/10.32866/001c.18728.
Save article as...▾
  • PDF
  • XML
  • Citation (BibTeX)
Data Sets/Files (7)
Download all (7)
  • Table 1: Summary statistics for each land use category in Brooklyn, September 2019 and 2020
    Download
  • Figure 1: Bikeshare trip counts in 2019 and 2020 in Brooklyn, and NYC COVID-19 daily cases (7-day moving average)
    Download
  • Figure 2: Generated trips by station in Brooklyn
    Download
  • Figure 3: Top 30 trips taken in Brooklyn, broken down by OD and loop trips
    Download
  • Figure 4: Histogram of trip durations of casual user trips and subscriber trips , September 2019 & 2020
    Download
  • Table 2. Difference in land use percents for trip origins and destinations between 2019 and 2020.
    Download
  • Supplemental Material
    Download

Sorry, something went wrong. Please try again.

If this problem reoccurs, please contact Scholastica Support

Error message:

undefined
×

View more stats

Abstract

Bikeshare use in New York City dropped substantially during the initial months of the COVID-19 pandemic, but by summer of 2020 had largely recovered to pre-pandemic levels. The patterns of usage, however, have changed. In this study we compare bikeshare trip patterns in September 2020 to September 2019, restricting our analysis to the Borough of Brooklyn in New York City. We focus on user types, time of day, and changes in the origin and destination of trips, based on aggregated land uses surrounding docking stations. Our results suggest a shift toward longer trips and more recreational trips with fewer work-related trips.

1. QUESTIONS

Research evidence has shown that bikeshare use in New York City has largely recovered to pre-pandemic levels (Wang and Noland 2021). Bicycling is seen as a way to exercise and also avoid crowding on public transit and avoid potential infection with the coronavirus. Bikeshare ridership dropped during the initial lockdown in March 2020 at the onset of the pandemic. Trips patterns also changed including an increase in casual user trips and longer trip durations (Pase et al. 2020; Teixeira and Lopes 2020; Wang and Noland 2021; Tokey 2020).

Our research question focuses on how bikeshare usage has changed during the reopening period in New York City, focusing on the Borough of Brooklyn. Specifically, have the type of users and trips taken changed? Are there more recreational trips or changes in work trip patterns?

2. METHODS

We analyze trip data downloaded for the Citi Bike system in New York City, for September 2019 and September 2020 (CitiBike 2020). We used ArcGIS for geospatial data analysis, R for data management, and Tableau for data visualization. The dataset includes trip start times and end times, pick-up and destination station, and whether the user is a subscriber or casual user. Our analysis includes those trips with a duration between 2 minutes up to 6 hours, and we further only analyze trips starting and ending in Brooklyn. Land use and geographic data are from the NYC Department of City Planning (Department of City Planning, N. Y. C. 2020) and includes 11 land use categories at the tax lot level. These were reclassified to five categories: M: mixed land use, commercial, office, public; O: open space/recreational; R: residential; T: industrial, transportation & parking; and, U: other/unknown land uses. The service area of each bikeshare station was defined by Thiessen polygons, whose boundaries allocate land to the closest bikeshare station. We defined the land use category associated with a bikeshare station as the land use with the largest share within the service area.

We chose to restrict our analysis to Brooklyn since most of Manhattan is classified as mixed land use, making it impossible to examine changes in trip patterns between different land uses. Trips in Brooklyn totaled 386,778 in September 2019 and 421,832 in September 2020, accounting for 16.07 % and 17.25 % of New York City’s total bikeshare trips, respectively. Table 1 shows summary data by land use category.

Table 1:Summary statistics for each land use category in Brooklyn, September 2019 and 2020
Land use Number of stations with largest share of land use Number of stations with land use above 50% Total trips Average percent of service area Standard deviation of average percent of service area
2019 M 51 32 101,599 28.46% 17.40%
O 21 11 31,261 7.10% 14.81%
R 180 151 204,922 44.43% 25.51%
T 49 35 46,239 15.64% 22.89%
U 2 1 2,757 4.37% 6.72%
2020 M 57 33 91,438 27.39% 17.23%
O 24 17 36,668 6.64% 13.98%
R 227 194 236,508 46.05% 25.91%
T 59 44 54,374 15.78% 23.18%
U 2 1 2,844 4.13% 6.45%

3. FINDINGS

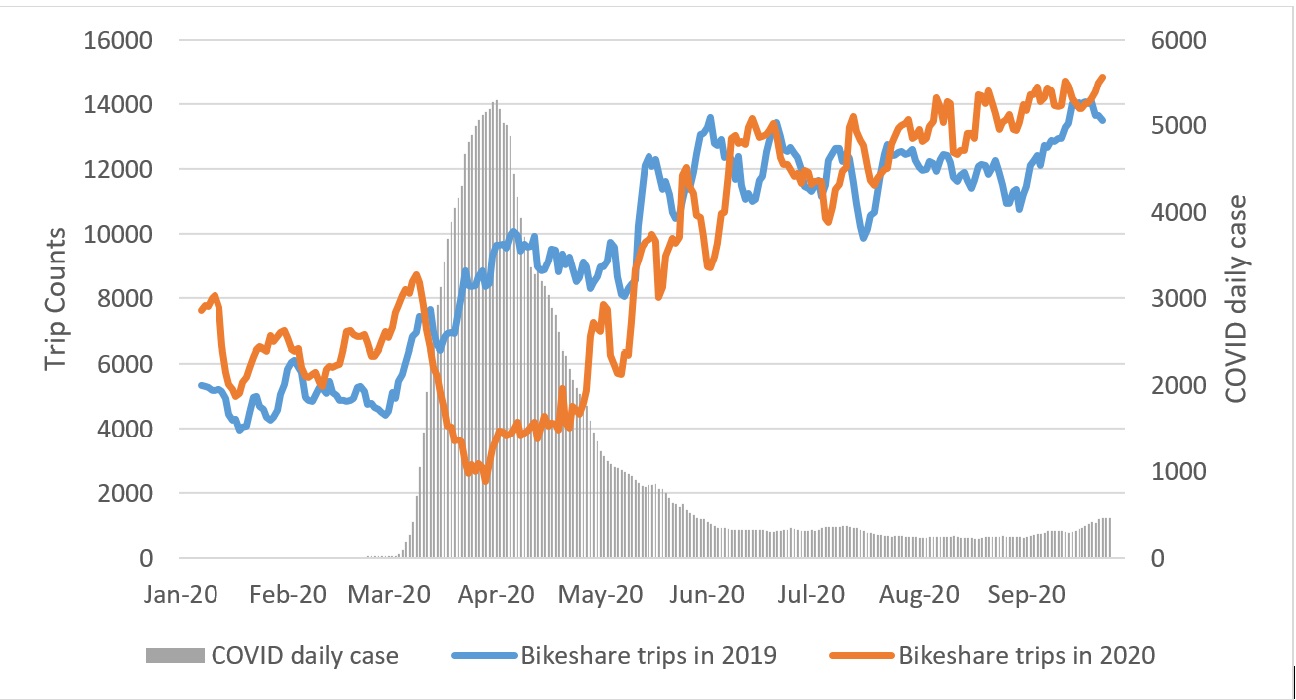
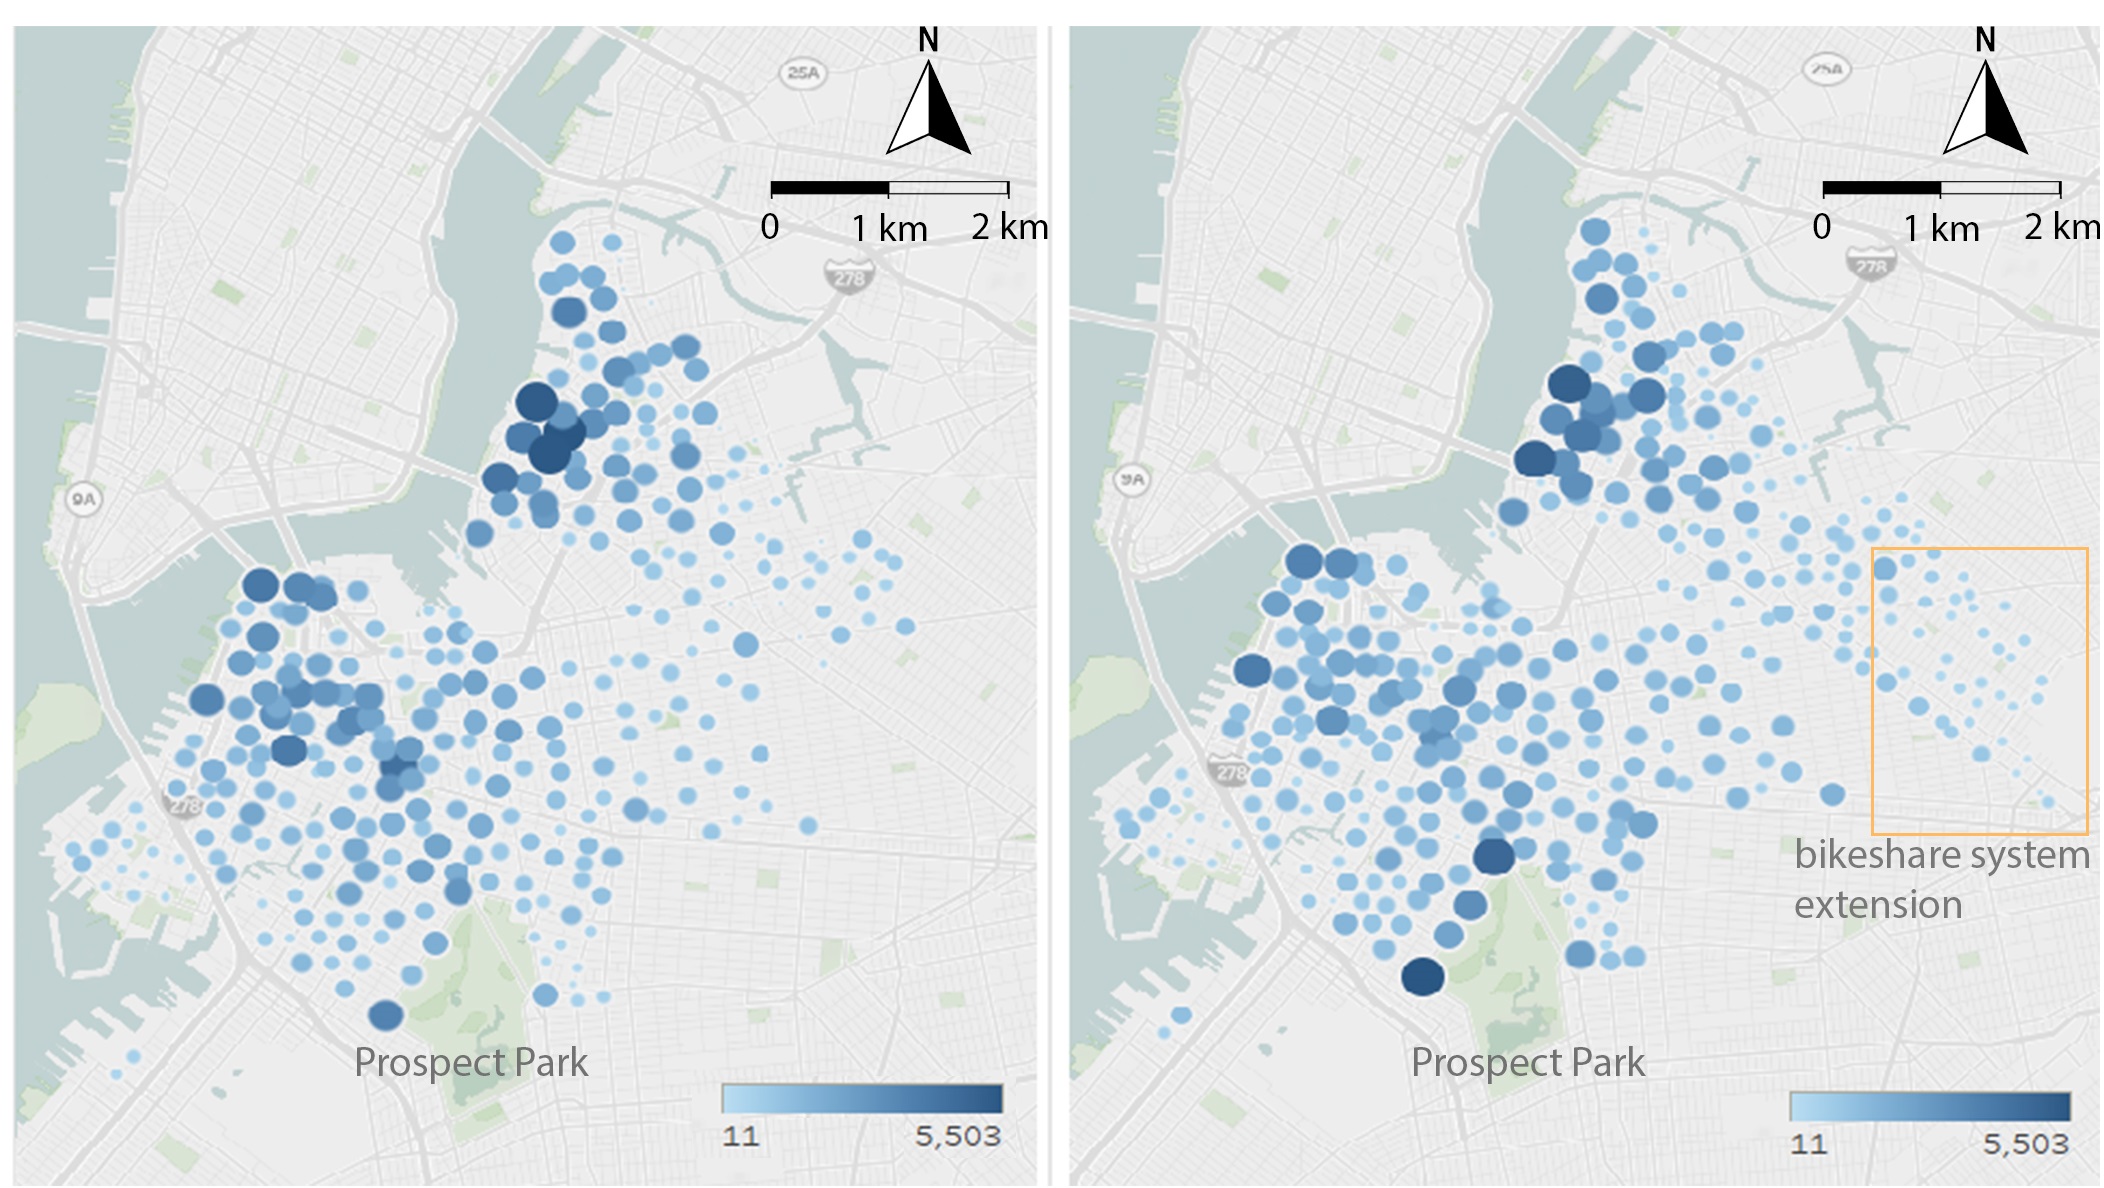
Figure 1 shows that bikeshare trips in Brooklyn dropped by 75% in late March when New York issued a stay-at-home order. Ridership gradually increased from late April to September, eventually surpassing ridership in the pre-COVID period in 2019. Figure 2 compares trip generation at the station level for the two months. Note that there was a small extension of the bikeshare system in the east of Brooklyn, generating 16,532 trips from these new stations in 2020; total ridership from the original set of stations was still larger than in 2019. We can also see higher bikeshare ridership around Prospect Park in 2020, suggesting more recreational trips being made.

Figure 1
Figure 1:Bikeshare trip counts in 2019 and 2020 in Brooklyn, and NYC COVID-19 daily cases (7-day moving average)

Data source: CitiBike (2020), NYC Health (2021).

Figure 2
Figure 2:Generated trips by station in Brooklyn

Left: Sept. 2019
Right: Sept. 2020

Figure 3
Figure 3:Top 30 trips taken in Brooklyn, broken down by OD and loop trips

Left: Sept. 2019
Right: Sept. 2020

Figure 4
Figure 4:Histogram of trip durations of casual user trips and subscriber trips , September 2019 & 2020
Table 2.Difference in land use percents for trip origins and destinations between 2019 and 2020.
Difference in land use percents from 2019 to 2020: all trips Difference in land use percents from 2019 to 2020: subscriber trips Difference in land use percents from 2019 to 2020: casual user trips
Origin land use Origin land use Origin land use
Destination land use M O R T U M O R T U M O R T U
M -2.1% -0.4% -1.6% -0.2% 0.0% -2.0% -0.3% -1.7% 0.1% 0.0% -2.2% -0.8% -0.5% -1.2% 0.0%
O -0.5% 0.3% 0.7% 0.0% 0.0% -0.4% 0.3% 0.9% 0.1% 0.0% -1.0% -0.2% 0.1% -0.5% 0.0%
R -1.7% 0.8% 3.3% 0.4% 0.0% -1.9% 1.0% 1.7% 0.5% 0.0% -0.6% 0.3% 9.4% -0.3% -0.1%
T -0.3% -0.1% 0.7% 0.7% 0.0% 0.0% 0.0% 0.7% 0.9% 0.0% -1.3% -0.5% 0.4% -0.6% 0.0%
U 0.0% 0.0% 0.0% 0.0% 0.0% 0.0% 0.0% 0.0% 0.0% 0.0% -0.1% 0.0% 0.0% -0.1% 0.0%

Note: M: mixed land use, commercial, office, public land use; O: open space/recreational land use; R: residential land use; T: industrial, transportation & parking land use; U: other/unknown land use

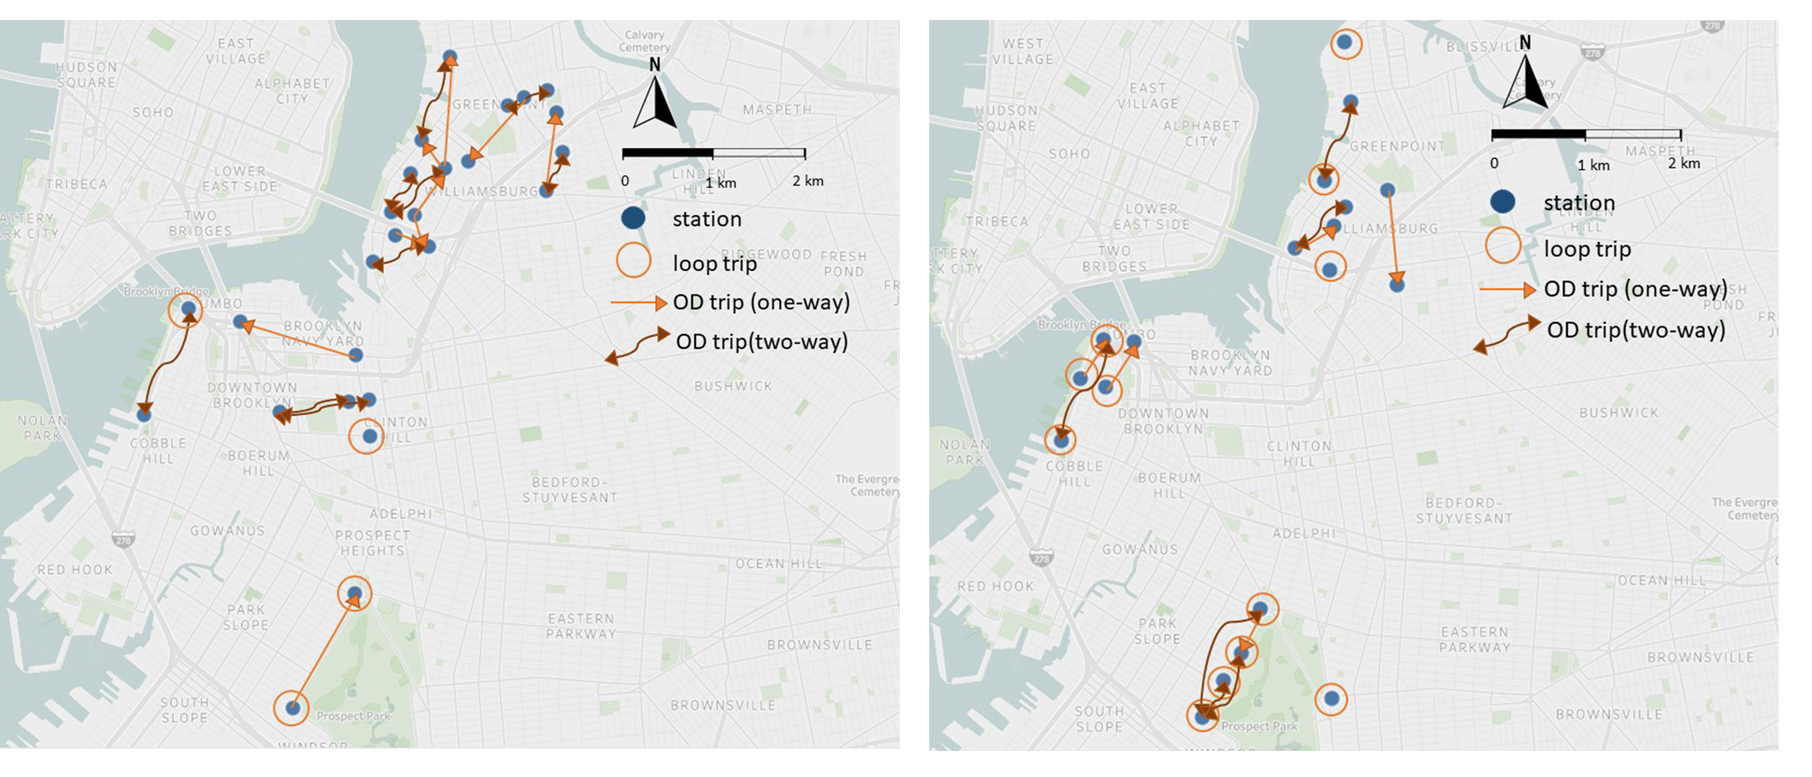
The top 30 trips (between and returning to stations) in September 2019 and 2020 account for 2.41% and 2.18% of the total trips, respectively. These trips include both those between an origin and destination (OD) and starting and ending at the same station (what we call “loop” trips). The top ranked trip started from and ended at West Drive & Prospect Park West, and was most likely a recreational trip in Prospect Park. Most of the top 30 trips in 2019 are OD trips and occurred in Downtown Brooklyn and Williamsburg, while most of the top 30 trips in 2020 are loop trips and occurred around Prospect Park. This change indicates a possible shift from work trips to leisure trips.

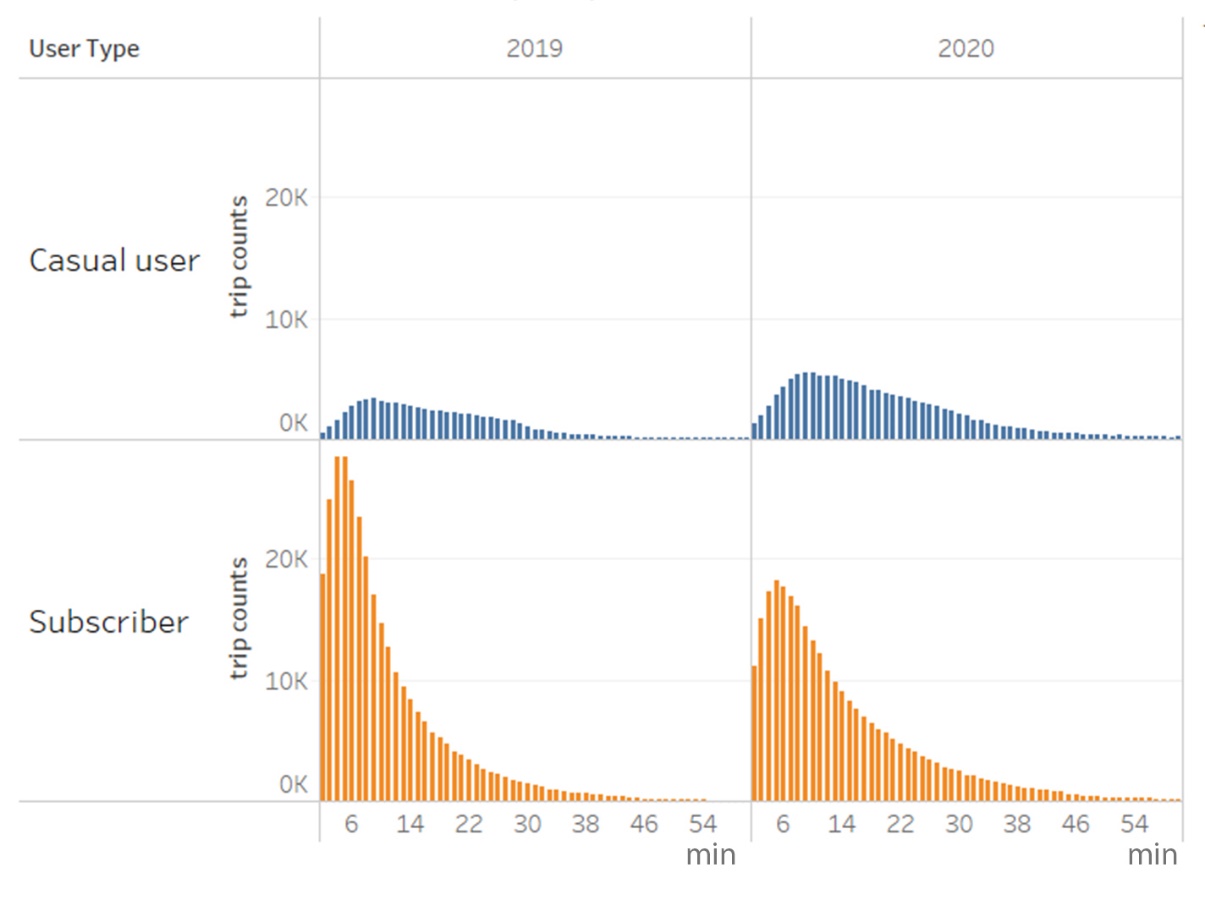
More trips were taken by casual users in September 2020 compared to September 2019 (32.49% vs. 19.08%); the fraction of subscriber trips decreased from 80.92% to 67.51%. Subscribers tend to be commuters while casual users tend to use the bikes for recreational trips (Noland, Smart, and Guo 2019) . As shown in Figure 3, trips in September 2020 have longer durations than in September 2019, increasing from a median of 9 minutes to 13 minutes. Both casual user trips and subscriber trips increased in duration. This could be due to a shift from public transit which would normally be used for longer trips.

Finally, we analyze how the land uses at origins and destinations associated with trips changed. Table S1 in our supplemental file presents the fraction of trips between our land use categories for both 2019 and 2020, as well as the change due to the pandemic. The difference in the percents is shown in Table 2 for all trips, subscriber trips, and casual user trips, with differences over 1.5% in bold. While overall, changes were minor, the largest increase for all trips was from one residential area to another (3.3% increase). Reductions occurred primarily with trips associated with mixed/commercial/office/public land use (M), and in particular M to M trips and those between M and R land use categories. This pattern of change is suggestive of fewer work-related trips. Changes in subscriber trips mirror those of all trips. However, for casual user trips there is a large increase in R to R trips (between residential land uses), again suggesting many trips not associated with commute patterns. Overall, results suggest a shift towards more recreational and longer trips and fewer work-related trips.

Submitted: December 18, 2020 AEST

Accepted: January 12, 2021 AEST

References

CitiBike. 2020. “Citi Bike System Data.” 2020. https://www.citibikenyc.com/system-data.
Department of City Planning, N. Y. C. 2020. “PLUTO and MapPLUTO.” 2020. https://www1.nyc.gov/site/planning/data-maps/open-data/dwn-pluto-mappluto.page.
Noland, Robert B, Michael J Smart, and Ziye Guo. 2019. “Bikesharing Trip Patterns in New York City: Associations with Land Use, Subways, and Bicycle Lanes.” International Journal of Sustainable Transportation 13 (9): 664–74.
Google Scholar
NYC Health. 2021. “Latest Data.” https://www1.nyc.gov/site/doh/covid/covid-19-data.page,.
Pase, Francesco, Federico Chiariotti, Andrea Zanella, and Michele Zorzi. 2020. “Bike Sharing and Urban Mobility in a Post-Pandemic World.” IEEE Access 8: 187291–306.
Google Scholar
Teixeira, João Filipe, and Miguel Lopes. 2020. “The Link between Bike Sharing and Subway Use during the COVID-19 Pandemic: The Case-Study of New York’s Citi Bike.” Transportation Research Interdisciplinary Perspectives 6: 100166.
Google Scholar
Tokey, Ahmad Ilderim. 2020. “Change of Bike-Share Usage in Five Cities of United States during COVID-19.” Findings. https://doi.org/10.32866/001c.17851.
Google Scholar
Wang, Haoyun, and Robert B. Noland. 2021. “Bikeshare and Subway Ridership Changes During the COVID-19 Pandemic in New York City.” In Transportation Research Board 100th Annual Meeting.
Google Scholar

Powered by Scholastica, the modern academic journal management system