Loading [Contrib]/a11y/accessibility-menu.js
Skip to main content
null
Findings
  • Menu
  • Articles
    • Energy Findings
    • Resilience Findings
    • Safety Findings
    • Transport Findings
    • Urban Findings
    • All
  • For Authors
  • Editorial Board
  • About
  • Blog
  • covid-19
  • search

RSS Feed

Enter the URL below into your favorite RSS reader.

http://localhost:57280/feed
Transport Findings
January 12, 2021 AEST

The Impact of Introducing Low Traffic Neighbourhoods on Road Traffic Injuries

Anthony A Laverty, Rachel Aldred, Anna Goodman,
road traffic injuriesmodal filtertraffic calminglow traffic neighbourhoodmotor traffic reduction
Copyright Logoccby-sa-4.0 • https://doi.org/10.32866/001c.18330
Findings
Laverty, Anthony A, Rachel Aldred, and Anna Goodman. 2021. “The Impact of Introducing Low Traffic Neighbourhoods on Road Traffic Injuries.” Findings, January. https:/​/​doi.org/​10.32866/​001c.18330.
Save article as...▾
Download all (3)
  • Figure 1: Modal filter in the London borough of Waltham Forest (Rachel Aldred)
    Download
  • Figure 2: The low traffic neighbourhoods considered in the London Borough of Waltham Forest
    Download
  • Supplemental Information
    Download

Sorry, something went wrong. Please try again.

If this problem reoccurs, please contact Scholastica Support

Error message:

undefined

View more stats

Abstract

We examine the impact on road traffic injuries of introducing low traffic neighbourhoods in Waltham Forest, London. Using Stats19 police data 2012-2019, we find a three-fold decline in number of injuries inside low traffic neighbourhoods after implementation, relative to the rest of Waltham Forest and the rest of Outer London. We further estimate that walking, cycling, and driving all became approximately 3-4 times safer per trip. There was no evidence that injury numbers changed on boundary roads. Our findings suggest that low traffic neighbourhoods reduce injury risks across all modes inside the neighbourhood, without negative impacts at the boundary.

RESEARCH QUESTION

Road traffic injuries are a significant threat to health (Public Health England 2018). Low traffic neighbourhoods (LTNs) are schemes that remove through motor traffic from residential streets using ‘modal filter’ measures such as planters or lockable bollards (Figure 1). By reducing motor vehicle volumes, LTNs are expected to reduce the risk per trip to people walking or cycling (Aldred et al. 2018) - although we know of no empirical evidence. Impacts on absolute injury numbers are less obvious, given evidence that LTNs prompt a mode shift away from cars (Aldred and Goodman 2020; Goodman, Urban, and Aldred 2020), and given that car occupants experience a lower per-mile injury risk than walking and cycling (Department for Transport 2018). It is also important to consider impacts on boundary roads, which may at least initially see some increase in motor traffic, although potentially mitigated by reduced conflict at junctions.

Figure 1
Figure 1:Modal filter in the London borough of Waltham Forest (Rachel Aldred)

Here we examine how LTNs introduced in 2015 and 2016 by the London Borough of Waltham Forest affected numbers of road traffic injuries inside the LTNs and at the boundaries.

METHODS AND DATA

We used 2012-2019 police injury data (“Stats19”). This gives information on the travel mode and injury severity of road traffic casualties, plus detailed geographical coordinates for the crash location (Department for Transport 2020). Our primary outcome was number of casualties of any severity, both in total and by casualty mode of travel. We present secondary analyses examining killed or seriously injured (KSI).

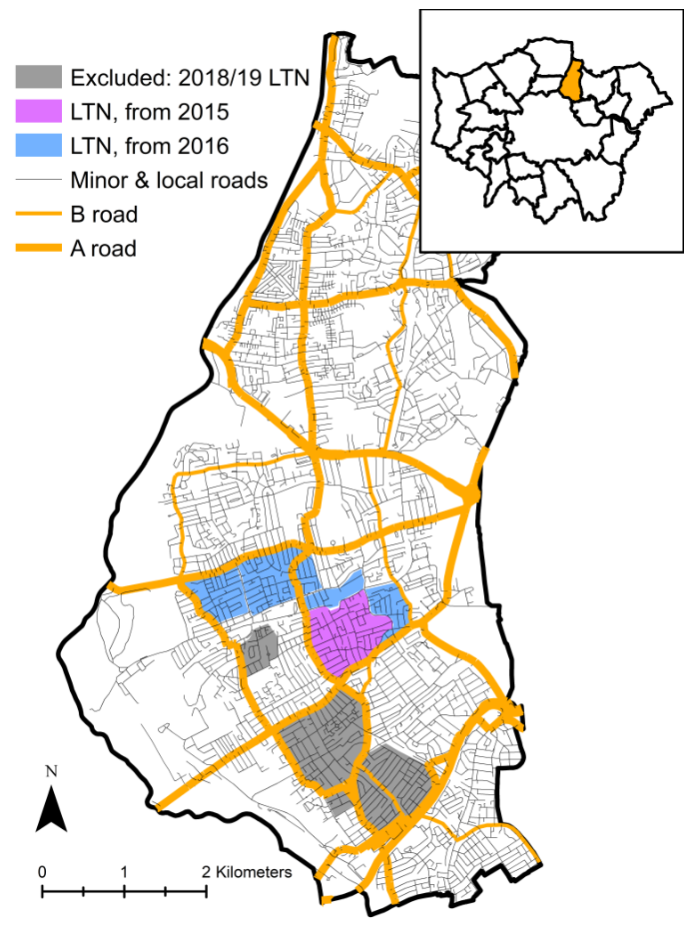
We focus on LTNs introduced between September 2015 and June 2016. After mapping the boundaries of these LTNs (Figure 2), we assigned all nearby road traffic injuries into two mutually-exclusive LTN groups:

  1. Injuries inside the LTN, defined as injuries at least 25m inside the LTN boundary, and not recorded as being at the intersection with a boundary road.

  2. Injuries at the LTN boundary, defined being located from 25m inside to 50m outside the LTN boundary.

We made pre/post comparisons of injury numbers in these LTN groups between January 2012-August 2015 (‘pre’) versus July 2016-December 2019 (‘post’). We compared trends in these LTN groups to trends in injuries elsewhere in a) Waltham Forest and b) Outer London using Fisher’s exact chi-squared tests. Injuries in parts of Waltham Forest that became an LTN in 2018/2019 were excluded (both pre and post) from comparisons (Figure 2).

Figure 2
Figure 2:The low traffic neighbourhoods considered in the London Borough of Waltham Forest

LTN = low traffic neighbourhood. The main map shows the London Borough of Waltham Forest. The inset map shows Waltham Forest within Outer London. In our research we consider injuries inside or at the boundary of LTNs introduced September 2015 to June 2016. We excluded from analysis areas, marked grey, that subsequently received LTNs in 2018 or 2019, as these areas do not yet have sufficient post-intervention period to allow meaningful analysis.

As there were no A (primary) or B (distributor) roads inside our LTNs[1], we compared injuries inside the LTNs with comparison group injuries excluding A or B roads. We compared injuries at the LTN boundaries with comparison group injuries on any road type, but confirmed that our findings were very similar when restricted to injuries on A and B roads only (Supplemental Information 1).

Following this assessment of changes in absolute injury numbers, we assess likely changes in injury risk. For this we draw on previous work that estimates changes in levels of walking, cycling, and driving following the implementation of the LTNs.

FINDINGS

Inside the LTNs, injury numbers fell three-fold in the post period relative to the pre period (0.31 ratio relative to both Waltham Forest and Outer London, p<0.01, Table 1). Walking and cycling injury numbers fell two- to three-fold relative to both comparison groups (e.g. ratio 0.45, p=0.06, for numbers of pedestrian casualties relative to the rest of Waltham Forest). Numbers of car driver or passenger injuries decreased relative to both comparison groups (e.g. ratio 0.14, p<0.01, relative to the rest of Waltham Forest).

Table 1:Pre-/post injury numbers inside the LTNs versus the rest of Waltham Forest and Outer London
LTN versus Waltham Forest LTN versus Outer London
Number inside the LTN Number elsewhere in Waltham Forest Ratio p-value Number inside the LTN Number elsewhere in Outer London Ratio p-value
Casualty using any mode Pre 51 469 0.31 <0.01 51 16,003 0.31 <0.01
Post 18 572 18 18,358
Pedestrian casualty Pre 16 129 0.45 0.06 16 3,428 0.41 0.04
Post 8 153 8 4,157
Cyclist casualty Pre 9 59 0.35 0.08 9 1,526 0.42 0.17
Post 4 83 4 1,611
Car driver or passenger casualty Pre 22 221 0.14 <0.01 22 8,203 0.12 <0.01
Post 3 228 3 9,195

LTN = low traffic neighbourhood. Injuries are limited to those that are neither on an A or B road, nor at the intersection with an A or B road. All injury severities are included, including slight injuries. Ratios calculated as ‘% injuries inside LTNs in post period’/‘% injuries inside LTNs in pre period’. P-values calculated using Fisher’s Exact chi-squared tests.

We did not identify any changes in injury numbers at the LTN boundaries (e.g. ratio 0.99 ratio for number of casualties travelling by any mode, p=0.94, relative to the rest of Waltham Forest (Table 2).

Table 2:Pre-/post injury numbers at the LTN boundaries versus the rest of Waltham Forest and Outer London
LTN versus Waltham Forest LTN versus Outer London
Number at LTN boundaries Number elsewhere in Waltham Forest Ratio p-value Number at LTN boundaries Number elsewhere in Outer London Ratio p-value
Casualty using any mode Pre 418 2,128 0.99 0.94 418 58,858 1.01 0.84
Post 433 2,222 433 60,096
Pedestrian casualty Pre 91 352 1.08 0.53 91 9,782 1.12 0.44
Post 112 391 112 10,743
Cyclist casualty Pre 86 266 0.79 0.12 86 5,858 0.85 0.33
Post 66 275 66 5,317
Car driver or passenger casualty Pre 150 1,100 1.05 0.71 150 29,909 1.04 0.77
Post 155 1,081 155 29,836

LTN = low traffic neighbourhood. Results were very similar when we limited our analysis to injuries that were on an A or B road, or at the intersection with an A or B road (see Supplemental Information 1). All injury severities are included, including slight injuries. Ratios calculated as ‘% injuries at LTN boundaries in post period’/‘% injuries at LTN boundaries in pre period’. P-values calculated using Fisher’s Exact chi-squared tests.

Analyses of KSI showed similar patterns both inside the LTNs and at the boundaries, but small numbers meant that power was extremely limited, and no changes were statistically significant. For example, the number of KSI fell from 7 pre to 3 post inside the LTNs, ratio 0.43, p=0.23, relative to the rest of Waltham Forest (Supplemental Information 1).

These analyses do not attempt to control for changes in travel patterns. Hence, they do not estimate risk to an individual, e.g. risk per trip. Inside the LTNs, survey evidence points to increased duration of walking (+29%) and cycling (+51%) by residents between 2016 and 2019 (see Aldred and Goodman 2020, and Supplemental Information 2). It is likely that the relative increase in active travel is even greater for travel inside the intervention area and so plausible that risk per hour travelled has reduced three- to four-fold for walking and cycling inside the LTNs.

Conversely, there were substantial reductions in motor vehicle traffic inside the LTNs. For example, traffic counts inside the 2015 LTN area indicate that the number of motor vehicle trips fell 56% from February 2014 to July 2016 (London Borough of Waltham Forest 2020). If this is typical, then the seven-fold reduction in numbers of car occupant injuries may approximately correspond to a four-fold reduction in risk per trip.

The trend at the LTN boundaries may also be more favourable on a per trip basis if these roads saw an increase in walking, cycling, and motorised travel. This is plausible for active travel given a) increased levels of walking and cycling among local residents in general and b) several boundary roads received walking and cycling interventions (e.g. new crossings and cycle tracks) in parallel to the LTNs. It is plausible for car travel given that, although there seems to have been substantial evaporation of motor traffic, some boundary roads did see an increase compared to years immediately before the interventions (London Borough of Waltham Forest 2020).

In summary, both absolute injury numbers and injury risk decreased substantially inside the LTNs. The estimated improvement in walking and cycling safety (three to four-fold for risk) would bring the UK into line with the best European countries (Castro, Kahlmeier, and Gotschi 2018). LTNs should be seen as an intervention that improves road safety as well as improving health through increased physical activity (see Aldred and Goodman 2020). Simultaneously intervening on boundary roads (e.g. building cycle tracks) may further enhance safety improvements.


ACKNOWLEDGEMENTS

AL is funded by National Institute of Health Research (NIHR) School for Public Health Research.


  1. Definition of road classes in the UK: https://www.gov.uk/government/publications/guidance-on-road-classification-and-the-primary-route-network/guidance-on-road-classification-and-the-primary-route-network

Submitted: December 05, 2020 AEST

Accepted: December 13, 2020 AEST

References

Aldred, Rachel, and Anna Goodman. 2020. “Low Traffic Neighbourhoods, Car Use, and Active Travel: Evidence from the People and Places Survey of Outer London Active Travel Interventions.” Findings. https:/​/​doi.org/​10.32866/​001c.17128.
Google Scholar
Aldred, Rachel, Anna Goodman, John Gulliver, and James Woodcock. 2018. “Cycling Injury Risk in London: A Case-Control Study Exploring the Impact of Cycle Volumes, Motor Vehicle Volumes, and Road Characteristics Including Speed Limits.” Accident Analysis and Prevention. https:/​/​doi.org/​10.1016/​j.aap.2018.03.003.
Google ScholarPubMed
Castro, A., S. Kahlmeier, and T. Gotschi. 2018. “Exposure-Adjusted Road Fatality Rates for Cycling and Walking in European Countries, International Transport Forum Discussion Paper, No. 2018-05.” Paris: Organisation for Economic Co-operation and Development (OECD), International Transport Forum. https:/​/​www.itf-oecd.org/​sites/​default/​files/​docs/​exposure-adjusted-road-fatality-rates-cycling-walking-europe.pdf.
Department for Transport. 2018. Pedal Cycling Road Safety Factsheet. London: DfT. https:/​/​assets.publishing.service.gov.uk/​government/​uploads/​system/​uploads/​attachment_data/​file/​686969/​pedal-cycle-factsheet-2017.pdf.
Google Scholar
———. 2020. “Stats19 Police Road Injury Datasets.” https:/​/​data.gov.uk/​dataset/​cb7ae6f0-4be6-4935-9277-47e5ce24a11f/​road-safety-data.
Goodman, Anna, Scott Urban, and Rachel Aldred. 2020. “The Impact of Low Traffic Neighbourhoods and Other Active Travel Interventions on Vehicle Ownership: Findings from the Outer London Mini-Holland Programme.” Findings, December. https:/​/​doi.org/​10.32866/​001c.18200.
Google Scholar
London Borough of Waltham Forest. 2020. “Comparison of Vehicle Numbers before and after the Scheme and during the Trial.” 2020. http:/​/​enjoywalthamforest.co.uk/​work-in-your-area/​walthamstow-village/​comparison-of-vehicle-numbers-before-and-after-the-scheme-and-during-the-trial/​.
Public Health England. 2018. “Reducing Unintentional Injuries on the Roads among Children and Young People under 25 Years.” 2018. https:/​/​assets.publishing.service.gov.uk/​government/​uploads/​system/​uploads/​attachment_data/​file/​695781/​Reducing_unintentional_injuries.

This website uses cookies

We use cookies to enhance your experience and support COUNTER Metrics for transparent reporting of readership statistics. Cookie data is not sold to third parties or used for marketing purposes.

Powered by Scholastica, the modern academic journal management system