Loading [Contrib]/a11y/accessibility-menu.js
Skip to main content
null
Findings
  • Menu
  • Articles
    • Energy Findings
    • Resilience Findings
    • Safety Findings
    • Transport Findings
    • Urban Findings
    • All
  • For Authors
  • Editorial Board
  • About
  • Blog
  • covid-19
  • search

RSS Feed

Enter the URL below into your favorite RSS reader.

https://findingspress.org/feed
Transport Findings
December 23, 2020 AEST

Returning to Public Transit after an Epidemic

Robin Rauws, Dea van Lierop,
covid-19corona viruspublic transitchoicecaptivecaptive-by-choiceloyaltymode-shift
Copyright Logoccby-sa-4.0 • https://doi.org/10.32866/001c.18328
Photo by Martin Woortman on Unsplash
Findings
Rauws, Robin, and Dea van Lierop. 2020. “Returning to Public Transit after an Epidemic.” Findings, December. https:/​/​doi.org/​10.32866/​001c.18328.
Save article as...▾
Download all (6)
  • Figure 1. The expected travel behavior of respondents per travel mode when the COVID-19 measures are no longer in effect, in % (n = 829). For every travel mode only those who were expecting to actually use that travel mode were considered. The n-value is therefore not the same for every travel mode.
    Download
  • Figure 2. The expected travel behavior of respondents per travel mode when the COVID-19 measures are no longer in effect, in % (n = 625). Only the respondents that in the survey mentioned to have expectations about their future use of public transportation were considered here. Respondents who could not predict their expected use of public transportation, or who did not use public transportation, were left out. For every travel mode only those who were expecting to actually use that travel mode were considered. The n-value is therefore not the same for every travel mode.
    Download
  • Figure 3. The expected use of public transportation of different groups of respondents when the COVID-19 measures are no longer in effect, in % (n = 625). Only the respondents that in the survey mentioned to have expectations about their future use of public transportation were considered here. Respondents who could not predict their expected use of public transportation, or who did not use public transportation anyways, were left out.
    Download
  • Table 2. Model of the performed logistic regression analysis for all respondents. The model was built up per sub model. The left column shows the variables. The right column shows per sub model the value of the beta coefficient for each variable and whether the variable has a significant effect on the model. The regression category is ‘(expected travel with public transportation is) not less’ (n = 532)
    Download
  • Table 3. Model of the performed logistic regression analysis for the group of frequent public transportation users. The model was built up per sub model. The left column shows the variables. The right column shows per sub model the value of the beta coefficient for each variable and whether the variable has a significant effect on the model. The regression category is ‘(expected travel with public transportation is) not less’ (n = 211)
    Download
  • Figure 4. Conceptual model based on the literature (left) and a conceptual model based on the results of the present study
    Download

Sorry, something went wrong. Please try again.

If this problem reoccurs, please contact Scholastica Support

Error message:

undefined

View more stats

Abstract

The present study assesses the effect of COVID-19 related measures on public transit loyalty distinguishing between captive, choice and captive-by-choice riders. Results demonstrate that, due to fear of infection, users expect to use public transit less than before the onset of COVID-19 and report expected increases in the use of (electric) bicycles, (shared) cars and scooters. In addition, car ownership, gender, travel frequency and the possibility to work from home are other significant drivers of public transit loyalty. These findings contrast with research conducted pre-COVID-19, in which user satisfaction was commonly the most important driver of loyalty.

Research question and hypothesis

The measures taken by the Dutch government to battle COVID-19 have influenced public life, leaving public transit with ridership loss. This decline in usage today has implications for customer loyalty in the future. Previous studies by Lau et al. (2003) and by Wang (2014) revealed that an epidemic can affect the loyalty of users for at least up to a year after the end of an epidemic. However, the existing literature is mostly about the use of public transportation during an epidemic without considering specific factors that affect users’ intended loyalty, defined as one’s expected future use of public transit. This raises the questions:

  • How do the COVID-19 measures implemented across public transit agencies in Utrecht, the Netherlands, influence customer loyalty? And, how does this vary amongst captive, choice, and captive-by-choice transit riders?

Methods and data

The province of Utrecht, being the central mobility hub of the Netherlands, serves as a case study. As a result of COVID-19 and the related measures, public transit use in the Netherlands dropped by 85% on average in April 2020, compared to April 2019 (Translink 2020).

Data was collected for three weeks in May 2020 using an online survey administered by the Province of Utrecht and designed by the authors of this study in collaboration with Moventem, a local consulting firm. Approximately 50% of the respondents were recruited through a panel; the other half responded to the survey through the Province’s website and social media outlets. A total of 829 valid responses were collected from inhabitants of the province. The survey asked participants to report their pre-COVID-19 travel behavior and their expected post-pandemic public transit usage. Respondents were also asked to express their opinions about transit-related COVID-19 policy measures, the degree to which they experienced fear related to becoming infected, and their perceived service quality before the pandemic. Additionally, respondents reported several sociodemographic characteristics such as gender, age and occupation.

The sample was analyzed in two ways. Firstly, the data from transit users and non-users (non-frequent users without expectations about their future transit use) was analyzed altogether. Secondly, the sample was reduced to only those who used public transit as their main mode (see: Table 1). This group was divided into three types of public transit users, derived from Krizek and El-Geneidy (2007) and Van Lierop and El-Geneidy (2016):

  • Captive: do not have the resources to own a car; depend on public transit.

  • Choice: do own a car, but choose to use public transit as the main mode of travel.

  • Captive-by-choice: do have the resources to own a car, but choose not to buy one and rely on public transit.

Findings

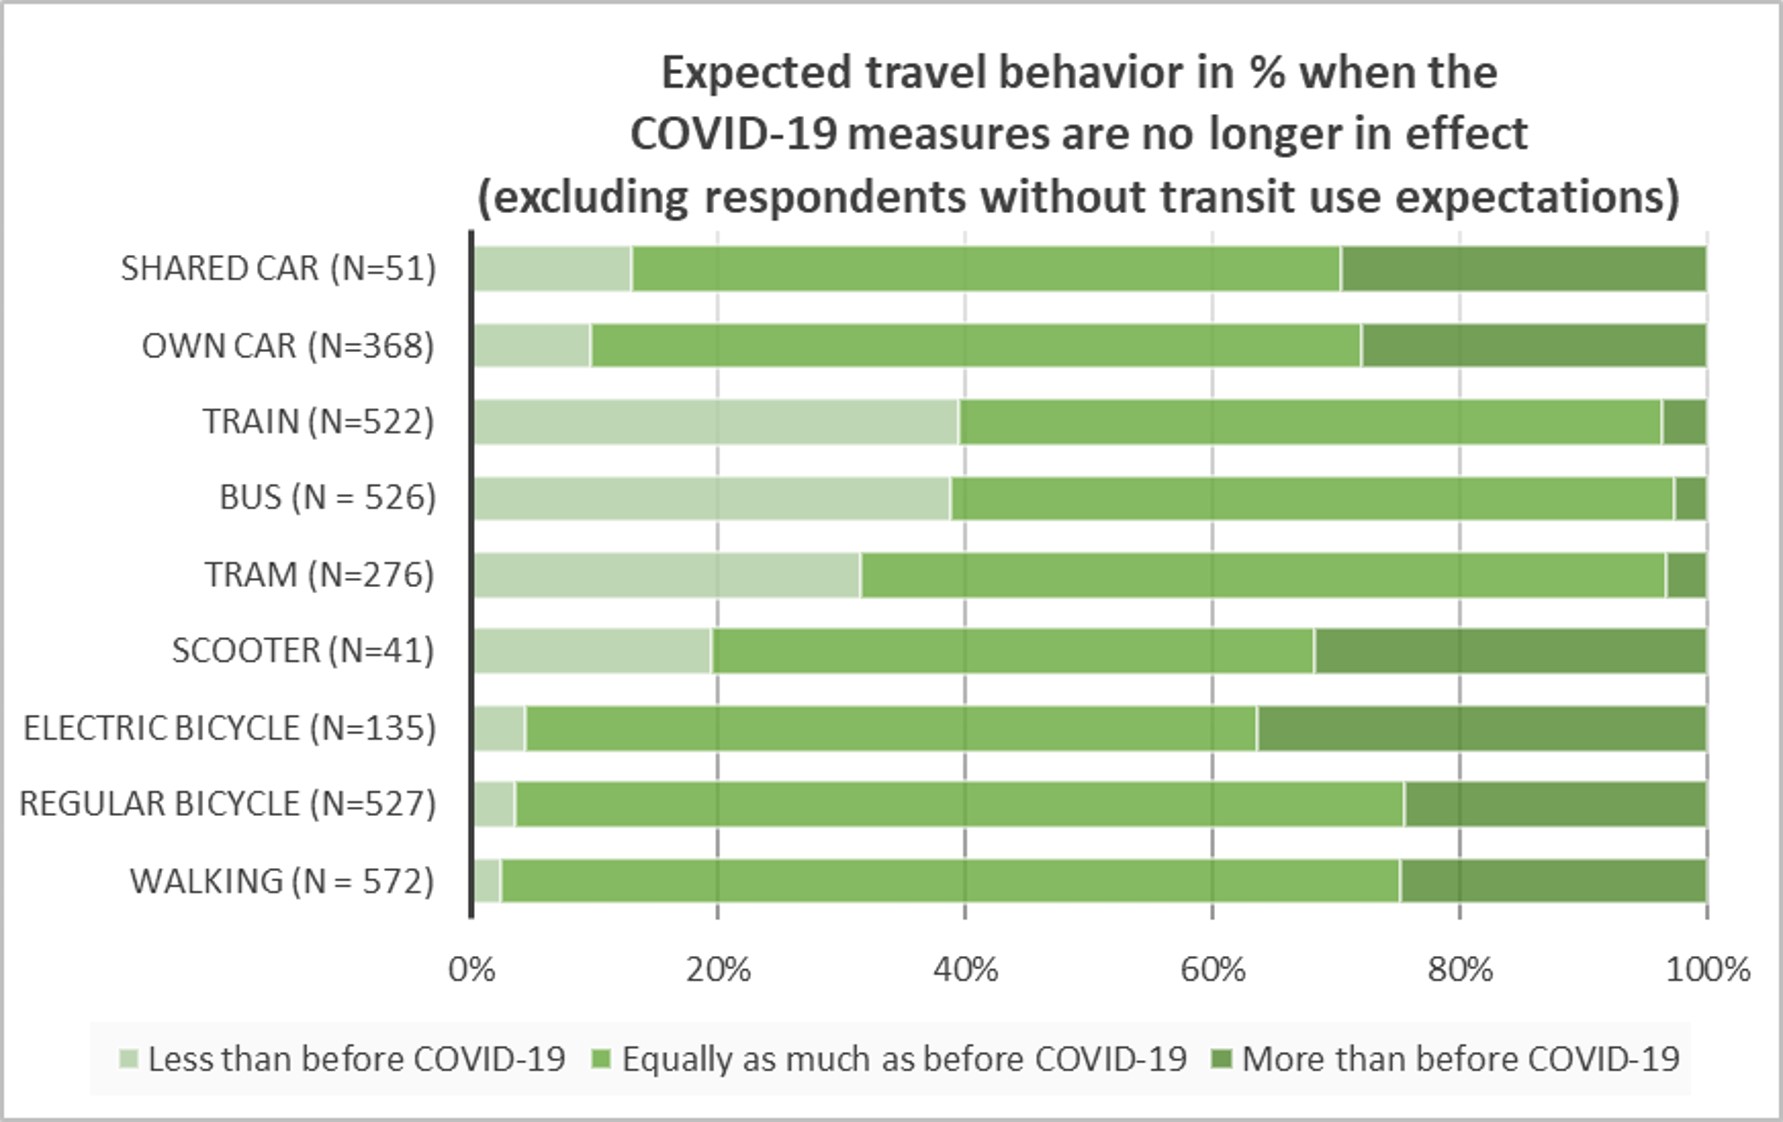
The majority of the survey respondents expect to use certain travel modes less frequently than in pre-COVID-19 times. Figure 1 shows the expected travel behavior when the COVID-19 measures are no longer in effect. Especially electric bicycles (n = 58, [32.4%]), shared cars (n = 18, [28.6%]) and scooters (n = 16, [28.6%]) are expected to be used more often. In contrast, trains (n = 206, [39.5%]), buses (n = 204, [38.8%]) and trams (n = 87, [31.5%]) are expected to be used less often; only a few respondents expect to use public transit more frequently.

Figure 1
Figure 1.The expected travel behavior of respondents per travel mode when the COVID-19 measures are no longer in effect, in % (n = 829). For every travel mode only those who were expecting to actually use that travel mode were considered. The n-value is therefore not the same for every travel mode.

These results also differ among the three different groups of frequent transit users. For example, train (n = 89, [34.1%]), bus (n = 87, [33.1%]) and tram (n = 34, [24.3%]) are also the travel modes that are often expected to be used less. However, there is a strong differentiation among the captive, choice and captive-by-choice users. This is especially the case for choice users, who expect to travel by public transit the least. In this group, 40.0% expects to use a shared car more often and 39.4% expects to travel more often using their own car. Captive and captive-by-choice users do not have the option of traveling with their own car and expect to increase their walking and cycling behavior.

Figure 2 shows the results for transit users only. The results are similar to figure 1, but differences exist in the expected increase of car usage and the use of electric bicycles. There is also a slight difference in the use of regular bicycles, where transit users expect to cycle more often than the average respondent.

Figure 2
Figure 2.The expected travel behavior of respondents per travel mode when the COVID-19 measures are no longer in effect, in % (n = 625). Only the respondents that in the survey mentioned to have expectations about their future use of public transportation were considered here. Respondents who could not predict their expected use of public transportation, or who did not use public transportation, were left out. For every travel mode only those who were expecting to actually use that travel mode were considered. The n-value is therefore not the same for every travel mode.

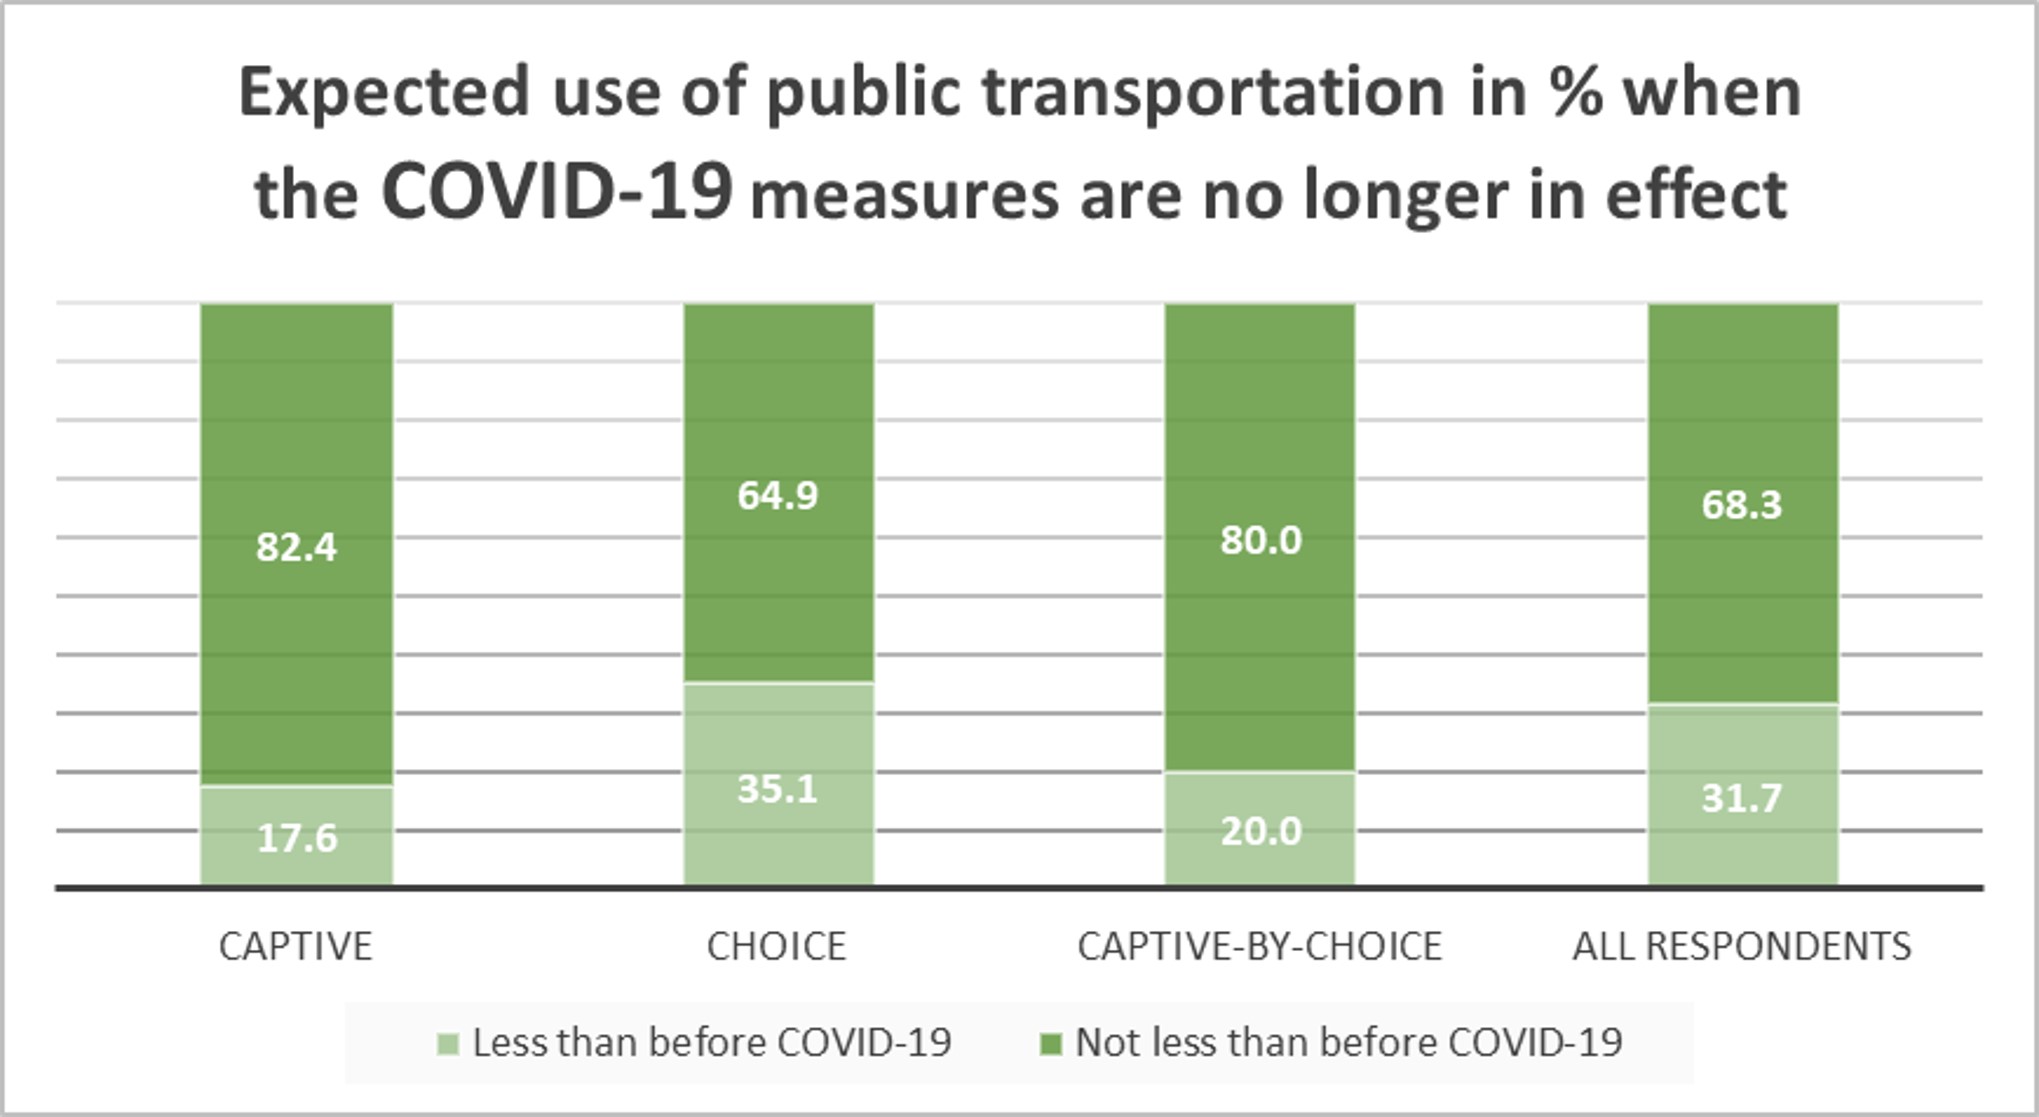
Figure 3 demonstrates that captive and captive-by-choice users expect to reduce their public transit use less than choice users.

Figure 3
Figure 3.The expected use of public transportation of different groups of respondents when the COVID-19 measures are no longer in effect, in % (n = 625). Only the respondents that in the survey mentioned to have expectations about their future use of public transportation were considered here. Respondents who could not predict their expected use of public transportation, or who did not use public transportation anyways, were left out.

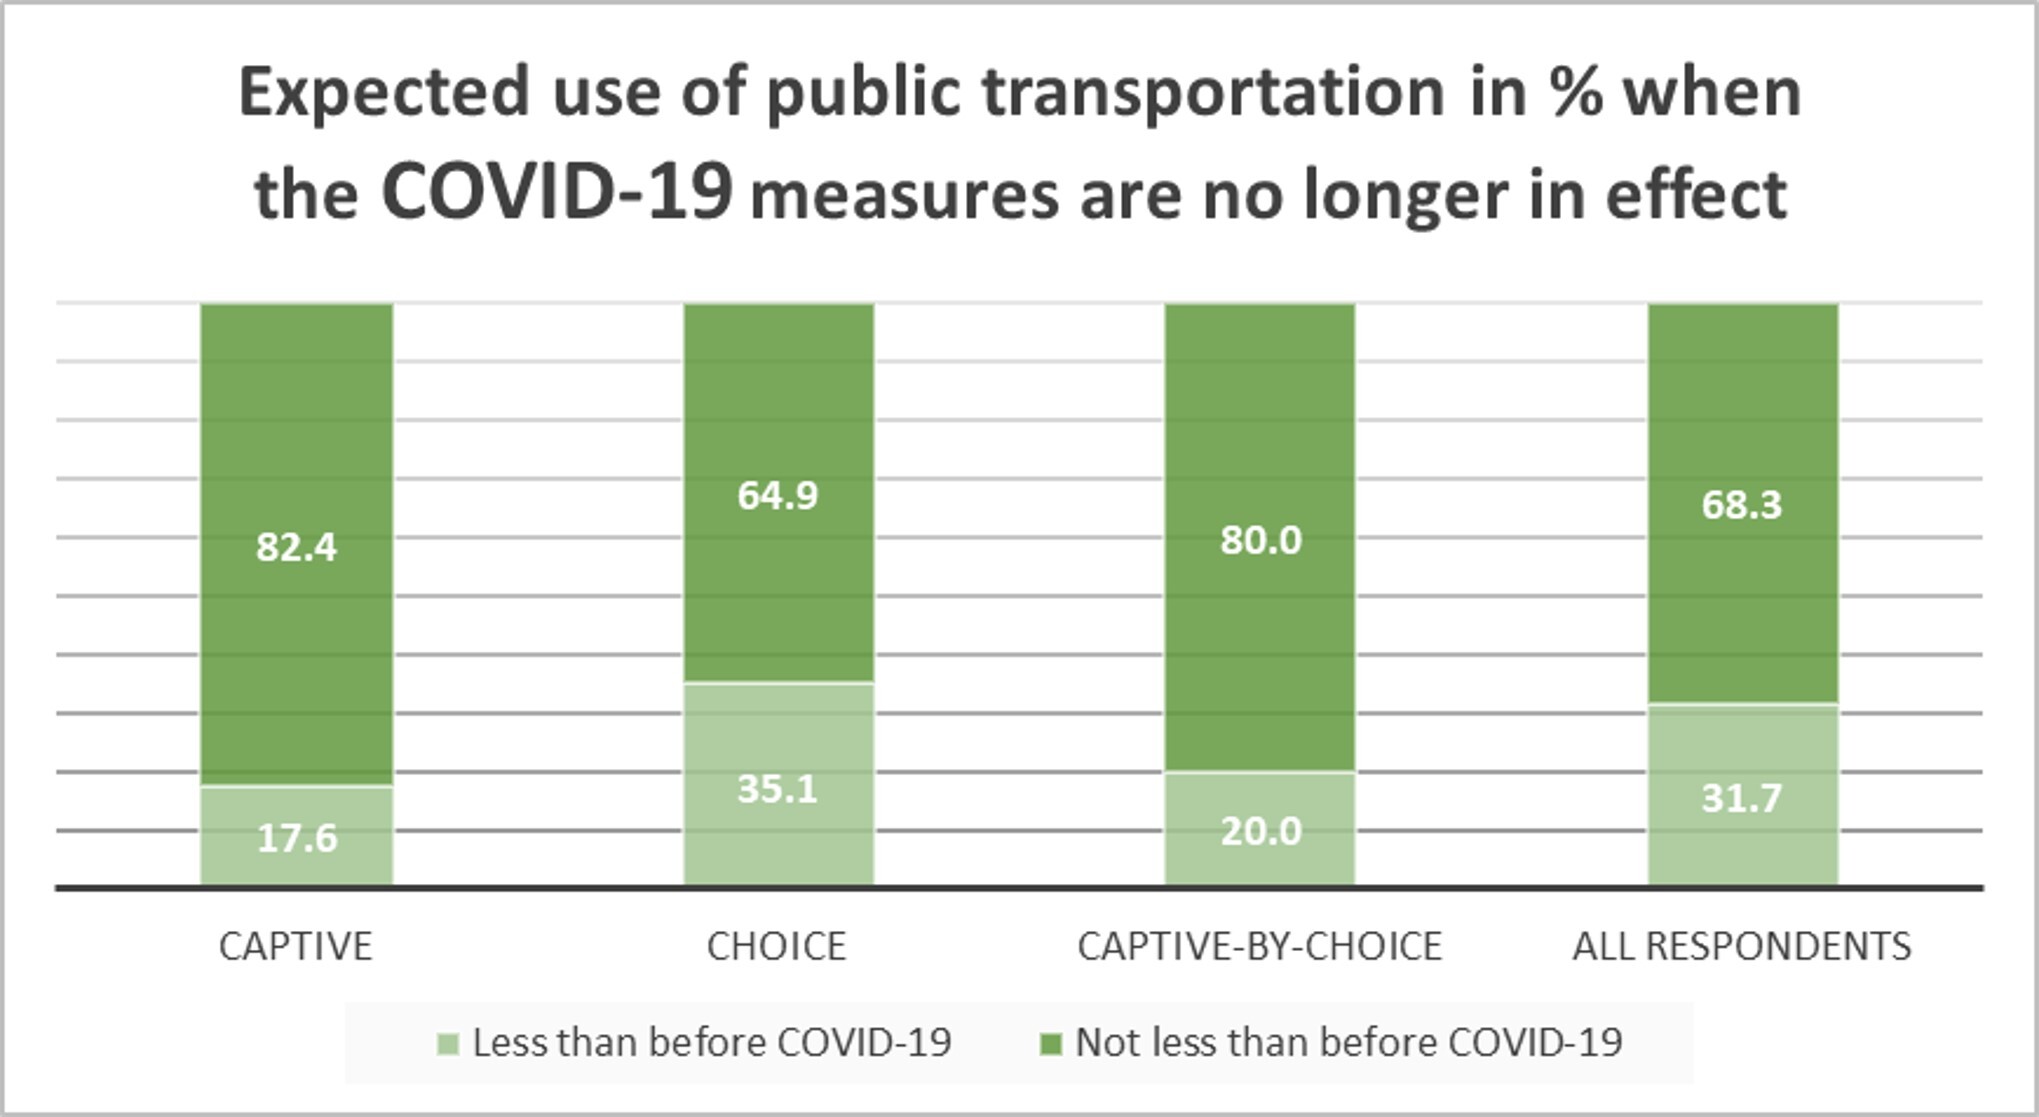
Table 1 shows demographic and transportation summary results for the full sample as well as for transit users only. The sample sizes for the models are smaller than the total number of participants due to the fact that in the models only data from respondents who stated their expectations about their future transit use were included. Demographic differences between all of the users and the sub-samples of transit users are expected, such as transit users having a lower average age, different modal distribution, and frequency of use.

Table 1.Demographics and transport mode use
Total n = 829 (%) All users used in model n = 532 (%) All transit users n = 625 (%) Transit users used in model (frequent users) n = 211 (%)
Gender
Male
Female
Other/rather not say

314 (38)
509 (61)
3 (1)

199 (37)
329 (62)
4 (1)

232 (37)
389 (62)
4 (1)

88 (42)
121 (57)
2 (1)
Age Younger than 30
30 – 60
Older than 60

121 (15)
558 (67)
150 (18)

101 (19)
341 (64)
90 (17)

109 (18)
409 (65)
107 (17)

60 (29)
124 (59)
27 (13)
Mode
Walking
Regular bicycle
Electric bicycle
Bus
Tram
Train
Own car
Other (e.g. scooter, taxi, carpool)

6 (1)
156 (19)
44 (5)
127 (15)
20 (2)
155 (19)
280 (34)
33 (4)

4 (1)
101 (19)
27 (5)
115 (22)
19 (4)
135 (25)
114 (21)
8 (2)

5 (1)
120 (19)
34 (6)
125 (20)
19 (3)
153 (25)
149 (24)
9 (1)

0 (0)
0 (0)
0 (0)
90 (43)
13 (6)
108 (43)
0 (0)
0 (0)
Car ownership 569 (69) 324 (61) 393 (63) 103 (49)
Possibility to work from home 432 (52) 298 (56) 349 (56) 151 (72)
Working/studying 656 (79) 424 (80) 496 (79) 211 (100)
Frequency public transportation use (pre COVID-19)
> 5 days a week
3 – 5 days a week
1 – 2 days a week
1 – 3 days a month
< 1 day a month
46 (6)
211 (26)
104 (13)
148 (18)
320 (39)
44 (8)
186 (35)
92 (17)
115 (13)
95 (18)
46 (7)
208 (33)
100 (16)
133 (21)
138 (22)
39 (19)
155 (74)
10 (5)
6 (3)
1 (1)

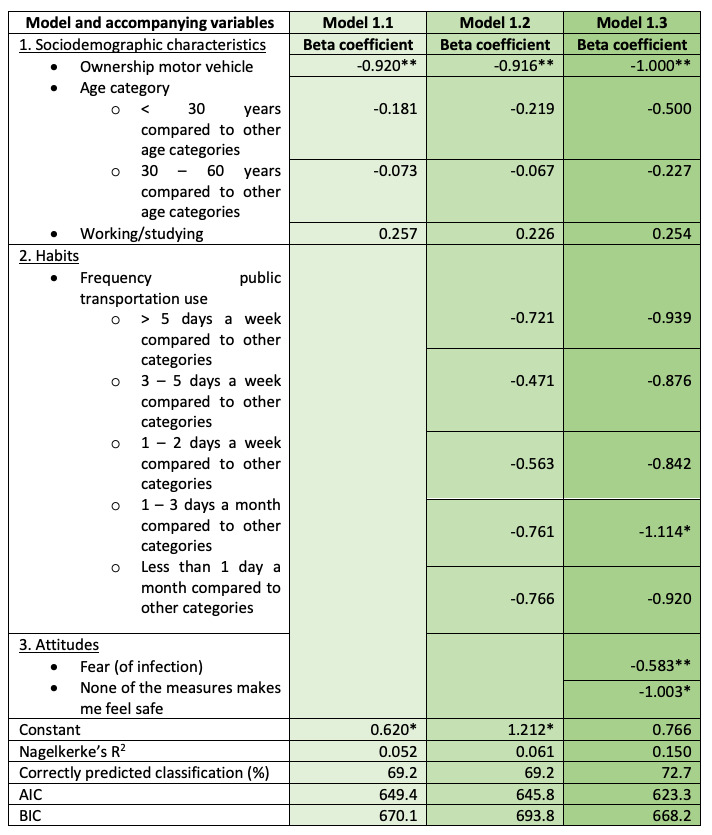
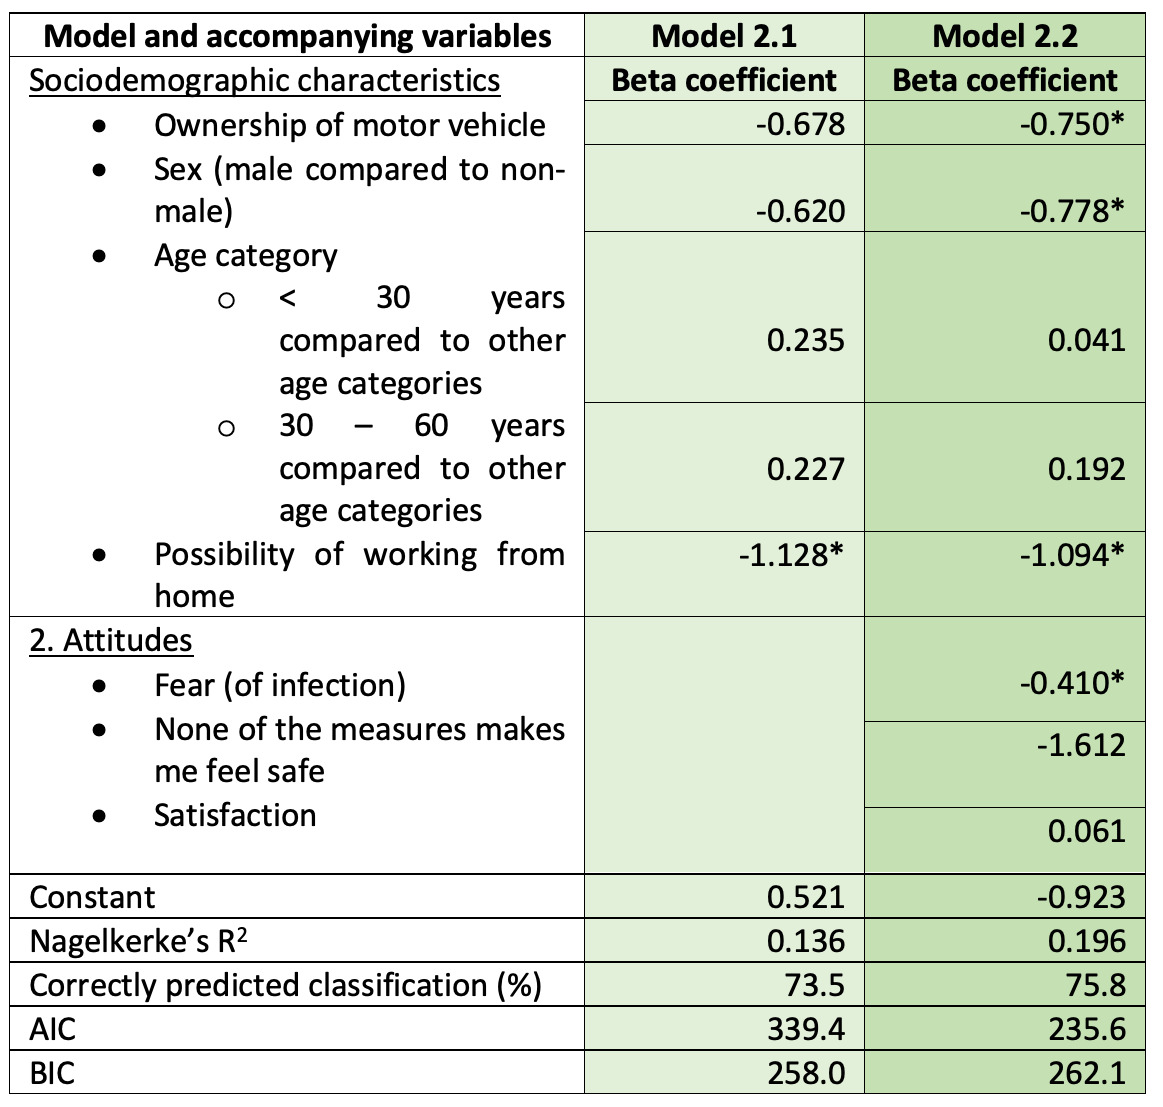
Based on the results of a logistic regression analysis, the factors that may impact loyalty to public transit are shown in table 2 (all respondents) and table 3 (regular, or frequent transit users). Owning a car is significant in both models, as is fear of infection. With regard to the expectation to travel by public transit, the odds of a frequent transit user who owns a car are 75% lower compared to a frequent transit user who does not own a car. This means that car owners are less likely to use public transit, given the circumstances. Similarly, the odds of a frequent transit user to use public transit are 41% lower when they experience fear of infection (model 2.2). Similar results are also observed in the model for all transit users (model 1.3). For all respondents, in addition to this fear, riders who do not perceive any of the taken or suggested measures to be effective in making them feel safe, expect to travel 100% less by public transit. Fear and a sense of safety therefore appear to be highly important factors. Other significant factors are travel frequency, gender and the possibility to work from home.

The frequent transit users model (model 2.2) clearly resonates with the findings from the summary statistics. From the car ownership factor, it can be concluded that there is an expected difference in future loyalty to public transit between the choice users and the groups without car access. When it comes to fear, however, this does not differ significantly between the three groups.

Table 2
Table 2.Model of the performed logistic regression analysis for all respondents. The model was built up per sub model. The left column shows the variables. The right column shows per sub model the value of the beta coefficient for each variable and whether the variable has a significant effect on the model. The regression category is ‘(expected travel with public transportation is) not less’ (n = 532)

*p < 0.05

**p < 0.01

Table 3
Table 3.Model of the performed logistic regression analysis for the group of frequent public transportation users. The model was built up per sub model. The left column shows the variables. The right column shows per sub model the value of the beta coefficient for each variable and whether the variable has a significant effect on the model. The regression category is ‘(expected travel with public transportation is) not less’ (n = 211)

*p < 0.05

**p < 0.01

In conclusion, we expect to see changes in travel mode choice in the near future as we begin to recover from the effects of the pandemic. Specifically, we expect an increase in the use of (electric) bicycles, scooters and shared cars and a decrease in the overall usage of public transport. Based on two logistic regression analyses, this change in public transit loyalty is mostly caused by feelings of fear and lack of safety, while car ownership, gender, travel frequency and the possibility of working from home also play a role.

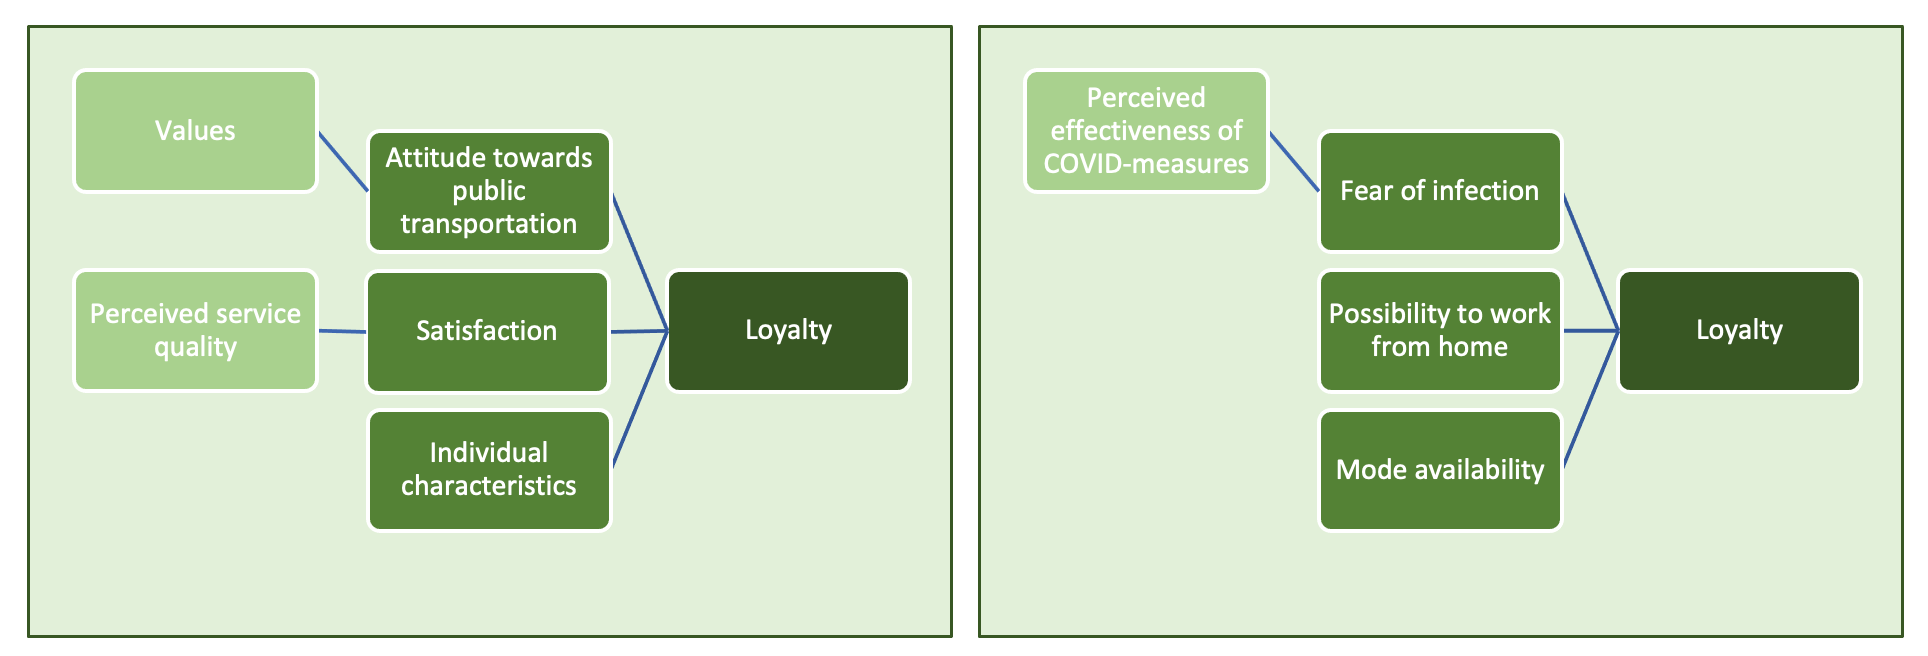
Under pre-COVID-19, or non-pandemic circumstances, travel satisfaction is one of the most important drivers for public transit loyalty (Allen et al. 2019; Carreira et al. 2014; C.-F. Chen 2008; S.-C. Chen 2012; Lai and Chen 2011; Shiftan, Barlach, and Shefer 2015; Widjaja, Astuti, and Manan 2019). However, loyalty in the years 2020 and 2021 is expected to be determined largely by fear and mode availability, meaning that common conceptualizations of public transit loyalty must be revisited during, and directly after, pandemic situations (figure 4).

Figure 4
Figure 4.Conceptual model based on the literature (left) and a conceptual model based on the results of the present study

Acknowledgments

The authors would like to thank the Province of Utrecht for facilitating this research project. Their input and advice was useful, and their press release about the present study helped to recruit respondents. We are also grateful for the contribution of local consulting firm Moventem, which cooperated in making a comprehensive survey and facilitated the data collection. Finally, we thank the respondents for their time, as well as the anonymous reviewers for their helpful feedback.

Submitted: October 20, 2020 AEST

Accepted: December 12, 2020 AEST

References

Allen, Jaime, Laura Eboli, Carmen Forciniti, Gabriella Mazzulla, and Juan de Dios Ortúzar. 2019. “The Role of Critical Incidents and Involvement in Transit Satisfaction and Loyalty.” Transport Policy 75 (March):57–69. https:/​/​doi.org/​10.1016/​j.tranpol.2019.01.005.
Google Scholar
Carreira, Rui, Lia Patrício, Renato Natal Jorge, and Chris Magee. 2014. “Understanding the Travel Experience and Its Impact on Attitudes, Emotions and Loyalty towards the Transportation Provider-A Quantitative Study with Mid-Distance Bus Trips.” Transport Policy 31 (January):35–46. https:/​/​doi.org/​10.1016/​j.tranpol.2013.11.006.
Google Scholar
Chen, Ching-Fu. 2008. “Investigating Structural Relationships between Service Quality, Perceived Value, Satisfaction, and Behavioral Intentions for Air Passengers: Evidence from Taiwan.” Transportation Research Part A: Policy and Practice 42 (4): 709–17. https:/​/​doi.org/​10.1016/​j.tra.2008.01.007.
Google Scholar
Chen, Shu-Ching. 2012. “The Customer Satisfaction-Loyalty Relation in an Interactive e-Service Setting: The Mediators.” Journal of Retailing and Consumer Services 19 (2): 202–10. https:/​/​doi.org/​10.1016/​j.jretconser.2012.01.001.
Google Scholar
Krizek, Kevin J., and Ahmed El-Geneidy. 2007. “Segmenting Preferences and Habits of Transit Users and Non-Users.” Journal of Public Transportation 10 (3): 71–94. https:/​/​doi.org/​10.5038/​2375-0901.10.3.5.
Google Scholar
Lai, Wen-Tai, and Ching-Fu Chen. 2011. “Behavioral Intentions of Public Transit Passengers-The Roles of Service Quality, Perceived Value, Satisfaction and Involvement.” Transport Policy 18 (2): 318–25. https:/​/​doi.org/​10.1016/​j.tranpol.2010.09.003.
Google Scholar
Lau, J. T. F., X. Yang, H. Tsui, and J. H. Kim. 2003. “Monitoring Community Responses to the SARS Epidemic in Hong Kong: From Day 10 to Day 62.” Journal of Epidemiology & Community Health 57 (11): 864–70. https:/​/​doi.org/​10.1136/​jech.57.11.864.
Google ScholarPubMed CentralPubMed
Shiftan, Yoram, Yotam Barlach, and Daniel Shefer. 2015. “Measuring Passenger Loyalty to Public Transport Modes.” Journal of Public Transportation 18 (1): 1–16. https:/​/​doi.org/​10.5038/​2375-0901.18.1.7.
Google Scholar
Translink. 2020. “Impact Corona Virus.” https:/​/​app.powerbi.com.
Van Lierop, Dea, and Ahmed M. El-Geneidy. 2016. “Enjoying Loyalty: The Relationship between Service Quality, Customer Satisfaction, and Behavioral Intentions in Public Transit.” Research in Transportation Economics 59 (November):50–59. https:/​/​doi.org/​10.1016/​j.retrec.2016.04.001.
Google Scholar
Wang, Kuo-Ying. 2014. “How Change of Public Transportation Usage Reveals Fear of the SARS Virus in a City.” PloS One 9 (3): e89405. https:/​/​doi.org/​10.1371/​journal.pone.0089405.
Google ScholarPubMed CentralPubMed
Widjaja, Ady, Widji Astuti, and Abdul Manan. 2019. “The Relationship between Customer Satisfaction and Loyalty: Evidence on Online Transportation Services in Indonesia.” International Journal of Advances in Scientific Research and Engineering 5 (4): 214–22. https:/​/​doi.org/​10.31695/​ijasre.2019.33166.
Google Scholar

This website uses cookies

We use cookies to enhance your experience and support COUNTER Metrics for transparent reporting of readership statistics. Cookie data is not sold to third parties or used for marketing purposes.

Powered by Scholastica, the modern academic journal management system