Loading [Contrib]/a11y/accessibility-menu.js
Findings
  • Menu
  • Articles
    • Resilience Findings
    • Transport Findings
    • Urban Findings
    • All
  • For Authors
  • Editorial Board
  • About
  • Blog
  • search

    Sorry, something went wrong. Please try your search again.
    ×

    • Articles
    • Blog posts

RSS Feed

Enter the URL below into your favorite RSS reader.

https://findingspress.org/feed
×
Transport Findings
December 15, 2020 AEST

Cycling Injury Risk in London: Impacts of Road Characteristics and Infrastructure

Thomas Adams, Rachel Aldred,
road characteristics risk cycling infrastructure injury route environment
Copyright Logoccby-sa-4.0 • https://doi.org/10.32866/001c.18226
Photo by Matthew Waring on Unsplash
Findings
Adams, Thomas, and Rachel Aldred. 2020. “Cycling Injury Risk in London: Impacts of Road Characteristics and Infrastructure.” Findings, December. https://doi.org/10.32866/001c.18226.
Save article as...▾
  • PDF
  • XML
  • Citation (BibTeX)
Data Sets/Files (6)
Download all (6)
  • Figure 1: Control and injury points
    Download
  • Table 1: Data sources
    Download
  • Figure 2: Cycle infrastructure in London
    Download
  • Figure 3: types of cycle infrastructure (source: London Cycle Design Standards)
    Download
  • Table 2: Descriptive statistics, route environment characteristics
    Download
  • Table 3: Predictors of cycling injury in London when commuting in the morning
    Download

Sorry, something went wrong. Please try again.

If this problem reoccurs, please contact Scholastica Support

Error message:

undefined
×

View more stats

Abstract

This study of cycling injury risk in London examines impacts of road characteristics and environment, including different types of cycling infrastructure. It controlled for exposure by using a case-crossover method alongside an algorithm developed by Transport for London to predict cyclist routes. When compared to no infrastructure, this study found that protected cycle infrastructure reduced odds of injury by 40-65% in the morning commute, whereas advisory lanes increased injury odds by 34%. Junctions were found to increase injury odds threefold; higher pedestrian density also increased injury odds. This study supports growing evidence of a ‘safety in numbers’ effect.

Research Questions

Road safety interventions have traditionally been prioritised by looking at absolute number of casualties at different locations. Whilst this helps practitioners identify dangerous locations, it will not capture the relative risk per user of different types of infrastructure or route environment.

To assess how characteristics of the route environment affect injury risk for each individual road user, we need to control for exposure (Vandenbulcke, Thomas, and Int Panis 2014; Vanparijs et al. 2015). Epidemiological methods offer ways of doing this. Case-control studies control for exposure by comparing aggregate injury locations to aggregate control locations, with control locations selected from modelled or measured flow data (Miller et al. 2017; Aldred et al. 2018; Meuleners et al. 2019).

By contrast, in case-crossover studies each person serves as their own control, reducing intrapersonal confounding. Control points are selected from a person’s route prior to injury, as in Teschke et al. (2012). This study uses a similar method, however, using a cycling route prediction algorithm to generate cyclist routes rather than recall.

Methods and Data

Britain’s database for police-reported traffic incidents, Stats19, was used to identify cycle injury locations, with casualty home postcode data provided via Transport for London (TfL). Between 2016-2018, 13,700 cycling injuries were reported to police in London. After removing non-London residents and incorrect home postcodes, 11,936 injuries remained.

As we only had home postcode data rather than journey origins, we could only use injuries sustained where a person’s home was likely the starting point. For the purposes of routing, their trip needed to be for utility purposes (A to B; i.e. not a weekend leisure ride which might not follow typical utility routing patterns). Morning commuter travel fits both requirements. Therefore, only collisions occurring between 7-10am on weekdays and involving people over 16 were used. This left a total of 2,876 injury points, most of which (86.7%, or 2,494) were slight injuries. 375 were serious and 7 were fatal.

Routes were predicted between home and injury locations on TfL’s Cynemon network (which contains all roads and other routes that can legally be cycled) using the Network Analyst tool in ArcGIS. The route prediction tool was programmed to use Cynemon generalised costs for commuters, which places route directness above other factors such as infrastructure and traffic volumes. Cynemon is a cycling assignment model which has primarily been developed to support appraisal of cycling interventions and formation of cycling policy. As such, Cynemon can estimate cyclist routes, flows and journey times.

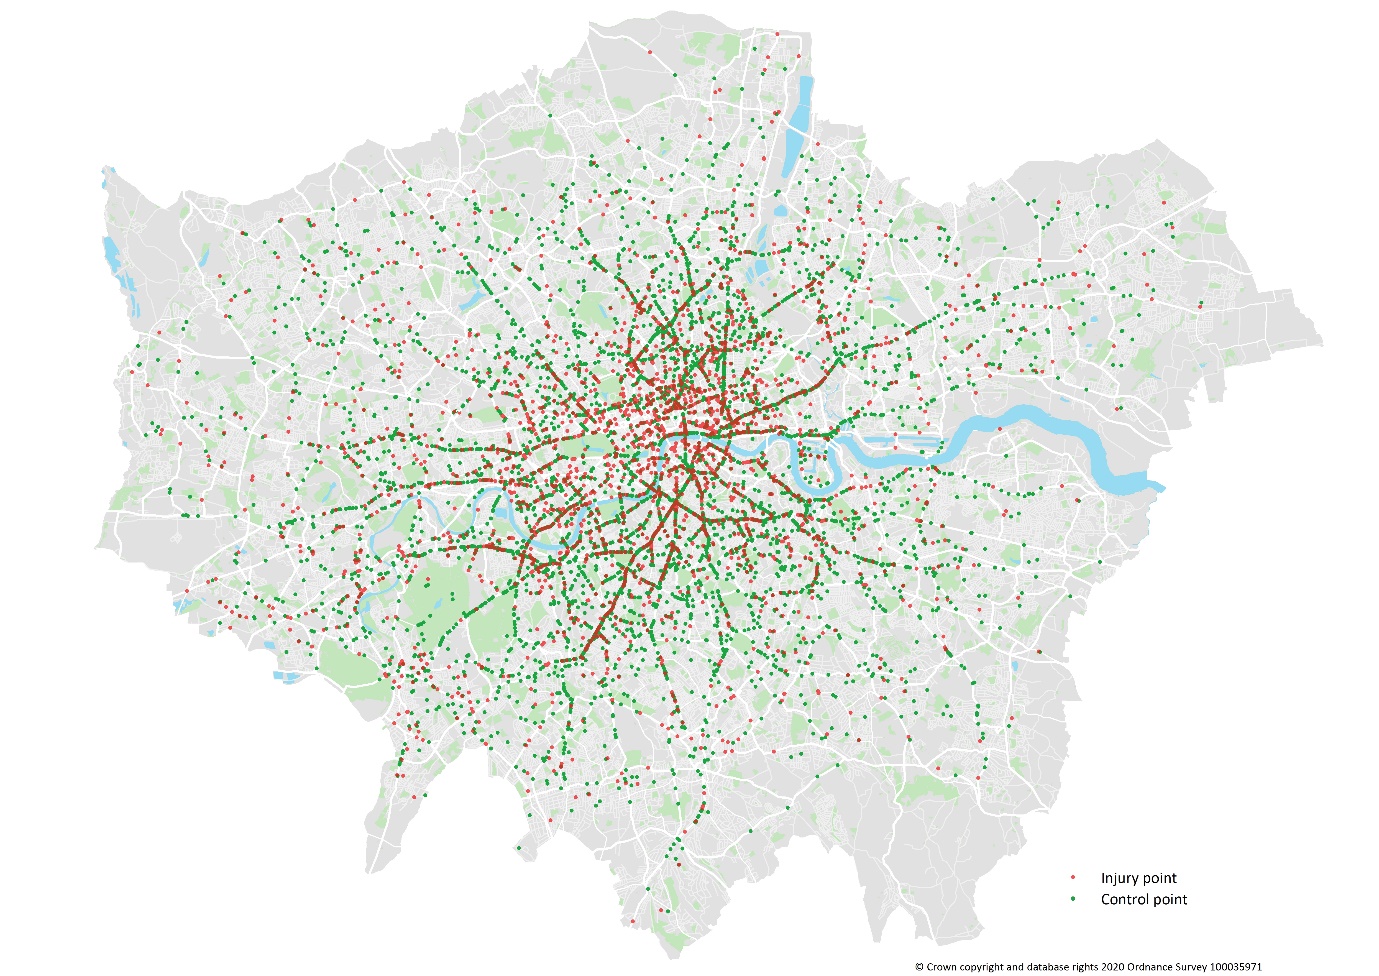
A control point was introduced for each 3km of a cyclist’s route, i.e. 1 point for routes under 3km, 2 points for routes 3-6km. This method resulted in 5,754 control points, i.e. almost double the number of injury points - which was the target. 80% of control points were for routes under 12km (67% for under 9km). Control points were then selected at random points along the route by using the Random Point Generator tool in ArcGIS. Figure 1 shows the location of these points across Greater London.

Figure 1
Figure 1:Control and injury points

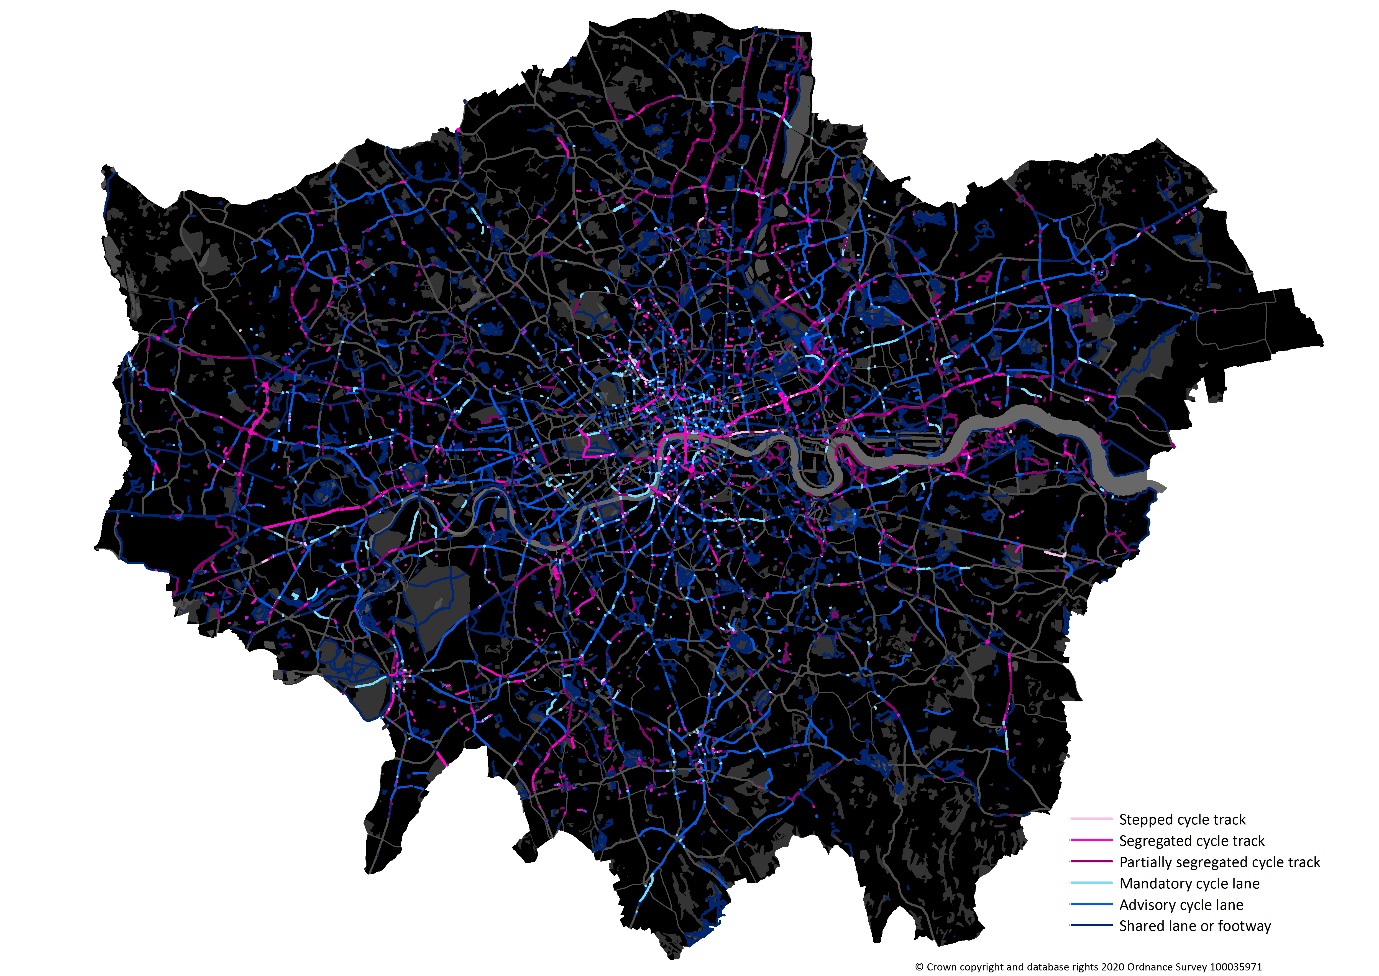
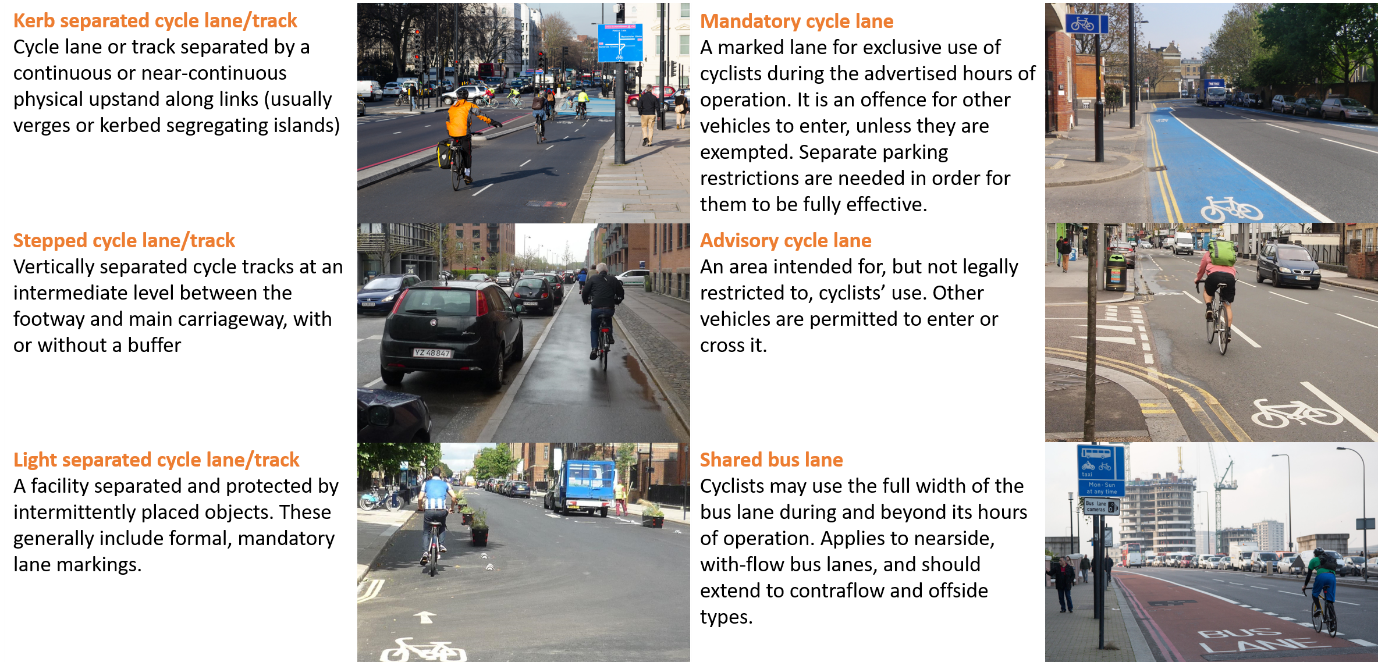
Table 1 shows route environment datasets used and sources. Figure 2 illustrates cycling infrastructure in London, taken from the TfL Cycle Infrastructure Database, separated into different types of infrastructure, and Figure 3 provides a composite image of different facility types.

Table 1:Data sources
Variable Categories Dataset (source)
Area Central/Inner/Outer London Greater London Authority boundary data
Road type 4 classes ITN network (Ordnance Survey)
Intersection yes/no ITN network (Ordnance Survey)
Speed limit 20mph/>20mph Digital speed limit map (TfL)
Bus lane yes/no Bus lane database (TfL)
Bus stop yes/no Bus stop database (TfL)
Speed (mph) Log transformed morning peak speeds Trafficmaster (DfT)
Cycle infrastructure:
mandatory cycle lane,
advisory cycle lane, on/off
carriageway, partially or
light kerb-separated cycle
lane/track, kerb-separated
cycle lane/track, stepped
cycle lane/track
yes/no Cycle Infrastructure Database (TfL)
Cycle flow (per hour) Log transformed flows Cynemon (TfL)
Traffic flow (per hour) Log transformed flows Highway Assignment Model (TfL)
Pedestrian density
(metres walked per square
metre, per hour)
Log transformed pedestrian density LTDS (TfL)
Figure 2
Figure 2:Cycle infrastructure in London
Figure 3
Figure 3:types of cycle infrastructure (source: London Cycle Design Standards)

The cycling flow data uses 2016 AM peak hour (08:00-09:00) link flows from Cynemon, which have been calibrated and validated using observed counts. Aggregate temporal and seasonal factors from Strava data were applied to the Cynemon flows to increase precision and better align with the injury data. Temporal factors derived from London Travel Demand Survey (LTDS) data were applied to the pedestrian and traffic flow data. Traffic speed data was obtained from Trafficmaster via DfT: this uses data from GPS-enabled vehicles to generate average flows at peak and off-peak times.

Road classes were ‘A’, ‘B’, ‘C’ and ‘Other’. A roads are primary roads, which include TfL-managed ‘red routes’, carrying up to 30% of London’s traffic despite only making up 5% of roads. B roads are secondary roads, while C roads tend to connect local roads with A or B roads, and ‘Other’ roads include residential and private roads.

We performed statistical analysis using similar methodology to Aldred et al. (2018), with binary logistic regression modelling to predict whether a location was an injury or control point. Coefficients (odds ratios) were produced for each variable after controlling for other factors. This indicated whether the variable increased or decreased cycling injury odds and a corresponding significance level (we chose p<0.05 as our threshold). All analysis was undertaken in the statistical package R (https://www.r-project.org/) and the mixed-effects models were fitted using the ‘glmer’ function (https://www.rdocumentation.org/packages/lme4/versions/1.1-25/topics/glmer).

Findings

Table 2 provides descriptive statistics for route environment characteristics included in the final model, alongside the proportion of points for each characteristic that represent injury sites. Across all points, this proportion is 33.3%, so any value higher than this means an over-representation of injury points for that variable category.

Coefficients related to whether a point was in Inner, Outer, or Central London do not reflect differences in the ‘real’ risks in each area. Apparent higher risk in Inner and Central areas is an artefact of the method as control points, by definition, lie closer to home than work. Instead, we included this variable to control for possible differences between these areas not included in the table below.

Table 2:Descriptive statistics, route environment characteristics
Variable Categories Injury Control % Injury points
Area Central 777 975 44.3%
  Inner 1298 2762 32.0%
  Outer 801 2017 28.4%
Road type A Road 1750 3788 31.6%
  B Road 320 329 49.3%
  C Road 303 672 31.1%
  Other 503 965 34.3%
Intersection No 544 2471 18.0%
  Yes 2332 3283 41.5%
20mph limit No 1707 3536 32.6%
  Yes 1169 2218 34.5%
Bus lane No 2341 4332 35.1%
  Yes 535 1422 27.3%
Bus stop No 2745 5186 34.6%
  Yes 131 568 18.7%
Speed (miles per hour) 0-10 716 1062 40.3%
  10-20 1986 4152 32.4%
  20-30 164 491 25.0%
  30-40 10 49 16.9%
Kerb-separated cycle lane / track No 2797 5505 33.7%
  Yes 79 249 24.1%
Partially or light separated cycle lane / track No 2794 5556 33.5%
  Yes 82 198 29.3%
Stepped cycle lane / track No 2869 5710 33.4%
  Yes 7 44 13.7%
Mandatory cycle lane No 2784 5544 33.4%
  Yes 92 210 30.5%
Advisory cycle lane No 2294 4825 32.2%
  Yes 582 929 38.5%
 
 
Cycle flow (cyclists per hour) 0-100 2081 3859 35.0%
  100-250 611 1370 30.8%
  250-500 169 456 27.0%
  >500 15 69 17.9%
Traffic flow (motor vehicles per hour) 0-250 654 1300 33.5%
  250-500 998 2003 33.3%
  500-750 574 1160 33.1%
  750-1000 334 620 35.0%
  >1000 316 671 32.0%
Pedestrian density (metres walked per square metre, per hour) 0-3 1990 4273 31.8%
  3-6 528 974 35.2%
  6-9 173 271 39.0%
  9-12 76 112 40.4%
  >12 109 124 46.8%
All points 2876 5754 33.3%

Table 3 presents the results of the two models, alongside univariate odds ratios. Model 1 controlled for road characteristics whilst model 2 also controlled for road user flows (other cyclists, pedestrians, motor traffic). Variables for which p=>0.1 were removed before re-running the models, which made no substantive difference to results.

Table 3:Predictors of cycling injury in London when commuting in the morning
Variable Categories Univariate OR Model 1 OR (95% CI) Model 2 OR (95% CI)
Region Central 1.00 1.00 1.00
Inner 0.59 0.62 (0.55, 0.71)*** 0.57 (0.50, 0.65)***
Outer 0.50 0.54 (0.47, 0.63)*** 0.43 (0.37, 0.51)***
Road type A Road 1.00 1.00 1.00
  B Road 2.11 2.14 (1.79, 2,55)*** 1.91 (1.59, 2.30)***
  C road 0.98 1.10 (0.94, 1.29) 1.01 (0.85, 1.20)
  Other 1.13 1.30 (1.13, 1.49)*** 0.95 (0.79, 1.13)
Intersection No 1.00 1.00 1.00
  Yes 3.23 3.02 (2.70, 3.37)*** 2.96 (2.65, 3.31)***
Bus Lane No 1.00 1.00 1.00
  Yes 1.09 0.70 (0.62, 0.80)*** 0.77 (0.67,0.87)***
Bus Stop No 1.00 1.00 1.00
  Yes 0.70 0.52 (0.42, 0.64)*** 0.53 (0.43, 0.65)***
Kerb separated cycle track No 1.00 1.00 1.00
  Yes 0.62 0.54 (0.41,0.72)*** 0.60 (0.45, 0.80)***
Stepped cycle track No 1.00 1.00 1.00
  Yes 0.82 0.29 (0.12, 0.70)** 0.35 (0.15, 0.85)*
Advisory cycle lane No 1.00 1.00 1.00
  Yes 1.32 1.21 (1.06, 1.37)** 1.34 (1.18, 1.52)***
Traffic speed Change per 1 log2 increase - 0.75 (0.67, 0.82)*** 0.73 (0.66, 0.81)***
Cycle flow Change per 1 log2 increase - - 0.87 (0.84, 0.90)***
Pedestrian density Change per 1 log2 increase - - 1.06 (1.01, 1.12)*
Traffic flow Change per 1 log2 increase -  - 1.04 (0.99, 1.09)’

*** p < 0.001, ** p < 0.01, * p < 0.05, 'p < 0.1

Cycling at intersections increases injury odds threefold. This is in line with literature on intersections (e.g. Quddus 2008; Harris et al. 2013) and the odds ratio is similar to Aldred et al’s London study (2018). B roads were relatively risky compared both to residential streets and A roads. These findings differ from Teschke et al. (2012) and Aldred et al. (2018).

Kerb separated cycle infrastructure reduced injury odds substantially; by 40% compared to no infrastructure. Stepped tracks were even more protective, reducing injury odds by 65%, albeit with large confidence intervals due to low numbers (0.15-0.85, CI 95%). These findings are in line with Teschke et al. (2012) and in London, Li, Graham, and Liu (2017). By contrast, painted cycle lanes did not reduce injury. Mandatory painted lanes did not lead to any risk reduction and advisory lanes (which motor vehicles are legally permitted to enter) increased injury odds by over 30%.

Bus lanes reduced injury odds, although less than protected cycle infrastructure. Bus stops were also, surprisingly, associated with reduced risk. Perhaps they provide a respite from parked cars, which increase risk (Teschke et al. 2012) but are not included in this study.

There is evidence of a ‘safety in numbers’ effect as an increase in cycle flow reduced injury odds (e.g. Jacobsen 2003; Marques and Hernández-Herrador 2017; Aldred et al. 2018). The study suggests that a doubling of cyclists in the morning commute reduces cycling injury odds by 13%.

Higher pedestrian density and traffic volume increased risk, although the latter was only borderline significant. A doubling in pedestrian density increased cycling injury odds by 6%. This finding reflects the increased risk of busy high streets, town centres or business hubs.

Counterintuitively, risk decreased as speed increased. When looking at the absolute numbers it appears that roads with speeds less than 10mph are more dangerous, indicating congestion could increase risk. However, an increase in speed is likely to increase severity of a given injury (Elvik 2013).

In conclusion, cycle infrastructure on main roads and junctions must be protected (kerb separated or stepped tracks, rather than painted lanes), particularly when there is high traffic and/or pedestrian activity.


Acknowledgements

A special gratitude goes to Transport for London and the Strategic Analysis department, as this study would not have been possible without its data and support. University College London provided a platform for this research which is also appreciated.

Submitted: October 29, 2020 AEST

Accepted: December 08, 2020 AEST

References

Aldred, Rachel, Anna Goodman, John Gulliver, and James Woodcock. 2018. “Cycling Injury Risk in London: A Case-Control Study Exploring the Impact of Cycle Volumes, Motor Vehicle Volumes, and Road Characteristics Including Speed Limits.” Accident Analysis & Prevention 117 (August): 75–84. https://doi.org/10.1016/j.aap.2018.03.003.
Google ScholarPubMed CentralPubMed
Elvik, Rune. 2013. “A Re-Parameterisation of the Power Model of the Relationship between the Speed of Traffic and the Number of Accidents and Accident Victims.” Accident Analysis & Prevention 50 (January): 854–60. https://doi.org/10.1016/j.aap.2012.07.012.
Google Scholar
Harris, M Anne, Conor C O Reynolds, Meghan Winters, Peter A Cripton, Hui Shen, Mary L Chipman, Michael D Cusimano, et al. 2013. “Comparing the Effects of Infrastructure on Bicycling Injury at Intersections and Non-Intersections Using a Case-Crossover Design.” Injury Prevention 19 (5): 303–10. https://doi.org/10.1136/injuryprev-2012-040561.
Google ScholarPubMed CentralPubMed
Jacobsen, P L. 2003. “Safety in Numbers: More Walkers and Bicyclists, Safer Walking and Bicycling.” Injury Prevention: Journal of the International Society for Child and Adolescent Injury Prevention 9 (3): 205–9. https://doi.org/10.1136/ip.9.3.205.
Google ScholarPubMed CentralPubMed
Li, Haojie, Daniel J. Graham, and Pan Liu. 2017. “Safety Effects of the London Cycle Superhighways on Cycle Collisions.” Accident Analysis & Prevention 99 (Pt A) (February): 90–101. https://doi.org/10.1016/j.aap.2016.11.016.
Google Scholar
Marques, R., and V. Hernández-Herrador. 2017. “On the Effect of Networks of Cycle-Tracks on the Risk of Cycling. The Case of Seville.” Accident Analysis & Prevention 102: 181–90.
Google Scholar
Meuleners, Lynn B., Mark Stevenson, Michelle Fraser, Jennie Oxley, Geoffrey Rose, and Marilyn Johnson. 2019. “Safer Cycling and the Urban Road Environment: A Case Control Study.” Accident Analysis & Prevention 129 (August): 342–49. https://doi.org/10.1016/j.aap.2019.05.032.
Google Scholar
Miller, Philip D., Denise Kendrick, Carol Coupland, and Frank Coffey. 2017. “Use of Conspicuity Aids by Cyclists and Risk of Crashes Involving Other Road Users: Population Based Case-Control Study.” Journal of Transport & Health 7 (December): 64–74. https://doi.org/10.1016/j.jth.2017.03.008.
Google Scholar
Quddus, Mohammed A. 2008. “Modelling Area-Wide Count Outcomes with Spatial Correlation and Heterogeneity: An Analysis of London Crash Data.” Accident Analysis & Prevention 40 (4): 1486–97. https://doi.org/10.1016/j.aap.2008.03.009.
Google Scholar
Teschke, Kay, M. Anne Harris, Conor C. O. Reynolds, Meghan Winters, Shelina Babul, Mary Chipman, Michael D. Cusimano, et al. 2012. “Route Infrastructure and the Risk of Injuries to Bicyclists: A Case-Crossover Study.” American Journal of Public Health 102 (12): 2336–43. https://doi.org/10.2105/ajph.2012.300762.
Google ScholarPubMed CentralPubMed
Vandenbulcke, Grégory, Isabelle Thomas, and Luc Int Panis. 2014. “Predicting Cycling Accident Risk in Brussels: A Spatial Case-Control Approach.” Accident Analysis & Prevention 62 (January): 341–57. https://doi.org/10.1016/j.aap.2013.07.001.
Google Scholar
Vanparijs, Jef, Luc Int Panis, Romain Meeusen, and Bas de Geus. 2015. “Exposure Measurement in Bicycle Safety Analysis: A Review of the Literature.” Accident Analysis & Prevention 84 (November): 9–19. https://doi.org/10.1016/j.aap.2015.08.007.
Google Scholar

Powered by Scholastica, the modern academic journal management system